

Figure 1.
Photochromism of diarylethene 1O

A New Diarylethene Probe for Colorimetric Detection of CN- and Fluorescent Recognition of Zn2+/H2PO4-
Lu Diao , Renjie Wang , Niansheng Wang , Gang Liu , Shouzhi Pu


Cations and anions have series important meanings in biological processes.[1] Among those ions, Zn2+ is one of the most abundant transitional elements, in the terms of biological processes, such as enzyme regulation, brain function, protein synthesis, DNA (deoxyribonucleic acid) repair and neurotransmission.[2] Those evidences exhibited that Zn2+ is related to a various of neurological diseases, such as Alzheimer's diseases, amyotrophic lateral sclerosis, hypoxia-ischemia and epilepsy.[3] According to the WHO (World Health Organization) data displayed, more than 40% children in Africa and Asia were caused harmful problems because of the limited uptake of Zn2+.[4] Meanwhile, a large amount of Zn2+ can lead to phytotoxic effects on soil microbes.[5] Therefore, it is highly desirable to develop sensitive and selective sensor to detect Zn2+ in the environment, living cells, and tissues. Similarly, phosphate and cyanide anions are required to avoid excessive presence in biological processes generated by stoichiometric imbalance in living systems. Cyanide is highly toxic and it has significant lethality when it is exposed to the organism and the environment, such as causing vomiting, convulsion, thus causing dyspnea and even death.[6] However, this does not hinder its application in metallurgy, plastic processing, petrochemical, photographic, resins and herbicides.[7] ${{\rm{H}}_2}{\rm{PO}}_{\rm{4}}^ - $ plays an important role in metabolic process, energy storage and construction of the backbone of DNA and RNA (ribonucleic acid).[8] Some common diseases, including hyperthyroidism, kidney failure, bone disorders, and hypertension are caused by excessive phosphates.[9] As a result, highly sensitive and selective sensors for Zn2+, CN-, and ${{\rm{H}}_2}{\rm{PO}}_{\rm{4}}^ - $ detection are becoming very urgent. Although, numerous chemosensors had been reported, the probe can identify the CN- and Zn2+ at the same time with different detection ways are rarely developed. In addition, as one of good photoswitch unit, diarylethene derivatives have been widely used in the design and synthesis of photochemical sensors due to their high sensitivity, real-time analysis and simple operation.[10] During the past decades, many diarylethene chemosensors were reported to recognize Zn2+ or CN-.[11] However, photocontrolled diarylethene chemosensors can detect the ${{\rm{H}}_2}{\rm{PO}}_{\rm{4}}^ - $, CN- and Zn2+ at the same time and they are rarely.
Taking into account the above mentioned facts, a new diarylethene chemosensor (1O) with a naphthol unit was synthesized and characterized, in which 2-hydroxybenzyli- dene-aminonaphthol was attached to a photochromic diarylethene as pendant ligand (Eq. 1). The compound exhibited "naked-eye" recognition of CN-, and remarkable "Turn-on" fluorescence response for detecting of Zn2+ with high selectivity. The schematic illustration of photochromism is shown in Figure 1.
|
|
(1) |
The photochromic behaviors of diarylethene 1O were tested by photoirradiation in acetonitrile (c=2.0×10⁻⁵ mol·L-1) at 297 K. As shown in Figure 2, owing to the π→π* transition, a sharp opened-ring isomer (1O) absorption peak was observed at 274 nm (εmax=5.05×10⁴ L·mol-1·cm-1). The peak of the open-ring isomer at 274 nm was declined slowly with irradiation of 297 nm UV light, meanwhile, a new broad absorption peak at 516 nm was gradually appeared (εmax=3.68×10³ L·mol-1·cm-1) due to the π electron delocalization, indicating the formation of the closed-ring form 1C.[12] After arrived at the photostationary state (PSS), the color of 1O solution changed from colorless to light pink, and a clear isosbestic point was observed at 409 nm, which supported the reversible two component photochromic reaction. Conversely, upon irradiation with visible light of wavelength longer than 500 nm, the closed-ring isomer 1C was reversed back to 1O accompanying with the solution color changed from pink to colorless. The cyclization and cycloreversion quantum yields of 1O were determined by using the 1, 2-bis(2-methyl-5-phenyl-3-thienyl)perfluorocyclopentene as reference, and it values were determined to be 0.037 and 0.20, which was smaller than 2O (Ф2, O-C=0.21). The results demonstrate that the amino-naphthol group could inhibit the photocyclization of 1O, the reason may be due to its strong electron-withdrawing property.

The photophysical properties of colorimetric sensing ability of diarylethene 1O were investigated by monitoring the absorption spectral behavior upon the addition of various anions, such as CN-, F-, Cl-, Br-, SCN-, AcO-, ${\rm{CO}}_{\rm{3}}^{2 - }$, ${\rm{SO}}_{\rm{3}}^{2-}$, ${\rm{SO}}_{\rm{4}}^{2-}$, ${\rm{PO}}_{\rm{4}}^{3-}$, ${{\rm{S}}_2}{\rm{O}}_3^{2-}$, ${\rm{HCO}}_{\rm{3}}^{-}$, ${\rm{HSO}}_3^{-}$, ${\rm{HPO}}_{\rm{4}}^{2-}$, ${\rm{HSO}}_{\rm{4}}^{2-}$ and ${{\rm{H}}_2}{\rm{PO}}_{\rm{4}}^{-}$ in acetonitrile (0.2 μmol· L-1). Figure 3A shows variations of the absorption spectra of 1O in acetonitrile in the presence of different anions. It is clear that 1O shows an absorption band centered at 490 nm upon the addition of CN- and F-, while other anions have no effect on its absorption spectra. The results indicated that 1O could efficient detection CN- and F- with good sensitivity over other anions in acetonitrile. Figure 3B exhibited that with increasing concentration of CN-, the absorbance of 1O at 490 nm gradually enhanced. After addition of 24.0 μmol·L-1 of CN-, the absorption intensity of 1O arrived at a plateau accompanied with a notable color change from colorless to orange due to the formation of 1O+CN-. Figure 3B inset displayed a good linear calibration curve between absorbance at 490 nm and concentration of CN-, indicating that 1O could be potentially used as a ratiometric colorimetric sensor for quantitatively detecting CN- at the range of 0→30.0 μmol·L-1. Similar response to F- was observed under the same conditions for 1O (Figure 4). An obvious absorbance was gradually appeared at 490 nm and the color solution of 1O changed from colorless to orange with the stimulation of F- (0→80.0 μmol·L-1). Figure 4 inset also exhibited a good linearity between the concentration of F- and the absorption in the range of 0→48.0 μmol·L-1, demonstrating that 1O could quantitatively detect F- at the relevant concentration.

Inset: (A) the absorption intensity at 490 nm with the addition of different anions), and (B) the solution color and absorbance changes at 488 nm with the addition of CN-

Inset was the solution color and absorbance changes at 488 nm with the addition of F-
The binding mode and stoichiometry of 1O to CN-/F- were evaluated by Job's plot experiments, [13] the absorbance at 490 nm was plotted as a function of the molar fraction of 1O under a constant total concentration at 2.0× 10⁻⁵ mol·L-1, and the changes of CN-/F- molar fraction from 0 to 1 (Figure 5). The results showed that the molar fraction of [1O]/[1O+CN-/F-] was 0.5 when the concentration of the complex 1O+CN-/F- arrived the maximum value, demonstrating 1:1 binding stoichiometry ration for 1O+CN-/F-. The results were further confirmed by the 1H NMR titration experiments. It was found that two peaks at 8.73 (Ha, phenol-H) and 13.18 (Hb, naphthol-H) were present in the 1H NMR spectrum of 1O in CD3CN without CN-/F-. However, the signal peaks intensity at 8.73 and 13.18 gradually vanished accompany with the addition of CN-/F- to 1O, suggesting the formation of 1O+CN-/F- compound. The binding constants (Ka) of 1O with CN-/F- were determined to be 1.20×10⁴ and 1.86×10⁴ L·mol-1 according to the Hildebrand-Benesi experiments.[14] The limit of detection (LOD) of 1O toward CN-/F- was calculated as 1.03×10⁻⁶ and 3.43×10⁻⁶ mol·L-1, respectively. Moreover, the competitive experiments of 1O+ CN-/F- with various anions were carried out in order to estimate the specificity. As shown in Figure 6, there were no obvious changes in the absorbance of 1O+CN-/F- when other anions were added to the solution containing 1O+CN-/F- except for ${\rm{HSO}}_{\rm{4}}^{-}$ and CH3COO-. Particularly, the absorbance and color of 1O+F- could notably decrease and nearly bleach by stimulating with HSO4- and CH3COO-. These results indicated that 1O could be served as a high selectivity and sensitivity colorimetric probe to recognize CN-/F-.


Subsequently, the photo-isomerization of 1O+CN- compound was studied by UV-Vis spectral absorption. As shown in Figure 7, upon irradiation with 313 nm light, the absorbance peaks at 338 and 490 nm were gradually decreased, and a new obvious visible absorption band appeared at 644 nm (εmax=4.74×10³ L·mol-1·cm-1) with the orange solution turned to green. The reason may be ascribed to the formation of the closed-ring isomer 1C+CN-, which could be completely recovered to the original color and absorption spectrum of 1O+CN- when irradiated with visible light (λ > 500 nm).

Inset: the solution color changes
The interactions of 1O with various metal ions were also studied by fluorescence spectrum in acetonitrile (c=2.0×10⁻⁵ mol·L-1) (Figure 8A). It could be seen that 1O showed poorly fluorescent at 603 nm. Upon the addition of 0.2 mmol·L-1 Al3+, Zn2+, Mg2+, Cd2+, Fe3+, Co2+, Ni2+, Cu2+, Cr3+, Ca2+, Ba2+, Pb2+, Sr2+, Sn2+, Hg2+, Mn2+, K+and Ag+ in acetonitrile, the fluorescence emission intensity of 1O exhibited no obvious changes. However, when stimulated by Zn2+, a strong emission peak was observed at 578 nm and the fluorescence color changed from dark to bright yellow (Figure 8B), indicating the formation of 1O-Zn2+ complex, which emission wavelength was distinct blue-shifted 25 nm comparison with 1O. The complexation between 1O and Zn2+ induced that fluorescence enhancement features maybe attributed to the blocked C=N isomerization and chelated enhanced fluorescence (CHEF) effects.[15]

(A) Emission spectra; (B) photographs of fluorescence
Further, in order to study the binding properties of 1O to Zn2+, the fluorescence titration experiments were performed. As shown in Figure 9A, the original fluorescence emission peak at 578 nm was gradually increased with increasing the concentration of Zn2+ (0→1.4 mmol·L-1), and then the spectrum followed by a plateau with further titration. Compared to 1O, the emission intensity of 1O-Zn2+ was enhanced 32-fold, and the fluorescence quantum yield was determined to be 0.15. The corresponding binding constant was estimated to be 3.03×10³ L·mol-1, and the limit of detection (LOD) was calculated to be 2.98×10⁻⁸ mol·L-1. Notably, the fluorescence intensity of 1O-Zn2+ could completely restore when added excessive EDTA aqueous solution, demonstrating that EDTA binding with Zn2+ was stronger than 1O in acetonitrile. Furthermore, the strong fluorescence emission band of 1O-Zn2+ at 578 nm could switch off by irradiating with 313 nm light because the formation of the non-fluo- rescence closed-ring isomer 1C-Zn2+ (Figure 9B). The fluorescence of 1O-Zn2+ was quenched to 91% and the bright yellow solution became dark when the photoisomerization reaction arrived at the PSS. It is worth noting that the fluorescence of 1C-Zn2+ can not be restored to the initial state under the exposure with visible light. The results indicated that 1O could be used as an "off-on-off" fluorescence switch under the dual regulation of Zn2+ and 313 nm light.

Inset: its emission intensity curve at 578 nm with the addition of different concentration of Zn2+
Subsequently, Job's plot curve and 1H NMR spectra experiments were carried out to determine the binding mode between 1O and Zn2+. As shown in Figure 10A, the complex concentration got the maximum when the molecular fraction of 1O reached 0.7, suggesting 2:1 stoichiometric complexation between 1O and Zn2+. These data were further supported by 1H NMR titration analysis of 1O-Zn2+complex formation (Figure 10B). It was clearly seen that the peak intensity of OHa (naphthol-Ha) at 13.77 was gradually disappeared with increasing Zn2+ from 0 to 0.4 mmol·L-1. While the chemical shifts of OHb (phenol-Hb) at 9.48 and CHc (CHc=N) at 8.98 undergo an upfield shift to 9.22 and 8.80, respectively. Meanwhile, two new signals were observed at 10.66 and 9.81, corresponding to the OHb' (phenol-Hb') and CHc' (CHc'=N). These results further confirmed that the stoichiometric ratio between 1O and Zn2+ were 2:1. Based on these a plausible binding scheme was presented in Scheme 1, where the oxygen atoms of phenol/naphthol and the nitrogen atoms of C=N double bond are the most chelating atoms and participated in the complexation.


Figure 11A shows the selectivity of the fluorescence response of 1O-Zn2+ to various anions in acetonitrile (c=2.0×10⁻⁵ mol·L-1). The emission spectral of 1O-Zn2+induced by anions (0.1 mmol·L-1) such as CN-, F-, Cl-, Br-, SCN-, AcO-, ${\rm{CO}}_{\rm{3}}^{2-}$, ${\rm{SO}}_{\rm{3}}^{2-}$, ${\rm{SO}}_{\rm{4}}^{2-}$, ${\rm{PO}}_{\rm{4}}^{3-}$, ${{\rm{S}}_2}{\rm{O}}_3^{2-}$, ${\rm{HCO}}_{\rm{3}}^{-}$, ${\rm{HSO}}_3^{-}$, ${\rm{HSO}}_{\rm{4}}^{-}$, ${\rm{HPO}}_{\rm{4}}^{2-}$ and ${{\rm{H}}_2}{\rm{PO}}_{\rm{4}}^{-}$. It could be seen that no obvious effects on the fluorescence intensity of 1O-Zn2+when Cl-, Br-, SCN-, ${\rm{SO}}_{\rm{3}}^{2-}$, ${\rm{SO}}_{\rm{4}}^{2-}$, ${{\rm{S}}_2}{\rm{O}}_3^{2-}$, ${\rm{HSO}}_3^{-}$, and ${{\rm{H}}_2}{\rm{PO}}_{\rm{4}}^{-}$ were added to 1O-Zn2+ solution (0.5 mmol·L-1). While CN-, F-, AcO-, ${\rm{CO}}_{\rm{3}}^{2-}$, ${\rm{PO}}_{\rm{4}}^{3-}$ and ${\rm{HCO}}_{\rm{3}}^{-}$ can induce its fluorescence intensity decrease to some extent. Notably, when ${{\rm{H}}_2}{\rm{PO}}_{\rm{4}}^{-}$ and ${\rm{HSO}}_{\rm{4}}^{-}$ were added to the acetonitrile solution containing 1O-Zn2+, the fluorescence intensity of 1O-Zn2+ was quenched to 97% and 94%, respectively, with an obvious color change from bright yellow to dark (Figure 11B). The results demonstrated that 1O-Zn2+ complex could be served as a good probe to detect ${{\rm{H}}_2}{\rm{PO}}_{\rm{4}}^{-}$ and ${\rm{HSO}}_{\rm{4}}^{-}$. In a fluorometric titration, addition of ${{\rm{H}}_2}{\rm{PO}}_{\rm{4}}^{-}$ to the solution of 1O-Zn2+ resulted in a gradually decrease of the emission intensity centered at 578 nm. By plotting the fluorescence intensity at 578 nm as a function of ${{\rm{H}}_2}{\rm{PO}}_{\rm{4}}^{-}$ concentration (0→20 μmol·L-1), a good relationship curve was obtained (Figure 11B). Similarly, ${\rm{HSO}}_{\rm{4}}^{-}$ can also turn off the fluorescence emission intensity of 1O-Zn2+. The results indicated that 1O-Zn2+could be potentially used as ratiometric fluorescent sensor for recognizing ${{\rm{H}}_2}{\rm{PO}}_{\rm{4}}^{-}$/ ${\rm{HSO}}_{\rm{4}}^{-}$. Furthermore, the association constants were calculated to be 8.29×10⁴ L·mol-1 (R=0.993) for ${{\rm{H}}_2}{\rm{PO}}_{\rm{4}}^{-}$ and 6.86×10⁴ L·mol-1 (R=0.997) for ${{\rm{H}}_2}{\rm{PO}}_{\rm{4}}^{-}$ according to a Benesi-Hildebrand plot, and the LOD of 1O-Zn2+ for detecting ${{\rm{H}}_2}{\rm{PO}}_{\rm{4}}^{-}$/${\rm{HSO}}_{\rm{4}}^{-}$ were estimated to be 6.55× 10⁻⁷ and 1.27×10⁻⁷ mol·L-1, respectively.

Inset: its emission intensity curve at 578 nm with the addition of different concentration of H2PO4-
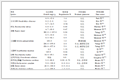
Subsequently, in order to comparison with reported chemosensors, some recently published related studies were summarized in Table 1, and some important parameters such as the LOD and binding constants, and stokes shift values. It could be seen that 1O had lower LOD value for detecting Zn2+, and high sensitivity in the range of 10-7 for recognizing ${{\rm{H}}_2}{\rm{PO}}_{\rm{4}}^{-}$. The binding constant of 1O was of the order 103 for Zn2+, which was the small level compared to other probes. However, diarylethene 1O could effectively recognize both CN- and ${{\rm{H}}_{\rm{2}}}{\rm{PO}}_{\rm{4}}^{-}$ with the normal level binding constants (104), the multi sensing characteristics of 1O had much more advantages than other probes. The results provided a useful design strategy for constructing a multi-functional probe for the selective recognition based on unimolecule photochromic diaryl- ethene with a certain functionalized group.
 下载:
导出CSV
| Ref. | Sensor | Binding constant Ka/(L·mol-1) | LOD/(L·mol-1) | Stokes shift/nm |
| [16] |  |
3.07×10³ (Zn2+) | 1.22×10⁻⁶ (Zn2+) | 30 nm |
| [17] |  |
1.90×10⁵ (Zn2+) | 6.85×10⁻⁸ (Zn2+) | 28 nm |
| [18] |  |
2.50×10⁶ (Zn2+) | 4.90×10⁻⁸ (Zn2+) | 64 nm |
| [19] |  |
1.17×10⁴ (Zn2+) | 4.90×10⁻⁸ (Zn2+) | 23 nm |
| This work |  |
3.03×10³ (Zn2+) 1.20×10⁴ (CN-) 8.29×10⁴ (${{\rm{H}}_{\rm{2}}}{\rm{PO}}_{\rm{4}}^{-}$) |
2.98×10⁻⁸ (Zn2+) 1.03×10⁻⁶ (CN-) 6.55×10⁻⁷ (${{\rm{H}}_{\rm{2}}}{\rm{PO}}_{\rm{4}}^{-}$) |
25 nm |
In conclusion, a new colorimetric and fluorometric diarylethene sensor containing a 2-hydroxybenzylidene-ami- nonaphthol group had been developed. The compound exhibited "naked-eye" detection for CN- with high selectivity and lower LOD in acetonitrile. Meanwhile, it also showed highly sensitively for detecting Zn2+ with a 2:1 binding stoichiometry, and the LOD for Zn2+ reached to 0.3 nmol·L-1. Additionally, the 1O-Zn2+ complex could efficiently recognize ${{\rm{H}}_{\rm{2}}}{\rm{PO}}_{\rm{4}}^{-}$/${\rm{HSO}}_{\rm{4}}^{-}$ with the LOD of 6.55×10⁻⁷ and 1.27×10⁻⁷ mol·L-1, respectively. These results suggested that 1O could be used as an efficient multifunctional sensor for detecting CN-, ${{\rm{H}}_2}{\rm{PO}}_{\rm{4}}^{-}$, and Zn2+.
All solvents were of analytical grade and used without further purification. Other reagents were used as-received. 1H NMR and 13C NMR spectra were measured with a Bruker AVANCE NEO 500 MHz FT-NMR spectrometer (tetramethylsilane as the internal standard). Mass spectra were collected using an Agilent 1100 ion trap LC/MS MSD system. Metal ions, such as Al3+, Zn2+, Mg2+, Fe3+, Co2+, Ni2+, Cu2+, Cr3+, Ca2+, Pb2+, Sr2+, Mn2+and Ag+were prepared by dissolving the corresponding metal nitrates (0.1 mmol) in distilled water (2.0 mL), other metal ions like Ba2+, Cd2+, Hg2+, Sn2+, and K+ were prepared with their chlorides. Anions, except ${\rm{CO}}_{\rm{3}}^{2-}$, ${\rm{SO}}_{\rm{3}}^{2-}$, ${\rm{SO}}_{\rm{4}}^{2-}$, ${\rm{PO}}_{\rm{4}}^{3-}$, ${{\rm{S}}_2}{\rm{O}}_3^{2-}$, ${\rm{HCO}}_{\rm{3}}^{-}$, ${\rm{HSO}}_3^{-}$, ${\rm{HSO}}_{\rm{4}}^{-}$, ${\rm{HPO}}_{\rm{4}}^{{\rm{2-}}}$ and ${{\rm{H}}_2}{\rm{PO}}_{\rm{4}}^{-}$ that were prepared with their sodium salts, remaining anions (CN-, F-, Cl-, Br-, SCN- and AcO-) were obtained by their tetrabutylammonium salts (0.1 mmol) in distilled water (2.0 mL). EDTA solution was gained with ethylenediaminetetraacetic acid disodium salt (Na2EDTA) (1.0 mmol) in distilled water (10.0 mL). Hitachi F-4500 fluorescence spectrophotometer and Agilent 8454 were used in performing fluorescence spectra and UV/Vis photoirradiation with an MUL-165 UV lamp and MVL-210 visible lamp. Melting point was determined using a WRS-1B melting point apparatus. Elemental analysis was studied by a PE CHN 2400 analyzer. Photoirradiation experiments were performed on a setup consisting of an SHG-200 UV lamp, CX-21 ultraviolet fluorescence analysis cabinet, and BMH-250 visible lamp.
1-(3, 5-dimethyl-4-isoxazol)-2-(2-methyl-5-[4-hydroxy-3-aldehyde]-thiophene-3-yl)perfluorocyclopentene (2) was synthesized following a series of previously reported methods.[20]
In a 100 mL flask, a mixture of diarylethene (2) (0.24 g, 0.5 mmol), 2-aminonaphthol (3) (0.08 g, 0.5 mmol) in anhydrous ethanol (5.0 mL) was stirred and refluxed for 6 h. After cooling the mixture solution to the room temperature, the crude product was washed several times with ethanol and diethyl ether, and dried under vacuum to afford 0.20 g (64% yield) 1O as a red solid. m.p. 215~216 ℃; 1H NMR (500 MHz, DMSO-d6) δ: 13.82 (s, 1H), 10.14 (s, 1H), 9.14 (s, 1H), 7.99 (s, 1H), 7.84 (s, 1H), 7.78 (d, J=5.0 Hz, 1H), 7.69~7.66 (m, 2H), 7.42 (s, 1H), 7.36 (t, J=15.0 Hz, 1H), 7.28 (t, J=15.0 Hz, 2H), 7.01 (d, J=5.0 Hz, 1H), 2.25 (s, 3H), 2.02 (s, 3H), 1.97 (s, 3H); 13C NMR (126 MHz, DMSO-d6) δ: 10.72, 12.27, 14.58, 104.45, 110.44, 117.62, 118.32, 120.16, 121.70, 123.94, 124.66, 126.25, 126.57, 128.40, 129.53, 130.87, 133.86, 140.97, 142.22, 150.49, 158.57, 161.64, 162.99, 170.76; ESI-MS m/z: 629.09 [M+H]+. Anal. calcd for C32H22F6N2O3S: C 61.14, H 3.53, N 4.46; found C 61.12, H 3.55, N 4.44.
Supporting Information 1H NMR spectra of 1O in DMSO, 13C NMR spectra of 1O in DMSO and ESI-MS spectra of 1O in CH3CN. 1H NMR titration of 1O in the presence of CN- and F-, the binding constant between 1O+CN-/F-, the limit of detection (LOD) of CN- and F-, the binding constant for 1O-Zn2+and the limit of detection (LOD), changes in emission intensity of 1O-Zn2+upon the addition of different amount of ${\rm{HSO}}_{\rm{4}}^{-}$, the binding constant for 1O-Zn2+with ${{\rm{H}}_2}{\rm{PO}}_{\rm{4}}^{-}$ and ${\rm{HSO}}_{\rm{4}}^{-}$, the limit of detection (LOD) of ${{\rm{H}}_2}{\rm{PO}}_{\rm{4}}^{-}$ and HSO4-. The Supporting Information is available free of charge via the Internet at http://sioc-journal.cn/.
(a) Williams, R. J. P. The Biological Chemistry of the Elements, Clarendon, Oxford, 1991, p. 174.
(b) Bianchi, A.; Bowman-James, K.; García-España, E. Supramolecular Chemistry of Anions, Wiley-VCH, New York, 1997.
(c) Vazquez, M.; Fabrizzi, L.; Taglietti, A.; Pedrido, R. M.; Gonzalez-Noya, A. M.; Bermejo, M. R. Angew. Chem., Int. Ed. 2004, 43, 1962.
(a) Silva, J.-J R. F. D.; Williams, R. J. P. The Biological Chemistry of the Elements: the Inorganic Chemistry of Life, Oxford University Press, Oxford, 2001, p. 315.
(b) Vallee, B. L.; Auld, D. S. Acc. Chem. Res. 1993, 26, 543.
(c) Bush, I.; Pettingell, W. H.; Multhaup, G.; Paradis, M. D.; Vonsattel, J. P.; Gusella, J. F.; Beyreuther, K.; Masters, C. L.; Tanzi, R. E. Science 1994, 265, 1464.
(d) Fraker, P. J.; King, L. E. Annu. Rev. Nutr. 2004, 24, 277.
(e) Cuajungco, M. P.; Lees, G. J. Neurobiol. Dis. 1997, 4, 137.
(f) Frassinetti, S.; Bronzetti, G. L.; Caltavuturo, L.; Cini, M. Della Croce, C. J. Environ. Pathol. Toxicol. Oncol. 2006, 25, 597.
(a) Lai, J.; Moxey, A.; Nowak, G.; Vashum, K.; Bailey, K.; McEvoy, M. J. Affective Disord. 2012, 136, 31.
(b) Weiss, J. H.; Sensi, S. L.; Koh, J. Y. Trends Pharmacol. Sci. 2000, 21, 395.
(c) Maes, M.; Vos, N. D.; Demedts, P.; Wauters, A.; Neels, H. J. Affective Disord. 1999, 56, 189.
Carol, P.; Sreejith, S.; Ajayaghosh, A. Chem. Asian. J. 2007, 2, 338. doi: 10.1002/asia.200600370
(a) Zhang, J. F.; Bhuniya, S. Y.; Lee, H.; Bae, C.; Lee, J. H.; Kim, J. S. Tetrahedron Lett. 2010, 51, 3719.
(b) Voegelin, A.; Pfister, S.; Scheinost, A. C.; Marcus, M. A.; Kretzschmar, R. Environ. Sci. Technol. 2005, 39, 6616.
(c) Callender, E.; Rice, K. C. Environ. Sci. Technol. 2000, 34, 232.
(d) Li, L.; Dang, Y. Q.; Li, H. W.; Wang, B.; Wu, Y. Tetrahedron Lett. 2010, 51, 618.
(a) Tang, L.; Zhou, P.; Zhong, K.; Hou, S. Sens. Actuators, B: 2013, 182, 439.
(b) Kumari, N.; Jha, S.; Bhattacharya, S. J. Org. Chem. 2011, 76, 8215.
(c) Zhang, W.; Xu, K.; Yue, L.; Shao, Z.; Feng, Y.; Fang, M. Dyes Pigm. 2017, 137, 560.
(d) Shan, Y.; Wu, Q.; Sun, N.; Sun, Y.; Cao, D.; Liu, Z. Macromol. Chem. Phys. 2017, 186, 295.
(e) Liu, T.; Huo, F.; Li, J.; Cheng, F.; Ying, C. Sens. Actuators, B 2017, 239, 526.
(a) Hachiya, H.; Ito, S.; Fushinuki, Y.; Masadome, T.; Asano, Y.; Imato, T. Talanta 1999, 48, 997.
(b) Wang, L. Y.; Li, L. Q.; Cao, D. R. Sens. Actuator, B 2017, 239, 1307.
(c) Kalpana, P.; Suganya, S.; Velmathi, S. Spectrochim. Acta, A 2017, 171, 162.
(d) Li, H.; Zhao, P.; Zou, N.; Wang, H.; Sun, K. Tetrahedron Lett. 2017, 58, 30.
Saenger, W. Principles of Nucleic Acid Structure, Springer, New York, 1988.
(a) Paredes, J. M.; Giron, M. D.; Ruedas-Rama, M. J.; Orte, A.; Crovetto, L.; Talavera, E. M.; Salto, R.; Alvarez-Pez, J. M. J. Phys. Chem. B 2013, 117, 8143.
(b) Bhaumik, C.; Das, S.; Maity, D.; Baitalik, S. Dalton Trans. 2011, 40, 11795.
(a) Irie, M. Chem. Rev. 2000, 100, 1685.
(b) Tian, H.; Yang, S. Chem. Soc. Rev. 2004, 35, 85.
(c) Irie, M.; Fukaminato, T.; Sasaki, T. Nature 2002, 420, 759.
(d) Fu, Y. L.; Fan, C. B.; Liu, G.; Pu, S. Z. Sens. Actuators, B 2017, 239, 295.
(e) Zhang, X.-X.; Wang, R. J.; Fan, C. B.; Liu, G.; Pu, S. Z. Dyes Pigm. 2017, 139, 208.
(a) Wang, R. J.; Wang, N. S.; Pu, S. Z.; Zhang, X.-X.; Liu, G.; Dai, Y. F. Dyes Pigm. 2017, 146, 445.
(b) Wang, R. J.; Wang, N. S.; Tu, Y.-Y.; Liu, G.; Pu, S. Z. J. Photochem. Photobiol. A 2018, 364, 32.
(c) Wang, R. J.; Diao, L.; Ren, Q. W.; Liu, G.; Pu, S. Z. ACS Omega 2019, 4, 309.
Irie, M.; Fukaminato, T.; Matsuda, K.; Kobatake, S. Chem. Rev. 2014, 114, 12174. doi: 10.1021/cr500249p
Wu, J. S.; Liu, W. M.; Zhuang, X. Q. Org. Lett. 2007, 9, 33. doi: 10.1021/ol062518z
Wang, H.; Wang, B.; Shi, Z. Biosens. Bioelectron. 2015, 65, 91. doi: 10.1016/j.bios.2014.10.018
(a) Dong, W. K.; Li, X. L.; Wang, L.; Zhang, Y.; Ding, Y. J. Sens. Actuators, B 2016, 229, 370.
(b) Feng, E. T.; Tu, Y.-Y.; Fan, C. B.; Liu, G.; Pu, S. Z. RSC Adv. 2017, 7, 50188.
Yao, K.; Fu, J. X.; Chang, Y. X.; Li, B.; Yang, L.; Xu, K. X. Spectrochim. Acta, Part A 2018, 205, 410. doi: 10.1016/j.saa.2018.07.051
Sabyasachi, T.; Sudipta, D.; Milan, G.; Mahuya, B.; Kumar, H. S.; Pratim, M. P.; Debasis, D. Spectrochim. Acta, Part A 2019, 209, 170. doi: 10.1016/j.saa.2018.10.006
Purkait, R.; Chattopadhyay, D. A.; Sinha, C. Spectrochim. Acta, Part A 2019, 207, 164. doi: 10.1016/j.saa.2018.09.019
Karar, M.; Paul, S.; Biswas, B. Dalton. Trans. 2018, 276, 560.
Cui, S. Q.; Pu, S. Z.; Liu, G. Spectrochim. Acta, Part A 2014, 132, 339. doi: 10.1016/j.saa.2014.04.080

Figure 2 Absorption spectral and color changes of diarylethene 1O by photoirradiation in acetonitrile (c=2.0×10⁻⁵ mol·L-1)

Figure 3 (A) Various anions induced the absorption of 1O, and (B) changes in the absorption of 1O in the presence of different amount of CN- in acetonitrile
Inset: (A) the absorption intensity at 490 nm with the addition of different anions), and (B) the solution color and absorbance changes at 488 nm with the addition of CN-

Figure 4 Absorption spectral changes of 1O in the presence of different amount of F- in acetonitrile
Inset was the solution color and absorbance changes at 488 nm with the addition of F-

Figure 5 (A) Job's plot showing the 1:1 complex of (A) 1O with CN-, and (B) 1O with F-

Figure 6 Competitive tests for the fluorescence responses of 1O induced by CN- (A) and F- (B) in the presence of other anions

Figure 7 Absorption spectral changes of 1O+CN- by photo- irradiation with UV/Vis light in acetonitrile
Inset: the solution color changes

Figure 8 Changes in the fluorescence of 1O induced by the addition of various metal ions (0.5 mmol·L-1) in acetonitrile (c=2.0×10⁻⁵ mol·L-1)
(A) Emission spectra; (B) photographs of fluorescence

Figure 9 (A) Changes in fluorescence of 1O induced by Zn2+/ EDTA, and (B) changes in emission intensity of 1O-Zn2+ by photo irradiation
Inset: its emission intensity curve at 578 nm with the addition of different concentration of Zn2+

Figure 10 (A) Job's plot showing the 2:1 complex of 1O with Zn2+, and (B) 1H NMR spectra of 1O in the presence of Zn2+(0→0.4 mmol·L-1) in acetonitrile

Scheme 1 Photochromism and fluorescence changes of 1O induced by Zn2+, EDTA and lights

Figure 11 (A) Changes in fluorescence of 1O-Zn2+ induced by different anions, and (B) changes in emission intensity of 1O-Zn2+ upon the addition of H2PO4-
Inset: its emission intensity curve at 578 nm with the addition of different concentration of H2PO4-
Table 1. Comparative study of the analytical performance of 1O with other reported sensors
| Ref. | Sensor | Binding constant Ka/(L·mol-1) | LOD/(L·mol-1) | Stokes shift/nm |
| [16] | |
3.07×10³ (Zn2+) | 1.22×10⁻⁶ (Zn2+) | 30 nm |
| [17] | |
1.90×10⁵ (Zn2+) | 6.85×10⁻⁸ (Zn2+) | 28 nm |
| [18] | |
2.50×10⁶ (Zn2+) | 4.90×10⁻⁸ (Zn2+) | 64 nm |
| [19] | |
1.17×10⁴ (Zn2+) | 4.90×10⁻⁸ (Zn2+) | 23 nm |
| This work | |
3.03×10³ (Zn2+) 1.20×10⁴ (CN-) 8.29×10⁴ (${{\rm{H}}_{\rm{2}}}{\rm{PO}}_{\rm{4}}^{-}$) |
2.98×10⁻⁸ (Zn2+) 1.03×10⁻⁶ (CN-) 6.55×10⁻⁷ (${{\rm{H}}_{\rm{2}}}{\rm{PO}}_{\rm{4}}^{-}$) |
25 nm |
 下载: 导出CSV

 扫一扫看文章


扫一扫关注我们

 下载: