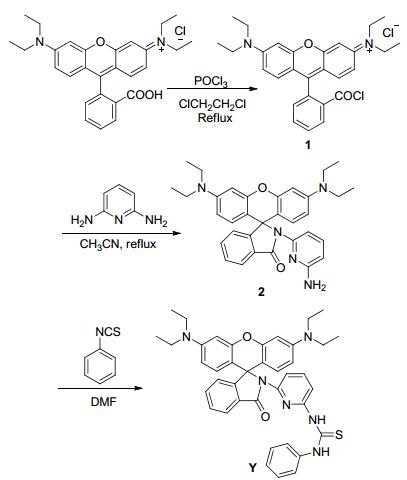
Scheme 1.
Synthesis of Y
A New Fluorescent Probe for Fe3+ and Its Application to Bioimaging
Meipan Yang , Na Su , Yuxiang Li , Li Wang , Lifeng Ma , Yuan Zhang , Jing Li , Bingqin Yang , Longli Kang

Fluorescent probes are widely investigated for the detection and measurement of ions for their simplicity and high sensitivity of response. Obviously, probes not only provide a means of detection to investigate the process of molecular recognition but also can be used as the architecture for assembling a molecular device.[1, 2] Because of the above advantages, fluorescent probes based on the molecular switches for the detection of relevant ions have attracted numerous attentions.[3, 4]
As one of most abundant transition metals in the environment and a vital essential element in the human body, iron plays a crucial role in many biological processes.[5~9] However, iron will go from beneficial to deleterious depending on their concentration.[10~14] As reported, iron promotes oxidative damages inside the cell and does harm to human body.[15, 16] Even, recent studies show that the cellular toxicity caused by iron has been linked with several serious diseases, such as Alzheimer's and Parkinson's diseases.[17~19] Therefore, it is of utmost interest to develop highly sensitive and selective probes for Fe3+.
Up to now, different kinds of probes for Fe3+ have been designed.[20~22] However, most of reported fluorescence probes of Fe3+ were "turn-off" type due to the paramagnetic nature of Fe3+, which is not as sensitive as the fluorescence probe of "turn-on" type. Moreover, some probes can only be used in organic solvents or mixed solvents (organic solvent: water).[23~29] In addition, many of reported probes have not been applied to detect Fe3+ in vitro detection or imaging, which limited their biological application to a large extent. Additionally, poorer selectivity and the unsure interferences from other ions, such as Fe2+, Cr3+, Cu2+ etc., always prevent those probes to be excellent. Therefore, it is still an outstanding challenge to create more new "turn-on" Fe3+ probes with good water-solubility which demonstrated more value of practical applications in biological systems.
Since the pioneering work by Czamik et al., [30] the probes based rhodamine have been extensively designed owing to their excellent photophysical properties. In 2011, Du and coworkers have developed a colorimetric probe for the detection of Fe3+ by "naked-eye". The probe can be directly applied to environmental Fe3+ detection in 100% water medium [31]. Gong et al. [32] synthesized efficient fluorescent Fe3+ probes by linking a conjugated naphthalene chromophore to a rhodamine platform and a lipophilic triphenylphosphonium cation. The probes could monitor mitochondrial Fe3+ in living cells sensitively and selectively. It is the equilibrium between the spirolactam and the ring-opened amide that makes rhodamine to be an ideal pattern for designing probes.[33~36] In order to continue our interests in the design of rhodamine based probes, herein, we described a new "turn-on" Fe3+ probe with high selectivity and sensitivity. The probe was synthesized and confirmed. The recognition progress was based on a metal-coordination induced fluorescent enhancement. The probe spectral responses to Fe3+ in comparison with various biologically relevant metal ions were demonstrated. Additionally, the probe was further used for detecting Fe3+ ions in PC12 cells and the Kunming mouse, which performed remarkable fluorescence imaging.
The probe Y was prepared and confirmed by 1H NMR, 13C NMR, IR and MS. The synthetic routes were shown in Scheme 1.
The density functional theory (DFT) quantum calculations for probe Y was performed by using the Gaussian 09 program at the b3lyp/6-31g level. The related data of bond lengths and optimized structure were shown in Table S1 (Supporting Information) and Figure 1.
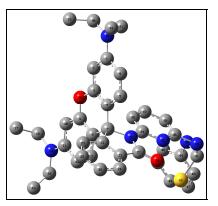
C, N, S and O atoms are colored in gray, blue, yellow and red, respectively
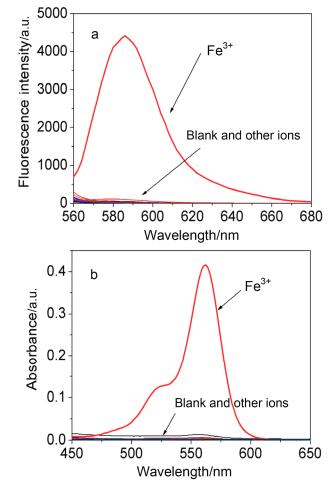
In this study, the sensing properties of probe Y were investigated by UV-Vis and fluorescence measurements in Tris-HCl aqueous buffer solution. It was found that the probe Y displayed sensitive color change from colorless to pink via rhodamine lactam ring opening in presence of Fe3+, which could be easily detected by the naked eye. The addition of other metal ions (including Ag+, Al3+, Ba2+, Co2+, Cu2+, Ca2+, Cd2+, Fe2+, Cr3+, Hg2+, K+, Li+, Mg2+, Mn2+, Na+, Ni2+, Pb2+ and Zn2+) to the solution of Y showed no clear color change (Figure 2). Upon addition of Fe3+, probe Y exhibited a new sharp absorption peak at 562 nm, and a remarkable fluorescence emission peak at 586 nm, which suggested the opening of the rhodamine-spirolactam ring. However, other metal ions did not induce any obvious spectral response. Furthermore, the competition experiments of Fe3+ (15 μmol/L) mixed with 2.0 equiv. of the above-mentioned metal ions (30 μmol/L) were also conducted. No significant variation was observed in fluorescence intensity (Figure 3). Even Cr3+ and Fe2+, as the common competing ions for Fe3+, in this experiment conditions, there were no obvious effect. These facts were indicative of a high selectivity of Y toward Fe3+ over other competitive ions.
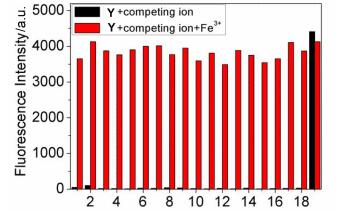
The competing ions: 1, Ag+; 2, Al3+; 3, Ba2+; 4, Ca2+; 5, Cd2+; 6, Co2+; 7, Cu2+; 8, Fe2+; 9, Cr3+; 10, Hg2+; 11, K+; 12, Li+; 13, Mg2+; 14, Mn2+; 15, Na+; 16, Ni2+; 17, Pb2+; 18, Zn2+; 19, Fe3+
For practical applicability, the optimal pH condition of probe was evaluated. No obvious fluorescence for free probe was observed when pH > 5 (Figure S1, see Supporting Information). After the addition of Fe3+ between pH 5 and 8, there was an obvious fluorescence emission. The results indicated that probe could be used in some environmental and physiological regions.
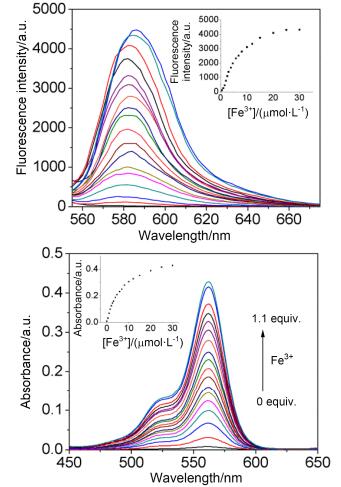
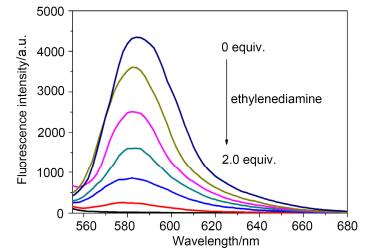
Figure 4 exhibited the UV-Vis and fluorescence spectral variation of probe with the different mount of Fe3+. The free Y, as expected, exhibited almost no absorption near 500 nm, indicating that Y existed as a spirocyclic form. Upon the addition of increasing concentrations of the Fe3+, a new absorption at 562 nm appeared with increasing intensity, which clearly suggesting the formation of the ring-opened form of Y due to Fe3+ binding. The titration curve (a plot of fluorescent intensity vs. Fe3+ concentration) increased linearly and nearly plateaued at 1:1 ratio (probe: Fe3+), suggesting the formation of a 1:1 Fe3+-probe complex. The association constant (Ka) of Y to Fe3+ according to the 1:1 binding mode by non-linear fitting of the spectrometric titration curve was obtained as 8.77×10⁻⁴ mol−1•L. Based on the definition of detection limit, the limit of detection for Fe3+ was up to 0.25 μmol/L (Figure S2, see Supporting Information). Addition of ethylenediamine to the solution of Y and Fe3+ decreased the fluorescence intensity, which indicated the reversibility of recognition process (Figure 5). This result indicated that compound Y could be easily recovered for repeating employ. All these facts illustrated that probe Y could be applied as a fine fluorescent probe for Fe3+.
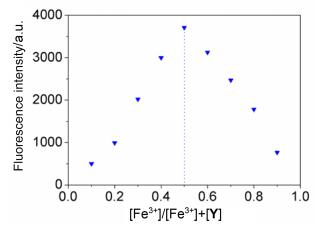
To determine the stoichiometry of the ferric-ligand complex, the Job's plot for fluorescence measurement was applied. Keeping the sum of the initial concentration of Y and Fe3+ at 20 μmol/L, the molar ratio of Fe3+ was changed. As shown in Figure 6, the binding mode was 1:1. The absorption at 500~600 nm is a clear symbol of the opening of rhodamine spirolactam.[32] The fluorescence enhancement was attributed to the Fe3+ induced ring-opened formation of rhodamine spirolactam. According to the familiar binding sites of rhodamine-based Fe3+ probes, Y was most likely to chelate with Fe3+ via its oxygen, sulphur and nitrogen atoms in a special pattern (Eq. 1).
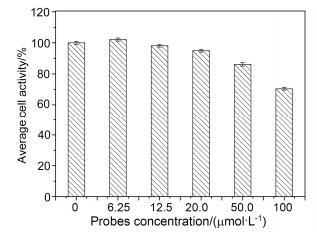
Then, Y was taken to conduct a MTT assay on PC12 cells with different concentrations (0, 6.25, 12.5, 20, 50, 100 μmol/L) to evaluate cytotoxicity. The cellular viability estimated was about 95% with 20 μmol/L Y (Figure 7), exhibiting lower toxicity to cells and being suitable for bioimaging.
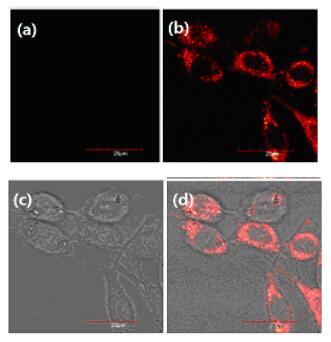
To explore more biological application, the experiment about cell permeability was examined in vivo. As monitored by fluorescence microscopy, incubation of PC12 cells with Y (20 μmol/L) for 1 h at 37 ℃ gave almost no intracellular fluorescence (Figure 8a). As shown in Figure 8b, a red fluorescence increase was observed from the intracellular region after further incubation with Fe3+ (20 μmol/L). A bright field image of PC12 cells treated with Y and Fe3+ implied that the cells were viable throughout the experiments (Figure 8c). The results indicated that the Y was cell permeable and could be used for imaging of Fe3+ in vitro.
(a) Cells incubated with 20 μmol/L probe Y for 1 h. (b) Then further incubated with 20 μmol/L Fe3+ for 1 h. (c) Brightfield image of cells shown in panel, confirming their viability. (d) The overlay image of (b) and (c)
We then evaluated the suitability of the probe for imaging Fe3+ in Kunming mouse body. Pictures were taken under the imaging system. As shown in Figure 9a, there was little fluorescence when the mouse was only treated with Y. Obviously, a large fluorescence signal was captured after the mouse was injected with Y and Fe3+ (Figure 9b). The result established that Y was a desired probe for imaging Fe3+ in the living mouse.
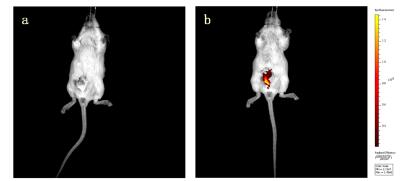
(a) Probe was injected in the intraperitoneal (i.p.) cavity of mouse; (b) Then followed by i.p. injection of Fe3+. Ten minutes after probe injection, the mouse was imaged
In summary, a new fluorescent probe Y was synthesized and the recognition properties for Fe3+ were evaluated. It specifically responded to Fe3+ with high selectivity, sensitivity and excellent photophysical properties. Further studies demonstrated that the probe Y could be employed for bio-imaging toward Fe3+ not only in living cells but also in living animals. We anticipate that the design method may be applicable for other types of fluorescent probes and the probe will find more interesting applications as sensing and labeling agent in Fe3+-related biological and medical studies.
The fluorescence spectra were measured on a HITACHI F-4500 fluorescence spectrophotometer. A Shimadzu UV-1700 spectrophotometer was used for absorption spectra. NMR spectra were performed on a Varian INOVA-400 MHz spectrometer with TMS as internal standard. Mass spectra were measured with a Bruker microTOF Spectroscopy. Results of cytotoxicity were analyzed in a Spectra max190-Molecular Devices. Bioimaging was performed on an Olympus FV1000 confocal microscopy.
The related chemicals were commercially available and used without further purification. The solutions of metal ions were performed from their nitrate or chloride salts. And double distilled water was used throughout the experiments.
Compounds 1 and 2 were synthesized with high yield according to literature.[37, 38]
To a 10 mL of flask, phenyl isothiocyanate (0.12 mL, 1.0 mmol) was dissolved in 1.5 mL of DMF. Then a solution of compound 2 (0.27 g, 0.5 mmol) in DMF (1.5 mL) was added dropwise with vigorous stirring at room temperature for 6 h. Then the mixture was cooled down. Water was then added to the mixture and the aqueous was extracted with dichloromethane. The organic layer was dried over anhydrous MgSO4 and filtered. The crude product was purified by silica gel column chromatography to afford pure probe Y (white solid) in 63.0% yield. m.p. 194~196 ℃. 1H NMR (CDCl3, 400 Hz) δ: 1.14 (t, J=8 Hz, 12H), 3.29 (q, J=8 Hz, 8H), 4.12 (q, J=8 Hz, 1H), 6.18 (dd, J=4, 8 Hz, 2H), 6.26 (d, J=8 Hz, 1H), 6.34 (d, J=4 Hz, 2H), 6.45 (d, J=8 Hz, 1H), 6.58 (d, J=8 Hz, 2H), 7.04 (d, J=8 Hz, 1H), 7.27 (m, 1H), 7.34 (t, J=10 Hz, 1H), 7.42 (m, 4H), 7.79 (d, J=8 Hz, 2H), 7.90 (d, J=4 Hz, 1H), 8.65 (s, 1H); 13C NMR (CDCl3, 100 MHz) δ: 12.6, 14.1, 20.6, 26.9, 44.2, 60.6, 66.7, 98.0, 105.8, 107.7, 108.3, 109.6, 123.6, 123.7, 125.8, 126.0, 127.9, 128.2, 128.3, 128.6, 133.8, 139.4, 139.9, 148.3, 148.8, 150.7, 152.3, 154.0, 167.9, 178.5; IR (KBr) ν: 3414, 2971, 1712, 1612, 1520, 1434, 1356, 1330, 1302, 1258, 1223, 1189, 1152, 1118, 1077, 822, 785, 751, 696, 654 cm-1. Anal. calcd for C40H40N6O2S: C 71.87, H 5.98, N 12.57, S 4.80; found C 71.92, H 5.90, N 12.55, S 4.79. MALDI-TOF MS calcd for C40H41N6O2S (M++1) 669.3006, found 669.2984.
Stock solution of Probe Y (2.0×10⁻⁴ mol•L−1): in a 100 mL of flask, 33.40 mg of Y was dissolved in ethanol, and then diluted to the mark with water. Before spectroscopic measurements, Y was then diluted to the corresponding concentrations.
The solutions of metal ions including Fe3+ were performed from their nitrate or chloride salts.
All samples were dissolved in Tris-HCl aqueous buffer solution. Before determination, the solutions were shaken for 10 s and waited for 20 min. Excitation wavelength was 550 nm. The bandpasses were both set at 5.0 nm.
Supporting Information The related experimental preparations and 1H NMR, 13C NMR and MS spectra. The Supporting Information is available free of charge via the Internet at http://sioc-journal.cn.
Cao, Y. D.; Zheng, Q. Y.; Chen, C. F.; Huang, Z. T. Tetrahedron Lett. 2003, 44, 4751. doi: 10.1016/S0040-4039(03)01074-8
Zhang, L. F.; Zhao, J. L.; Zeng, X.; Mu, L.; Jiang, X. K.; Deng, M.; Zhang, J. X.; Wei, G. Sens. Actuators B 2011, 160, 662. doi: 10.1016/j.snb.2011.08.045
Kim, J. S.; Quang, D. T. Chem. Rev. 2007, 107, 3780. doi: 10.1021/cr068046j
Haim, W.; Orly, A.; Brenda, M.; Jacqueline, L.; Oren, D.; Yitzhak, H.; Yona, C.; Shanzer, A. J. Am. Chem. Soc. 1996, 118, 12368. doi: 10.1021/ja9610646
Meneghini, R. Free Radical Biol. Med. 1997, 23, 783. doi: 10.1016/S0891-5849(97)00016-6
Rouault, T. A. Nat. Chem. Biol. 2006, 2, 406. doi: 10.1038/nchembio807
Eisenstein, R. S. Annu. Rev. Nutr. 2000, 20, 627. doi: 10.1146/annurev.nutr.20.1.627
James, P. S.; Raoul, K. Analyst 2005, 130, 528. doi: 10.1039/b414189j
Aisen, P.; Wessling, R. M.; Leibold, E. A. Curr. Opin. Chem. Biol. 1999, 3, 200. doi: 10.1016/S1367-5931(99)80033-7
Hentze, M. W.; Muckenthaler, M. U.; Andrews, N. C. Cell 2004, 117, 285. doi: 10.1016/S0092-8674(04)00343-5
Wessling-Resnick, M. Crit. Rev. Biochem. Mol. Biol. 1999, 34, 285. doi: 10.1080/10409239991209318
Toyokuni, S. Cancer Sci. 2009, 100, 9. doi: 10.1111/cas.2009.100.issue-1
Fleming, R. E.; Ponka, P. N. Engl. J. Med. 2012, 366, 348. doi: 10.1056/NEJMra1004967
Nadadur, S. S.; Srirama, K.; Mudipalli, A. Indian J. Med. Res. 2008, 128, 533. http://www.ncbi.nlm.nih.gov/pubmed/19106445
Martin, R. B.; Savory, J.; Brown, S.; Bertholf, R. L.; Wills, W. R.; Clin. Chem. 1987, 33, 405. http://www.ncbi.nlm.nih.gov/pubmed/3815806
Braun, V.; Killmann, H. Trends Biochem. Sci. 1999, 24, 104. doi: 10.1016/S0968-0004(99)01359-6
Pithadia A. S.; Lim, M. H. Curr. Opin. Chem. Biol. 2012, 16, 67. doi: 10.1016/j.cbpa.2012.01.016
Burdo, J. R.; Connor, J. R. BioMetals 2003, 16, 63. doi: 10.1023/A:1020718718550
Bonda, D. J.; Lee, H.; Blair, J. A.; Zhu, X.; Perry G.; Smith, M. A. Metallomics 2011, 3, 267. doi: 10.1039/c0mt00074d
Yang, X. H.; Li, S.; Tang, Z. S.; Yu, X. D.; Huang, T.; Gao, Y. Chin. Chem. Lett. 2015, 26, 129 doi: 10.1016/j.cclet.2014.09.025
Bai, Z.; Ren, X.; Gong, Z.; Hao, C.; Chen, Y.; Wan, P.; Meng, X. Chin. Chem. Lett. 2017, 28, 1901 doi: 10.1016/j.cclet.2017.05.005
Gao, Y.; Wang, J.; Fu, M.; Chen, H.; Fang, M. Chin. J. Org. Chem. 2017, 37, 617. doi: 10.6023/cjoc201610014
Song, F. L.; Garner, A. L.; Koide, K. J. Am. Chem. Soc. 2007, 129, 12354. doi: 10.1021/ja073910q
Duan, L. P.; Xu, Y. F.; Qian, X. H. Chem. Commun. 2008, 47, 6339. http://www.ncbi.nlm.nih.gov/pubmed/19048148
Mukherjee, S.; Chowdhury, S.; Paul, A. K.; Banerjee, R. J. Lumin. 2011, 131, 2342. doi: 10.1016/j.jlumin.2011.05.001
Jiang, J.; Jiang, H.; Liu, W.; Tang, X. L.; Zhou, X.; Liu, W. S. Org. Lett. 2011, 13, 4922. doi: 10.1021/ol202003j
Li, H. L.; Fan, J. L.; Du, J. J.; Guo, K. X.; Sun, S. G.; Liu, X. J.; Peng, X. J. Chem. Commun. 2010, 46, 1079. doi: 10.1039/B916915F
Liu, B.; Bao, Y. Y.; Du, F. F.; Wang, H.; Tian, J.; Bai, R. Chem. Commun. 2011, 47, 1731. doi: 10.1039/C0CC03819A
Li, H.; Cao, J.; Zhu, H.; Fan, J.; Peng, X. Tetrahedron Lett. 2013, 54, 4357. doi: 10.1016/j.tetlet.2013.05.094
Dujols, V.; Ford, F.; Czamik, A. W. J. Am. Chem. Soc. 1997, 119, 7386. doi: 10.1021/ja971221g
Wei, D.; Sun, Y.; Yin, J.; Wei, G.; Du. Y. Sens. Actuators, B 2011, 160, 1316. doi: 10.1016/j.snb.2011.09.068
Chen, W.; Gong, W.; Ye, Z.; Lin, Y.; Ning, G. L. Dalton Trans., 2013, 42, 10093. doi: 10.1039/c3dt50832c
Yang, Z.; She, M.; Yin, B.; Cui, J.; Zhang, Y.; Sun, W.; Li, J.; Shi, Z. J. Org. Chem. 2012, 77, 1143. doi: 10.1021/jo202056t
Xiang, Y.; Tong, A. Org. Lett. 2006, 8, 1549. doi: 10.1021/ol060001h
Yin, W.; Cui, H.; Yang, Z.; Li, C.; She, M.; Yin, B.; Li, J.; Zhao, G.; Shi, Z. Sens. Actuators, B 2011, 157, 675. doi: 10.1016/j.snb.2011.04.072
Dong, L.; Wu, C.; Zeng, X.; Mu, L.; Xue, S. F.; Tao, Z.; Zhang, J. X. Sens. Actuators, B 2010, 145, 433. doi: 10.1016/j.snb.2009.12.057
苏娜, 杨美盼, 孟文斐, 杨秉勤, 有机化学, 2015, 35, 175. http://manu19.magtech.com.cn/Jwk_yjhx/CN/abstract/abstract344618.shtmlSu, N.; Yang, M. P.; Meng, W. F.; Yang, B. Q. Chin. J. Org. Chem. 2015, 35, 175(in Chinese). http://manu19.magtech.com.cn/Jwk_yjhx/CN/abstract/abstract344618.shtml
Xiang, Y.; Tong, A.; Jin, P.; Ju, Y. Org. Lett. 2006, 8, 2863. doi: 10.1021/ol0610340

Figure 1 DFT optimized structure of Y
C, N, S and O atoms are colored in gray, blue, yellow and red, respectively

Figure 2 Fluorescence spectra (a) and UV-vis spectra (b) of Y upon addition of different ions in Tris-HCl aqueous buffer solution

Figure 3 Fluorescent intensity of Y upon addition of Fe3+ in the presence of competing ions
The competing ions: 1, Ag+; 2, Al3+; 3, Ba2+; 4, Ca2+; 5, Cd2+; 6, Co2+; 7, Cu2+; 8, Fe2+; 9, Cr3+; 10, Hg2+; 11, K+; 12, Li+; 13, Mg2+; 14, Mn2+; 15, Na+; 16, Ni2+; 17, Pb2+; 18, Zn2+; 19, Fe3+

Figure 4 Changes in fluorescence spectra (a) and (b) UV-Vis absorption spectra of Y with various amounts of Fe3+

Figure 5 Fluorescence intensity changes of Y upon the addition of each equiv. of ethylenediamine with the presence of Fe3+.

Figure 8 Fluorescence images in PC12 cells
(a) Cells incubated with 20 μmol/L probe Y for 1 h. (b) Then further incubated with 20 μmol/L Fe3+ for 1 h. (c) Brightfield image of cells shown in panel, confirming their viability. (d) The overlay image of (b) and (c)

 扫一扫看文章

扫一扫关注我们
 下载:
下载:

 下载:
下载:


 下载:
下载: