Received Date:
20 December 2019 Accepted Date:
21 February 2020 Available Online:
01 October 2020
Fund Project:
Abstract:
A novel two-dimensional nanosheet fluorescent probe embedded with rare earth Eu(Ⅲ) was developed to detect dipicolinic acid (DPA), a biomarker of Bacillus anthracis bacterial spores. DPA, a major component of Bacillus anthracis spores which were highly toxic to humans, was not found in other common bacteria. The ability to detect ultra-low concentrations of DPA would therefore be of great significance. Eu(Ⅲ)-doped ytterbium hydroxide nanosheets were obtained by mechanical exfoliation from layered rare-earth hydroxide (LRH) materials. The crystallinities, layered structure and morphology of the as-synthesized nanosheets were studied by power X-ray diffraction, transmission electron microscopy and atomic force microscopy. Eu(Ⅲ) emission increased linearly with DPA addition in the range of 0.1~30 μmol/L. Based on the antenna effect, the detection limit of DPA was 0.078 μmol/L and much lower than the infective dose of Bacillus anthracis in humans of 60 μmol/L. The nanosheet fluorescent probe exhibited good specificity toward DPA, and the interferences with selected aromatic ligands and amino acids were observed to be negligibly small in comparison with that of DPA. Our findings provide a basis for the application of Eu(Ⅲ)-doped nanosheets for accurate, sensitive, and selective monitoring of DPA as a biomarker of anthrax.
Following a severe outbreak of anthrax in the United States in 2001, Bacillus anthracis has attracted considerable attention in research. Bacillus anthracis is gram-positive and one of the largest pathogenic bacteria. The inhalation of anthrax spores into the respiratory tract can result in the development of a highly infectious disease with a high mortality rate[1-5]. Dipicolinic acid (DPA) is a chemical component that accounts for 5 to 15% of the dry weight of bacterial spores[6-9], and is a unique biomarker of Bacillus anthracis. Accurate and sensitive detection of DPA can facilitate the identification of Bacillus anthracis contamination.
Lanthanide elements exhibit weak fluorescence during the forbidden f-f electron transition. When combined with a trivalent europium ion (Eu(Ⅲ)), DPA can sensitize Eu(Ⅲ) excitation, which results in significantly increased fluorescence intensity during the energy absorption-emission process[10-12]. Nanomaterials have a specialized surface and exhibits interface effects, and their small size is often advantageous. Nanosheets are excellent candidates for the preparation of biochemical probes because of their unique two-dimensional structures and excellent physical and chemical properties.
This study aimed to develop a novel nanosheet probe doped with Eu(Ⅲ). The effects of the interaction between Eu(Ⅲ) and DPA were evaluated based on fluorescence intensity at 614 nm and was observed to increase with DPA concentration. Thus, the nanosheet was used to detect Bacillus anthracis. The nanosheet probes exhibited good selectivity and were not affected by potentially interfering organic ligands and amino acids.
2.
EXPERIMENTAL
2.1
Chemicals and reagents
The following chemicals of analytical purity were obtained from J & K Chemicals and were used directly without further purification: yttrium oxide (Y2O3), europium oxide (Eu2O3), concentrated nitric acid, sodium benzoate, ethanol, pyridine-2, 6-dicarboxylic acid (DPA), benzoic acid (BA), o-dibenzoic acid (o-PA), m-dibenzoic acid (m-PA), p-dibenzoic acid (p-PA), trimesic acid (TMA), glycine (Gly), D-aspartic acid (ASP), and the peptide glutathione (GSH).
2.2
Synthesis of Eu(Ⅲ)-dopedY1.94Eu0.06(OH)5[C6H5COO]·2H2O nanosheets
A preparation method used in a previous study was used to synthesize 3% Eu(Ⅲ) doped yttrium hydroxide layered material Y1.94Eu0.06(OH)5[C6H5COO]·2H2O[13]. The layered material (0.05 g) was dispersed in 100 mL of ethanol and subjected to ultrasonic dispersion and centrifugation at 4000 r/min speed to obtain a nanosheet sol. The concentration of Eu(Ⅲ) in the nanosheet sol was 21.7 μmol/L.
2.3
Detection of DPA
To detect DPA, a mother liquor with a concentration of 50 μmol/L DPA was diluted with ethanol to give a series of concentrations ranging from 0 to 30 μmol/L. A 30μL aliquot of the nanosheet sol probe was added to each DPA solution, and a fixed total volume of 2000 μL was used (pH = 7). Using an excitation wavelength of 280 nm, the fluorescence intensity of Eu(Ⅲ) at 614 nm was measured for each solution.
3.
RESULTS AND DISCUSSION
3.1
Characterization of Y1.94Eu0.06(OH)5[C6H5COO]·2H2O nanosheets
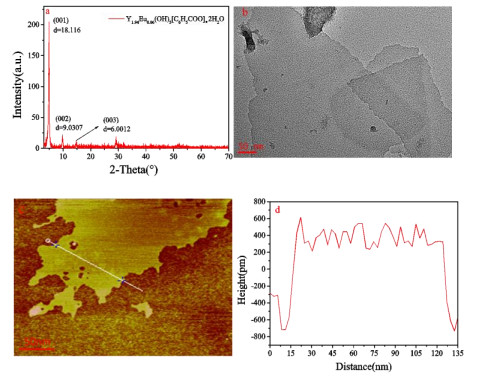
The crystallinities and layered structure of prepared compound Y1.94Eu0.06(OH)5[C6H5COO]·2H2O were examined by power X-ray diffraction (XRD). Fig. 1a shows the XRD patterns of the Y1.94Eu0.06(OH)5[C6H5COO]·2H2O sample. The typical LRHS characteristic diffraction peaks were showed in spectrum. Three strong diffraction peaks, which represent the characteristics of the layered structure, appeared at d values of 18.116 (2θ = 4.9°), 9.0307 (2θ = 9.8°) and 6.0012 (2θ = 14.9°), and respectively corresponded to the (001), (002), and (003) crystal planes. The baseline was stable, and the diffraction peaks were sharp and narrow, indicating that the compound has a higher order of crystal plane growth, and better crystallinity. The layered compound was peeled off by a mechanical method, obtaining the nanosheets. The morphology and thickness of nanosheets were obtained by transmission electron microscopy and atomic force microscopy test. Transmission electron microscopy (TEM) and atomic force microscopy (AFM) images clearly showed the morphology of the nanosheets (Figs. 1b and 1c), where the thickness of the nanosheets was 1 nm (Fig. 1d).
Figure 1
Figure 1.
Layered structure of compounds Y1.94Eu0.06(OH)5[C6H5COO]·2H2O obtained by (a) Power X-ray diffraction (XRD); images of the nanosheets acquired using (b) Transmission electron microscopy (TEM); (c) Atomic force microscopy (AFM) and (d) Nanosheet thickness
3.2
Response of nanosheet fluorescent probe to DPA
Lanthanide ions have intrinsically weak fluorescence emission because the emission arises from forbidden f-f electron transitions. The ligand-containing chromophore (antenna) coordinates with lanthanide ions, and the triplet excited state of the ligand transfers energy to the emission state of the lanthanide ions to enhance lanthanide luminescence. The phenomenon is called the antenna effect. After coordination with trivalent europium ion, DPA can sensitize Eu(Ⅲ) under the excitation of ultraviolet light, and the fluorescence intensity is greatly increased by absorptionenergy transfer-emission[10-12].
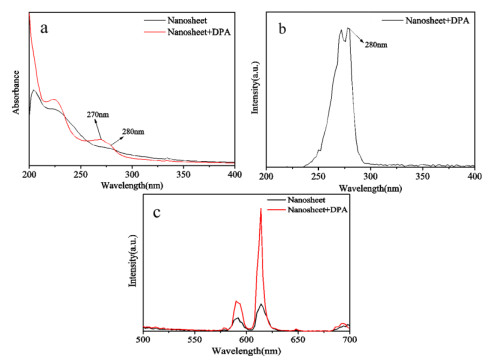
In order to verify the suitable excitation wavelength, the UV-visible absorption spectra (Fig. 2a) before and after the addition of DPA and the fluorescence excitation spectra (Fig. 2b) after adding DPA were tested. In Fig. 2a, the absorption band of DPA in the region of 190-240 nm was that the aromatic pyridine ring allows π-π * or πring-πCO transition. The absorption bands in 270 and 280 nm belong to the CT transition (charge transfer state)[14]. In Fig. 2b, the best excitation wavelength also appeared at 280 nm. Under the suitable excitation at 280 nm[15, 16], the fluorescence emission spectra of the nanosheets before and after adding DPA were tested, with the results shown in Fig. 2c, the fluorescence intensity was obviously enhanced after adding DPA.
Figure 2
Figure 2.
(a) UV absorption spectra before and after the addition of DPA to nanosheets. (b) Excitation spectra after adding DPA to nanosheets. (c) Emission spectra before and after the addition of DPA to nanosheets
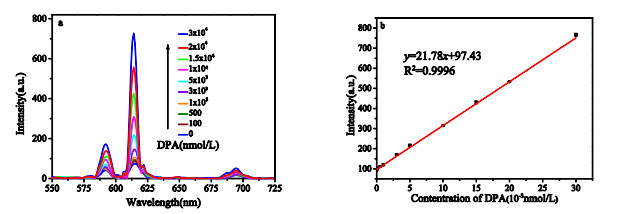
The fluorescence intensity of Eu(Ⅲ) at 614 nm increased with increasing DPA concentration (Fig. 3a). According to the results of three sets of parallel experiments, the effect was linear in the range of 0.1~30 μmol/L (Fig. 3b). The linear equation was y = 21.78x + 97.43 with a correlation coefficient (R2) of 0.9996. According to the formula C(LOD) = 3σ/k, the detection limit of DPA was 0.078 μmol/L, which was much lower than the infective dose of Bacillus anthracis in humans of 60 μmol/L[17-19].
Figure 3
Figure 3.
(a) Fluorescence spectra; (b) linear relationship between dipicoli-nic acid (DPA) concentration and fluorescence intensity at 614 nm
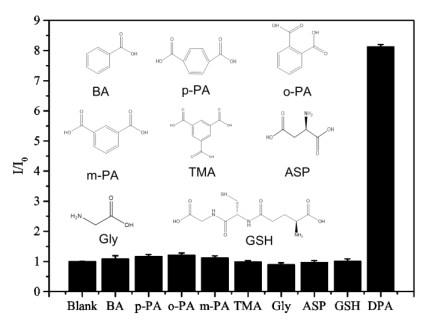
The specificity of the nanosheet probe for the detection of DPA was evaluated by testing its responses to several potential organic ligands and amino acids. The organic ligands were benzoic acid (BA), o-dibenzoic acid (o-PA), m-dibenzoic acid (m-PA), p-dibenzoic acid (p-PA), and trimesic acid (TMA), and the amino acids were glycine (Gly), D-aspartic acid (ASP), and glutathione peptide (GSH)[8, 20-22]. The responses of the nanosheet probe to the organic ligands and amino acids at concentrations of 100 μmol/L were very small (Fig. 4). Considering the strong response to DPA at 30 μmol/L, the nanosheet probe has a good specificity for DPA.
Figure 4
Figure 4.
Response of the nanosheet fluorescent probe to interfering organic molecules and amino acid (100 μmol/L) in comparison with its response to 30 μmol/L of dipicolinic acid (DPA)
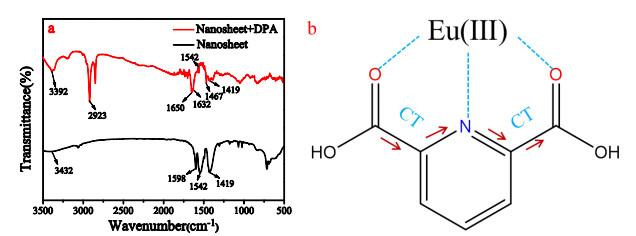
The detailed detection mechanism was investigated by evaluating the Fourier-transform infrared spectra (FT-IR) and fluorescence decay curves of the nanosheet sol before and after DPA addition. The FT-IR spectra (black line represents the nanosheet and red line shows the spectra after DPA addition) exhibit four characteristic peaks in the nanosheet spectra (Fig. 5a). The nanosheets contain water molecules, leading to a wide peak at 3432 cm–1. The characteristic peak at 1598 cm–1 is attributed to the stretching vibration of C–C in the benzene ring, and the peaks at 1542 and 1419 cm–1 are caused by the binding of benzoate ions with Eu(Ⅲ)[23]. DPA addition causes the peak at 3432 cm–1 (attributed to water) to disappear, and the intensity of the 1542 and 1419 cm–1 peaks is reduced. In addition, new peaks are observed. The peak at 3392 cm–1 is the -OH stretching vibration band of the hydroxide units in the nanosheet framework; the peak at 2923 cm–1 is attributed to the C–H bond on the DPA pyridine ring in DPA, and there are three more characteristic DPA peaks: one at 1650 cm–1 assigned to the C=O double bond in the carboxyl functional group of DPA and the other two at 1632 and 1467 cm–1 to the stretching vibration of C=N and C=C double bonds in the DPA pyridine ring, respectively. Compared to pure DPA, the characteristic peaks at 1650 and 1632 cm–1 exhibit a red shift[24], likely explained by the coordination principle. As shown in Fig. 5b, the nitrogen atom in the C=N double bond in the DPA pyridine ring and the oxygen atom of the C=O double bond in the carboxyl functional group coordinate with the rare earth ions embedded in the nanoshe. Owing to the CT transition (charge transfer state)[14], electrons that occupy the highest MO orbital are transferred from one carbonyl to another through the pyridine nucleus, two oxygen atoms and a nitrogen atom that coordinate with the Eu(Ⅲ) ion. As water molecules and benzoate ions are replaced by DPA combined with rare earth ions, the characteristic peaks attributed to water molecules and benzoate ions disappear or decrease in intensity.
Figure 5
Figure 5.
FT-IR spectra (a) of the nanosheets before and after the addition of dipicolinic acid (DPA); (b) Structure of coordination between DPA and Eu(Ⅲ) and intramolecular charge transfer
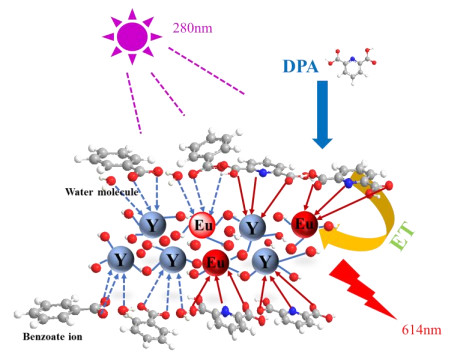
A simple mechanism diagram based on the FT-IR spectra was proposed. The overall mechanism of DPA detection based on nanosheet fluorescent probes was illustrated in Fig. 6. In the absence of DPA, the rare earth ions were coordinated with water molecules and benzoate ions. The non-radiative transition caused by the strong vibrational coupling of water molecules led to weak emission from the Eu(Ⅲ) ions. DPA gradually replaced the water molecules that have coordinated with the benzoate ions and rare earth ions. The lowest triplet energy level of DPA matched the energy of Eu(Ⅲ) emission state[25]. As a result of the antenna effect, energy was transferred from DPA to Eu(Ⅲ) to enhance the fluorescence intensity of Eu(Ⅲ). Because of the coordination substitution and the antenna effect, the nanosheet probes were suitable for detecting DPA. In comparison with other nanostructured probes (e.g. nanoparticles and nanowires), each luminescent left embedded on the nanosheet coordinated with DPA, allowing the nanosheets to be used as sensitive fluorescent probes for detecting biomarkers of Bacillus anthracis.
Figure 6
Figure 6.
Schematic diagram of the mechanism of the nanosheet fluorescent probe for DPA detection
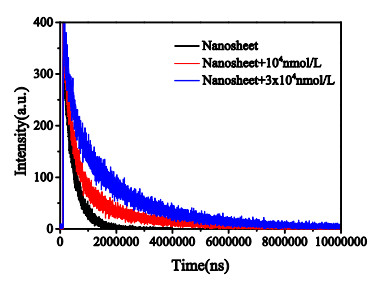
The sensing mechanism was further verified by evaluating the fluorescence decay curves of the probes. The fluorescence lifetime increased with increasing the DPA concentration (Fig. 7). In the absence of DPA, the Eu(Ⅲ) ions embedded in the nanosheets were coordinated with water molecules. The resulting fluorescence decay curve conformed to a single exponential fit with a short lifetime (τ1 = 371 μs). DPA addition led to double exponential fitting of the fluorescence decay curve. The parameters obtained using the double exponential function are listed in Table 1, which was calculated using Eq. 1:
Eu(Ⅲ) and DPA coordinated through both fast (τ1 = 358 and 400 μs) and slow processes (τ2 = 2090 and 2056 μs). The lifetime of the fast process was close to that of the pure nanosheets and attributed to the coordination of Eu(Ⅲ) with water molecules. Literature suggests that the fluorescence lifetime was prolonged as DPA reduced the quenching effect of water molecules by replacing water molecules with the nanosheets[7, 26, 27]. Increased DPA concentration in the system led to more replacement of water molecules to coordinate with Eu(Ⅲ), which resulted in the slow process. The ratio of A2/A1 increased, resulting in an increased average fluorescence lifetime.
4.
CONCLUSION
In summary, in this paper, Eu(Ⅲ)-doped ytterbium hydroxide nanosheets were obtained by mechanical exfoliation from layered rare-earth hydroxide (LRH) materials. Because of the unique single-layer two-dimensional structure of the nanosheets, DPA was able to displace water molecules, strongly coordinated with each of the Eu(Ⅲ) ions, and inserted into the stable nanosheets. Acting as an efficient antenna of the fluorescent left, DPA enhanced the fluorescence intensity of Eu(Ⅲ) at 614 nm. The fluorescent probe exhibited a wide detection range from 0 to 30 μmol/L DPA, a low detection limit of 0.078 μmol/L, and good specificity. Therefore, the nanosheet fluorescent probe has the potential to be a highly sensitive low-cost DPA detection tool.
[1]
Enserink, M. This time it was real: knowledge of anthrax put to the test. Scienc2001, 294, 490-491 doi: 10.1126/science.294.5542.490
[2]
Yilmaz, M. D.; Oktem, H. A. Eriochrome black T-Eu3+ complex as a ratiometric colorimetric and fluorescent probe for the detection of dipicolinic acid, a biomarker of bacterial spores. Anal. Chem.2018, 90, 4221-4225. doi: 10.1021/acs.analchem.8b00576
Kumar, G. A. Anthrax: a disease of biowarfare and public health importance. World J. Clin. Cases2015, 3, 20-33. doi: 10.12998/wjcc.v3.i1.20
[5]
Walt, D. R.; Franz, D. R. Biological warfare detection. Anal. Chem. 2000, 72, 738A-746A. doi: 10.1021/ac003002a
[6]
Wang, Q. X.; Xue, S. F.; Chen, Z. H.; Ma, S. H.; Zhang, S.; Shi, G.; Zhang, M. Dual lanthanide-doped complexes: the development of a time-resolved ratiometric fluorescent probe for anthrax biomarker and a paper-based visual sensor. Biosens. Bioelectron.2017, 94, 388-393. doi: 10.1016/j.bios.2017.03.027
[7]
Rong, M. C.; Liang, Y. C.; Zhao, D. L.; Chen, B. J.; Pan, C.; Deng, X. Z.; Chen, Y. B.; He, J. A ratiometric fluorescence visual test paper for an anthrax biomarker based on functionalized manganese-doped carbon dots. Sens. Actuators B2018, 265, 498-505. doi: 10.1016/j.snb.2018.03.094
[8]
Tan, H. L.; Ma, C. J.; Chen, L. L.; Xu, F. G.; Chen, S. H.; Wang, L. Nanoscaled lanthanide/nucleotide coordination polymer for detection of an anthrax biomarker. Sens. Actuators B2014, 190, 621-626. doi: 10.1016/j.snb.2013.09.024
[9]
Kong, L. B.; Setlow, P.; Li, Y. Q. Analysis of the Raman spectra of Ca(2+)-dipicolinic acid alone and in the bacterial spore core in both aqueous and dehydrated environments. Analyst. 2012, 137, 3683-3689. doi: 10.1039/c2an35468c
[10]
Klonkowski, A.; Lis, S.; Hnatejko, Z.; Czarnobaj, K.; Pietraszkiewicz, M.; Elbanowski, M. Improvement of emission intensity in luminescent materials based on the antenna effect. J. Alloy. Compd. 2000, 300, 55-60.
[11]
Lin, Z. Y.; Qu, Z. B.; Chen, Z. H.; Han, X. Y.; Deng, L. X.; Luo, Q. Y.; Jin, Z. W.; Shi, G. Y.; Zhang, M. The marriage of protein and lanthanide: unveiling a time-resolved fluorescence sensor array regulated by pH toward high throughput assay of metal ions in biofluids. Anal. Chem. 2019, 91, 11170-11177. doi: 10.1021/acs.analchem.9b01879
[12]
Rong, M. C.; Deng, X. Z.; Chi, S.; Huang, L. Z.; Zhou, Y. B.; Shen, Y. N.; Chen, X. Ratiometric fluorometric determination of the anthrax biomarker 2, 6-dipicolinic acid by using europium(Ⅲ)-doped carbon dots in a test stripe. Microchim Acta2018, 185, 2-10. doi: 10.1007/s00604-017-2585-5
[13]
Zhang, L.; Jiang, D. Y.; Xia, J. F.; Zhang, N.; Li, Q. Fluorescence enhancement of europium-doped yttrium hydroxide nanosheets modified by 2-thenoyltrifluoroacetone. RSC Adv. 2014, 34, 17856-17857.
[14]
Viveros-Andrade, A. G.; Colorado-Peralta, R.; Flores-Alamo, M.; Castillo-Blum, S. E.; Duran-Hernandez, J.; Rivera, J. M. Solvothermal synthesis and spectroscopic characterization of three lanthanide complexes with high luminescent properties [H2NMe2]3[Ln(Ⅲ)(2, 6-pyridinedicarboxylate)3] (Ln = Sm, Eu, Tb): in the presence of 4, 4-bipyridyl. J. Mol. Struct.2017, 1145, 10-17. doi: 10.1016/j.molstruc.2017.05.055
[15]
Ming, C. L.; Du, X.; Qin, L.; Cui, G. H. Crystal Structural and fluoresence properties of a two-dimensional cobaltous coordination polymer containing bis(benzimidazole) ligand. J. Struct. Chem.2014, 55, 927-931. doi: 10.1134/S0022476614050205
[16]
Yu, Y. Y.; Zhang, H. Q. Reduced graphene oxide coupled magnetic CuFe2O4-TiO2 nanoparticles with enhanced photocatalytic activity for methylene blue degradation. Chin. J. Struct. Chem.2016, 35, 472-480.
[17]
Yilmaz, M. D.; Hsu, S. H.; Reinhoudt, D. N.; Velders, A.; Huskens, H. J. Ratiometric fluorescent detection of an anthrax biomarker at molecular printboards. Angew. Chem. Int. Ed. 2010, 49, 5938-4941. doi: 10.1002/anie.201000540
[18]
Rosen, D. L.; Sharpless, C.; McGown, L. B. Bacterial spore detection and determination by use of terbium dipicolinate photoluminescence. Anal. Chem.1997, 69, 1082-1085. doi: 10.1021/ac960939w
[19]
Pellegrino, P. M.; Fell, N. F.; Rosen, D. L.; Gillespie, J. B. Bacterial endospore detection using terbium dipicolinate photoluminescence in the presence of chemical and biological materials. Anal. Chem. 1998, 70, 1755-1760. doi: 10.1021/ac971232s
[20]
Xu, J.; Shen, X. K.; Jia, L.; Zhang, M. M.; Zhou, T.; Wei, Y. K. Facile ratiometric fluorapatite nanoprobes for rapid and sensitive bacterial spore biomarker detection. Biosens. Bioelectron.2017, 87, 991-997. doi: 10.1016/j.bios.2016.09.070
[21]
Ke, L.; Meng, R.; Shan, C.; Jing, C.; Jia, J.; Liu, W. S.; Tang, Y. A novel terbium functionalized micelle nanoprobe for ratiometric fluorescence detection of anthrax spore biomarker. Anal. Chem.2018, 90, 3600-3607. doi: 10.1021/acs.analchem.8b00050
[22]
Ammann, A. B.; Kolle, L.; Brandl, H. Detection of bacterial endospores in soil by terbium fluorescence. Int. J. Microbiol. 2011, 2011, 1-5.
[23]
Yang, W.; Li, Q.; Zheng, X. H.; Li, X.; Li, X. Luminescent sensing film based on sulfosalicylic acid modified Tb(Ⅲ)-doped yttrium hydroxide nanosheets. J. Adv. Ceram. 2018, 7, 352-361. doi: 10.1007/s40145-018-0285-1
[24]
Siddiqi, Z. A.; Khalid, M. Antimicrobial and SOD activities of novel transition metal complexes of pyridine-2, 6-dicarboxylic acid containing 4-picoline as auxiliary ligand. Eur. J. med. chem. 2010, 45, 264-269. doi: 10.1016/j.ejmech.2009.10.005
[25]
Chen, H.; Xie, Y. J.; Kirillov, A. M.; Liang, L. L.; Yu, M. H.; Liu, W. S.; Tang, Y. A ratiometric fluorescent nanoprobe based on terbium functionalized carbon dots for highly sensitive detection of an anthrax biomarker. Chem. Commun. 2015, 51, 5036-5039. doi: 10.1039/C5CC00757G
[26]
Zhang, Y. H.; Li, B.; Ma, H. P.; Zhang, L. M.; Zheng, Y. X. Rapid and facile ratiometric detection of an anthrax biomarker by regulating energy transfer process in bio-metal-organic framework. Biosens. Bioelectron.2016, 85, 287-293. doi: 10.1016/j.bios.2016.05.020
[27]
Ma, K.; Wang, H.; Li, X.; Xu, B.; Tian, W. J. Turn-on sensing for Ag+ based on aie-active fluorescent probe and cytosine-rich DNA. Anal. Bioanal. Chem. 2015, 407, 2625-2630. doi: 10.1007/s00216-015-8467-y
Figure 1
Layered structure of compounds Y1.94Eu0.06(OH)5[C6H5COO]·2H2O obtained by (a) Power X-ray diffraction (XRD); images of the nanosheets acquired using (b) Transmission electron microscopy (TEM); (c) Atomic force microscopy (AFM) and (d) Nanosheet thickness
Figure 2
(a) UV absorption spectra before and after the addition of DPA to nanosheets. (b) Excitation spectra after adding DPA to nanosheets. (c) Emission spectra before and after the addition of DPA to nanosheets
Figure 4
Response of the nanosheet fluorescent probe to interfering organic molecules and amino acid (100 μmol/L) in comparison with its response to 30 μmol/L of dipicolinic acid (DPA)
Figure 5
FT-IR spectra (a) of the nanosheets before and after the addition of dipicolinic acid (DPA); (b) Structure of coordination between DPA and Eu(Ⅲ) and intramolecular charge transfer

 DownLoad:

 下载:
下载:


 下载:
下载:
