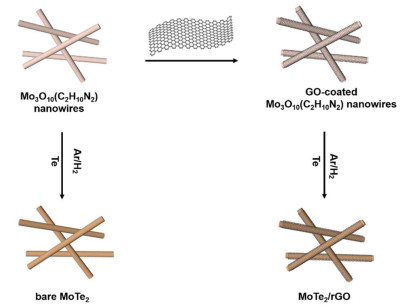
Figure 1.
Schematic illustration for the fabrication of bare MoTe2 nanorods and MoTe2/rGO nanocomposite.

Lithium-ion batteries (LIBs) with high energy density, long lifespan and environmental benign have attracted intensive interest as the major energy storage device.[1, 2] It has been demonstrated that nanostructure electrodes with optimized structure and morpho-logy can achieve high energy and charge density in LIBs compared to bulk materials.[3] One-dimensional (1D) nanomaterials of silicon/carbon and transition metal oxides such as Co3O4, Fe2O3 and MnO2 are often used as anodes for LIBs. For example, Si has low discharge voltage and high theoretical capacity (4200 mA h g-1), which is 10 times higher than that of commercial graphite anodes.[4] Low cost transition metal oxides also have a high capacity because of their capability of storing lithium by the conversion mechanism.[5] Although the design of 1D nanostructures can offer rapid electron transport path in the axial direction and shortened diffusion path for Li+, [6, 7] large volume change during charging and discharging remains a challenge, which leads to pulverization and capacity fading. The introduction of buffer layer, e.g., graphene with good conductivity and flexibility[8, 9] on the surfaces of these electrode nanomaterials[10-18] has been used to mitigate the pro-blems.
In comparison with the above mentioned materials, as a typical TMDs compound, MoTe2 has a sandwich-like layered structure with an interlayer spacing of 0.699 nm, which is larger than that of graphite (0.335 nm), facilitating the process of reversible Li+ insertion/extraction.[19] Hence, the nature of MoTe2 makes it very suitable as active material for LIBs. Currently, the most common forms of MoTe2 are nanosheets, thin films[20, 21] and bulk blocks[22, 23] because the native 2D layered structure increases the difficulty to produce 1D nanostructured MoTe2.[24] Most 1D MoTe2 are synthesized by chemical vapor deposition (CVD), [25] electron irradiation[26] and sonochemical technique.[27] In these methods, the expensive equipment is required and the complex experimental process is involved. The development of a simple way to synthesize 1D MoTe2 is highly desirable.
Here, an in-situ reaction of GO encapsulated Mo3O10(C2H10N2) nanowires with Te under Ar/H2 atmosphere at 500 oC has been developed for the production of MoTe2 nanorods coated with rGO thin layers containing certain Te vacancies. The 1D MoTe2 nanorods have an average diameter of 100-200 nm and length of 1-3 μm, respectively. When used as anode material, the hybridized MoTe2/rGO nanorods promote conductivity and cycling stability. As a result, the MoTe2/rGO nanocomposite delivers a high capacity of 637 mA h g-1 at 0.2 A g-1 and long-term lifespan (374 mA h g-1 after 200 cycles at 0.5 A g-1), which is much larger than that of bare MoTe2 nanorods. This work provides a new pathway for the rational design of advanced 1D TMDs electrode materials with enhanced performance.
Figure 1 illustrates the schematic preparation of MoTe2/rGO nanocomposites and bare MoTe2 nanorods. Typically, the Mo3O10(C2H10N2) nanowires (Figure S1b)[28] were first mixed with aqueous dispersion of different percentages of GO (the GO contents are 5, 10 and 15 mg, respectively) to obtain GO-coated Mo3O10(C2H10N2)/GO. Then, MoTe2/rGO-x nanocomposites (x represents the mass of graphene introduced to the precursor) were synthesized by reacting Mo3O10(C2H10N2)/GO with Te powder at a mass ratio of 1:1. In this process, the Mo3O10(C2H10N2)GO nanowires was as 1D template and molybdenum source. Meanwhile, bare MoTe2 nanorods were also prepared with a similar method without graphene oxide.
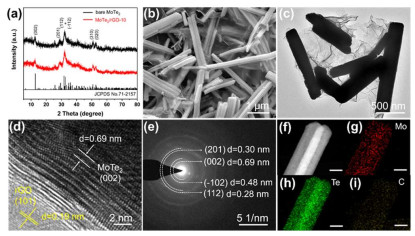
Crystal Phase and Structure Characterization of MoTe2. Figure 2a shows XRD patterns of bare MoTe2 nanorods and MoTe2/rGO-10 nanocomposite. All the diffraction peaks can be indexed to the monoclinic phase MoTe2 (JCPDS No. 71-2157) for both bare MoTe2 nanorods and MoTe2/rGO-10 nanocomposite. The results indicate that Mo3O10(C2H10N2) has been completely converted to MoTe2. Furthermore, the position and intensity of the signals are generally similar for bare MoTe2 nanorods and MoTe2/rGO-10 nanocomposite, indicating that their crystallinity, size and interlayer spacing maintain consistency. The primary diffraction peak located at 2θ = 12.8° belongs to the (002) crystal plane, which possesses an interlayer spacing of about 0.69 nm.
For comparison, the MoTe2/rGO nanocomposites with various rGO ratios were also synthesized (Figure S2). As the amount of GO increases, the MoTe2 nanorods are gradually coated by rGO nanosheets. SEM image of MoTe2/rGO-5 nanocomposite shows obvious incomplete encapsulation of rGO on the surface of nanorods (Figure S3a). In contrast, the surface of MoTe2/rGO-15 nanocomposite (Figure S3b) is stacked with thick rGO nanosheets.
As shown in Figure S4, the morphology of bare MoTe2 nanorods well inherited the Mo3O10(C2H10N2) precursor after tellurization. The nanorods are packed in bundles and have a rough surface. Figure 2b shows the SEM image of MoTe2/rGO-10 nanocomposite. It can be clearly seen that the product has a uniform distribution and well-defined 1D rod-like morphology. The nanorods have a diameter around 100-200 nm and a length of 1-3 μm. The morphology and structure of the MoTe2/rGO-10 nanocomposite are further characterized by TEM and HRTEM. Figure 2c shows that several nanorods are randomly arranged and coated with a thin layer of rGO. The rGO nanosheets are well cross-linked with MoTe2 nanorods, forming an interconnected structure. The HRTEM image (Figure 2d) indicates interplanar spacing is 0.69 and 0.18 nm, corresponding to the (002) plane of MoTe2 and the (101) plane of rGO, respectively. The SAED pattern (Figure 2e) reveals the polycrystalline structure of MoTe2/rGO-10 nanocomposite. The elemental distribution of MoTe2/rGO-10 nanocomposite is further investigated by EDS. Figure 2f-i shows elemental mapping around the nanorods, and the homogenous distribution of elements Mo, Te and C, confirming that MoTe2 nanorod is uniformly coated by rGO.
The specific surface area and porosity of the materials were confirmed by BET. As shown in Figure S5, both bare MoTe2 and MoTe2/rGO-10 nanocomposite display Type IV isotherms of nitrogen adsorption-desorption profile, indicating their mesporous structure. The specific surface area of MoTe2/rGO-10 nanocomposite is determined to be 15.4153 m2 g-1, which is slightly larger than that of bare MoTe2 (9.7428 m2 g-1). The inset of Figure S5 shows their pore-size distributions from BJH (Barrett-JoynerHalenda), showing the pore diameters are in a range of 2-20 nm. Therefore, the MoTe2/rGO-10 nanocomposite possesses rich interfacial sites for lithium storage. Meanwhile, TGA of the four samples was carried out in order to calculate the weight content of MoTe2. According to the TG curves (Figure S6), the weight increases on the four samples in the temperature range of 300-450 ℃ can be attributed to the oxidation of MoTe2 into TeMoOx in air. Subsequently, the weight loss is related to the oxidation of rGO accompanied by the sublimation of partial MoTeOx. Finally, the weight losses over bare MoTe2, MoTe2/rGO-5, MoTe2/rGO-10 and MoTe2/rGO-15 are 29.48%, 34.55%, 36.63% and 39.53%, respectively. The weight percentages of MoTe2 in the MoTe2/rGO-5, MoTe2/rGO-10 and MoTe2/rGO-15 nanocomposites are determined to be 92.8%, 89.8% and 85.7%, respectively.
EPR spectroscopy (Figure S7) was used to characterize the internal microstructure of MoTe2. The characteristic peak at g = 2.00248 indicates the existence of Te vacancies. This may be caused by the easy sublimation of Te under high temperature, and presence of Te vacancy facilitates the formation of distorted 1T phase.[29] The existence of vacancies may provide more paths to promote the transport of ions.[30]
Figure S8a illustrates the XRD patterns of bulk MoTe2, which matches well with the monoclinic phase MoTe2 (JCPDS No. 71-2157). Compared to bare MoTe2 nanorods, the diffraction peaks of bulk MoTe2 are very sharp, indicating that bulk MoTe2 has a good crystallinity and large particle size. SEM image (Figure S8b) shows that the block structure of MoTe2 in nature has irregular shapes and large size of several micrometers.
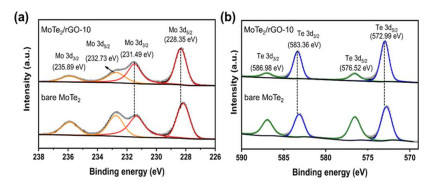
XPS was utilized to analyze the surface chemical states of MoTe2/rGO-10 nanocomposite. As shown in Figure S9a, the survey spectrum affirms the presence of Mo, Te, C and O elements in the hybrid. The Mo 3d spectrum displays prominent peaks at 228.35 and 231.49 eV, corresponding to 3d5/2 and 3d3/2 of Mo-Te bonds, [31, 32] respectively (Figure 3a). The peaks at 232.73 and 235.89 eV are related to Mo-O bonding. In the Te 3d core level spectrum, the peaks positioned at 572.99 and 583.36 eV are displayed for 3d5/2 and 3d3/2, respectively, implying the existence of Mo-Te bonds (Figure 3c). In addition, the Te 3d5/2 and 3d3/2 peaks located at 576.52 and 586.98 eV are attributable to Te-O bonding. In reality, the Mo-O and Te-O bonding are mainly caused by the inevitable oxidation of MoTe2/rGO-10 nanocomposite in air.[31] In comparison with XPS of bare MoTe2 nanorods, the peak of Mo-Te shifts towards the higher binding energy, indicating that electrons are transferred from MoTe2 to rGO.[33] It is possible that Mo and Te atoms may form Mo-O and Te-O bonds with rGO, respectively, which benefits the anchor of rGO to MoTe2. The C 1S spectrum in Figure S9b demonstrates three peaks at the binding energies of 284.79, 285.89 and 288.52 eV, which are ascribed to C-C, C-OH and C=O, respectively.[34]
Electrochemical Measurements of Half-Cell. The electroche-mical performances of diverse electrodes were evaluated as the anodes versus Li foil in the half-cells. As demonstrated in Figure 4a, typical CV curves during the initial six cycles are recorded in the voltage window of 0.01-3.0 V at a scan rate of 0.2 mV s-1. During the first cycle of discharge progress, the MoTe2/rGO-10 nanocomposite demonstrates four main reduction peaks. In detail, the reduction peaks located at 1.23 and 0.92 V are associated with the intercalation reaction, corresponding to the inserting of Li+ into MoTe2 lattice to form LixMoTe2 (MoTe2 + xLi+ + xe− ↔ LixMoTe2) and the sharp peak observed at 0.69 V is mainly associated with the conversion reaction, leading to the formation of metallic Mo and Li2Te (LixMoTe2 + (4-x)Li+ + (4−x)e- ⇔ Mo + 2Li2Te).[35, 36] The broad peak around 0.25 V is due to the decomposition of electrolyte and the formation of a solid electrolyte interface (SEI) film.[35-37] During the following cycles, the four reduction peaks corresponding to the first cycle are all fading away and a distinct peak appears around 1.3 V, which is caused by the decrease in electron polarization with the size reduction of MoTe2 nanorods.[35] In the six cycles of charging, the prominent single anodic peaks are ascribed to the reformulation of MoTe2 through the oxidation reaction of Mo and Li2Te. Figure 4b presents the galvanostatic discharge/charge profiles of MoTe2/rGO-10 nanocomposite at the current density of 0.05 A g−1 (initial three circles) and 0.2 A g−1. All the voltage platforms match well with the distinct peaks in CV curves. In the first cycle, the discharge and charge capacities of MoTe2/rGO-10 nanocomposite are 651.41 and 519.16 mA h g-1 at 0.05 A g-1, respectively, corresponding to an initial Coulombic efficiency of 79.7%. The loss of capacity is mainly from the formation of SEI film and electrolyte decomposition.[38]
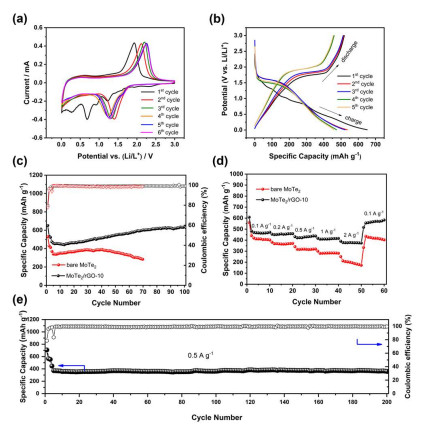
Figure 4c demonstrates the cycling performances of MoTe2/rGO-10 nanocomposite and bare MoTe2 nanorods at a current density of 0.2 A g-1 in a voltage range of 0.01-3.0 V. After the initial three cycles of activation at a current density of 0.05 A g-1, the MoTe2/rGO-10 nanocomposite exhibits the high reversible capacity of 637 mA h g-1 over 100 cycles with capacity retention of 97%. While the bare MoTe2 nanorods only exhibit a discharge capacity of 389 mA h g-1 in the initial 40 cycles, and the capacity shows a trend of decay in the following cycles. In addition, bare rGO coating can only maintain 227 mA h g-1 after 50 cycles at 0.2 A g-1, which is lower than the reversible capacity of MoTe2 and MoTe2/rGO-10 (Figure S10). Therefore, the synergistic effects of rGO coating and MoTe2 nanorods contribute to the enhancement of the electrochemical performance of MoTe2/rGO-10. This is benefiting from the flexible nature of rGO, which cushions the vo-lume change during the insertion and extraction of Li+, resulting in less structural damage. While the good electrical conductivity of rGO facilitates the transfer of electrons, contributing to a significant increase in capacity. In addition, Te vacancies in MoTe2/rGO-10 nanocomposite can provide rich active sites, which may also contribute to the improvement of electrochemical performance. Therefore, the MoTe2/rGO-10 nanocomposite exhibits superior electrochemical performance. For the bulk solid MoTe2, as shown in Figure S11a, it only retains 248 mA h g-1 after 30 cycles, which is even much lower than that of bare MoTe2 nanorods (389 mA h g-1). Meanwhile, bare MoTe2 nanorods have higher rate capability (Figure S11b). Therefore, the 1D nanostructures can significantly improve the electrochemical performance compared with blocky structures. Figure S12 shows the SEM images of the collected MoTe2/rGO-10 nanocomposite and bulk MoTe2 after 100 cycles at 0.2 A g-1. The 1D structure of MoTe2/rGO-10 nanocomposite is well preserved, indicating that rGO layers effectively alleviate the volume change of nanorods and maintain the stability of the structure. However, the bulk MoTe2 loses its original block structure and pulverizes seriously. Thus MoTe2/rGO-10 nanocomposite delivers an enhanced cycle performance.
Figure 4d gives the rate performances of the MoTe2/rGO-10 nanocomposite and bare MoTe2 nanorods. It is showing that the current density is increased step-wisely from 0.1 to 2 A g-1. The MoTe2/rGO-10 electrode shows the high specific capacities of 472, 459, 438, 416, 374 mA h g-1 at 0.1, 0.2, 0.5, 1, 2 A g-1, respectively. When the current density is returned back to 0.1A g-1, the reversible capacity recovers to 583 mA h g-1, showing a good rate retention and excellent stability. Furthermore, the long-term cycling performance of the MoTe2/rGO-10 nanocomposite is tested at a current density of 0.5 A g-1 (Figure 4e). It delivers a discharge capacity of 446 mA h g-1 after activation with initial three cycles at 0.05 A g-1 and maintains 360 mA h g-1 over 200 cycles. The capacity retention is 80.7%, indicating excellent capacity retention and good stability. As can be seen from Table S1, the present MoTe2/rGO-10 nanocomposite exhibits high capacity and good stability at high current densities in comparison with the related MoTe2 and typical Mo-based anodes in the literatures.
Here, we also investigate the effect of GO quantity on the performance. In Figure S13, MoTe2/rGO-15 nanocomposite shows a lower discharge specific capacity of 523 mA h g-1 after 100 cycles than MoTe2/rGO-10 sample. If the graphene was decreased to 5 mg, although MoTe2/rGO-5 nanocomposite exhibits higher capacity and cycling performance than bare MoTe2 nanorods, the structural stability is still not good. In reality, the small amount of rGO in the MoTe2/rGO-5 nanocomposite is not sufficient to completely cover the surface of the nanorods, leading to the decreased conductivity and buffer capacity. With the increase of graphene, MoTe2/rGO-15 nanocomposite shows good structural stability, but the capacity is lower than that of MoTe2/rGO-10 nanocomposite. Excessive rGO nanosheets aggregate to form thick folds, which will hinder electron transport and cause poor conductivity, resulting in lower capacity. Therefore, the appropriate amount of rGO in the nanocomposite is the key to improve electro-chemical performance.
Galvanostatic intermittent titration technique (GITT) and EIS were carried out to understand the Li+ diffusion kinetics and intrinsic electrochemical mechanisms of bare MoTe2 and MoTe2/rG0-10 nanocomposite anodes. The testing details are given in Figure S14. Figures S15a and S15b show the GITT curves of MoTe2/rGO-10 in the first discharge/charge process. The potentials at around 1.5 V during the first discharge and at around 2.0 V during the first charge are related to the processes of Li+ insertion and extraction, respectively. The corresponding lithium diffusion coefficients at various discharge/charge voltages are calculated (Figures S15c, S15d). It can be seen that the minimum values of the diffusion coefficient appear at 1.2-1.6 V during the discharging progress or around 2.0-2.2 V during the charging progress, which are related to deep diffusion of Li+ into/from the active materials. Notably, the MoTe2/rGO-10 nanocomposite shows a higher diffusion coefficient, which further demonstrates the pre-ferable rate capability and cycling performance. Figure S16 is the Nyquist plots of different electrodes after 100 cycles at 0.2 A g-1. The EIS curves mainly consist of a semicircle in high frequency region and an oblique line at low frequency. The equivalent circuit diagram shows that Rs is the electrolyte resistance, Rct represents the charge transfer resistance and Zw stands for the Warburg impedance associated with the diffusion of Li+. According to the fitting results, the charge-transfer resistance (Rct) of the MoTe2/rGO-10 nanocomposite is 67 Ω, which is less than that of bare MoTe2 nanorods (89 Ω) and bulk MoTe2 (125 Ω). Thus, the MoTe2/rGO-10 nanocomposite is more favorable for charge transfer.
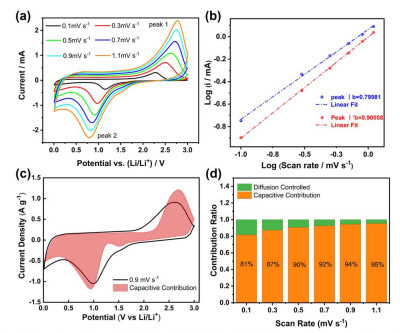
In order to gain insights into the relationship between the superior rate performance and pseudocapacitor contribution of the MoTe2/rGO-10 composite electrode, the CV curves at various scan rates have been done (Figure 5a). The relationship between current and scan rates can be expressed by the following equation: [39, 40]
|
|
(1) |
|
|
(2) |
where i is the peak current, v stands for the scan rate, and a and b are adjustable parameters. The charge storage mechanism is closely related to the b value. Typically, the b value of ~0.5 indicates a diffusion-controlled process, whereas the b value of ~1 implies a capacitive-controlled process. As shown in Figure 5b, the b values corresponding to the anodic and cathodic are 0.8575 and 0.7745, respectively. Thus, the capacitive kinetics is dominant in the MoTe2/rGO-10 nanocomposite, resulting in a fast Li+ insertion/extraction progress. Dunn equation is also used to investigate capacitive contribution under certain scan rate:
|
|
(3) |
where i (V) is related to the total current contributions that can be considered as combination of two separate mechanisms, namely capacitive contribution by the surface (k1v) and diffusion-controlled insertion (k2v1/2). Figure 5c illustrates the separation of pseudocapacitive-controlled current (highlighted red area) from the entire CV curve at 0.9 mV s-1. The calculated red region of 94% represents the contribution of the pseudocapacitive behavior, which determines a rapid lithium-storage behavior at high current density. Meanwhile, a capacitive contribution of 81%, 87%, 90%, 92%, 94% and 95% at the scan rates of 0.1, 0.3, 0.5, 0.7, 0.9, and 1.1 mV s-1 can be achieved (Figure 5d). It appears that the charge storage process is pseudocapacitance-dominated in the MoTe2/rGO-10 nanocomposite.
The excellent electrochemical performance of MoTe2/rGO-10 nanocomposite anode is mainly attributed to its microscopic structural characteristics. First, 1D nanostructure can not only shorten the diffusion path of Li+, but also provide directional paths for fast electron transport. Second, the Te vacancies provide more facile ion diffusion path, which can cause faster mobility for Li+ insertion/extraction. Third, the rGO thin layers significantly improve the electrical conductivity of the MoTe2/rGO-10 nanocomposite, which leads to higher capacity and better rate capability. Fourth, the flexible rGO layers can suppress the volume change of MoTe2 nanorods and enhance the stability of the structure. As a synergistic result, MoTe2/rGO-10 nanocomposite anode exhibits excellent electrochemical performance.
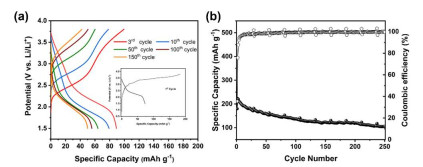
MoTe2/rGO Versus LCO Full-Cell. A full-cell LIB was assembled by coupling MoTe2/rGO-10 anode and the commercial LiCoO2 cathode (LCO). According to the practical capacity, the weight ratio of MoTe2/rGO-10 and LCO is 1:3. The specific capacities are evaluated based on the mass loading of MoTe2/rGO nanocomposite anode. Figure S17 shows the CV curve of full cell at a scan rate 0.1 mV s-1. The CV curve shows a distinct reduction peak at ~1.8 V, which corresponds to the nominal voltage of the full cell. Figure 6a shows the charge/discharge performance curves of MoTe2/rGO-10//LCO full cell. The charge/discharge capacities in the 1st cycle are 508 and 180 mA h g-1, respectively, giving a low coulombic efficiency of 35%, which is mainly due to the polarization and irreversible capacity loss at the MoTe2/rGO-10 anode. It is increased to 87% for the 3rd cycle and the charge/discharge capacities are 250 and 219 mA h g-1, respectively. The MoTe2/rGO-10//LCO full cell exhibits the reversible capacity of 105 mA h g-1 over 250 cycles and shows good cycling stability (Figure 6b).
In summary, 1D MoTe2/rGO nanocomposite anode has been successfully fabricated by a facile in-situ tellurization of GO encapsulated Mo3O10(C2H10N2) nanowires process. It achieves a high reversible capacity of 637 mA h g-1 at 0.2 A g-1 and superior rate capability (374 mA h g-1 at 2 A g-1), exhibiting significantly improved performance compared to bare MoTe2 and bulk MoTe2 electrode. More importantly, the nanocomposite also shows good long cycling stability, revealing a capability decay of 0.09% per cycle for 200 cycles at 0.5 A g-1. Moreover, the assembled MoTe2/rGO-10//LCO full cell has good cycling stability with a capacity of 105 mA h g-1 after 250 cycles at 0.1 C. The excellent electrochemical performance can be attributed to the synergistic effects of 1D nanostructure, rGO thin layers and the presence of Te vacancies. This work can be extended to the synthesis of other 1D TMDs on a large-scale production for energy storage devices.
Synthesis of Organic-Inorganic Mo3O10(C2H10N2) Nanowires. The organic-inorganic hybridized Mo3O10(C2H10N2) nanowire was synthesized according to the literature.[41] In a typical procedure, 1.24 g of (NH4)6Mo7O24·4H2O and 1 mL of ethylenediamine were dissolved in 15 mL of distilled water, and then 1 M HCl aqueous solution was dropped to the mixture with magnetic stirring at room temperature until a white precipitate was formed. After incubation at 50 ℃ for 5 h, the product was washed with deionized water and ethanol several times. The collected sample by centrifugation was dried at 60 ℃ overnight.
Synthesis of Graphene Oxide Coated Mo3O10(C2H10N2) Nano-wires (Mo3O10(C2H10N2)/GO). Mo3O10(C2H10N2)/GO was synthesized via the following procedure. 0.1 g Mo3O10 (C2H10N2) nano-wires were dispersed into 40 mL H2O, then mixed with 20 mL, 40 mL and 60 mL of GO dispersion solution (0.25 mg mL-1). The obtained mixture was stirred for 24 h, resulting in the formation of Mo3O10(C2H10N2)/GO with different GO contents. The obtained suspension was freeze-dried for 12 h.
Synthesis of MoTe2/rGO-x Nanorods. The reaction of the as-obtained Mo3O10(C2H10N2)/GO (50 mg) and Te powder (50 mg) were performed in a tubular furnace with a temperature controller. The equipment was heated to 500 ℃ at a rate of 2 ℃ min-1 and maintained at that temperature for 5 h under flowing Ar/H2. Meanwhile, GO was thermally reduced to rGO. The mass of coating GO was 5, 10 and 15 mg, respectively, and the resulting products were designated as MoTe2/rGO-5, MoTe2/rGO-10 and MoTe2/rGO-15. For comparison, bare MoTe2 nanorods without GO was also synthesized with a similar method.
Synthesis of Bulk MoTe2. Bulk Mo3O10(C2H10N2) was firstly produced similar to the condition of Mo3O10(C2H10N2) nanowires except that the reaction time was decreased to 1 h. Then the reaction of bulk Mo3O10(C2H10N2) with Te resulted in the formation of bulk MoTe2.
Materials Characterization. The crystal structure was studied by X-ray diffraction (XRD) on a Rigaku Corporation UItimaIV diffractometer with Cu Kα radiation (λ = 0.15418 nm). The chemical composition and valence state of the samples were analyzed by X-ray photoelectronic spectroscopy (XPS) on an ESCALAB 250Xi system. The microstructure and morphology of the samples were characterized by scanning electronic microscope (SEM; ZEISS MERLIN Compact, Germany) and high-resolution transmission electron microscopy (HRTEM) with FEG (Talos F200 X) instruments equipped with energy dispersive X-ray spectroscopy (EDS, Oxford SDD X-Max). Electronic paramagnetic resonance spectrometer (EPR, EMXplus-6/1, Bruker, Germany) was used to characterize the existence of defects. BET was used for the surface area determination using MicroActive for TriStar II Plus 2.02. TGA was used to determine the content of MoTe2 under N2 atmosphere by NETZSCH TG 209F3.
Electrochemical Test of Half Cells. The working electrode was prepared by mixing the active materials (bare MoTe2 nanorods or MoTe2/rGO nanocomposite), carbon black and polyvinylidene fluoride (PVDF) in N-methyl-2-pyrrolidone (NMP) at a mass ratio of 8:1:1, respectively. Then slurry was cast onto a piece of clean copper foil and dried under vacuum at 80 ℃ for 12 h. The copper foil was then cut into discs with the diameter of 12 mm. The loading of active materials in the electrode was ≈1-1.3 mg cm-2. The CR2032 coin-type cells were assembled in an argon-filled glove box with lithium foil as counter and reference electrode (Mikrouna, H2O ≤ 0.1 ppm, O2 ≤ 0.1 ppm). Celgard 2400 was used as the separator, 1.0 M LiPF6 in ethylene carbonate: dimethyl carbonate: ethyl methyl carbonate = 1:1:1 vol% with 1.0% vinylene carbonate was used as the electrolyte. The charge/discharge tests were performed on Lan He battery testing system (Wuhan LAND Electronics Co., China) in the potential range of 0.01-3.0 V versus Li+/Li. Cyclic voltammetry (CV) measurement was carried out on a CHI 760E electrochemical workstation between 0.01 and 3 V with different scanning rates. The electrochemical impedance spectro-scopy (EIS) was carried out with the same electrochemical workstation over a frequency range of 100 kHz to 0.01 Hz with an amplitude of 5 mV.
Fabrication and Electrochemical Measurements of Full Cells.
The cathode was obtained by mixing the LCO, carbon black and PVDF in NMP with weight ratio of 8:1:1. Then the slurry was coated on aluminum foil and dried overnight at 80 ℃. The loading of LCO in the electrode was ≈3-3.2 mg cm-2. The CR2032 coin-type cells were assembled in an argon-filled glove box (Mikrouna, H2O ≤ 0.1 ppm, O2 ≤ 0.1 ppm). Celgard 2400 was used as the separator, and the mixture of 1.0 M LiPF6 in ethylene carbonate: dimethyl carbonate: ethyl methyl carbonate = 1:1:1 vol% with 1.0% vinylene carbonate was used as the electrolyte. Galvanostatic measurements were made in the voltage range from 1.5 to 3.8 V at 0.1 C. The specific capacities were evaluated based on the mass loading of MoTe2/rGO nanocomposite.
Wu, M. M.; Zhao, Y.; Zhang, H. T.; Zhu, J.; Ma, Y. F.; Li, C. X.; Zhang, Y. M.; Chen, Y. S. A 2D covalent organic framework with ultra-large interlayer distance as high-rate anode material for lithium-ion batteries. Nano Res. 2021, 1-6.
Wang, C. Y.; Yao, Q. Q.; Gan, Y. M.; Zhang, Q. X.; Guan, L. H.; Zhao, Y. Monodispersed SWNTs assembled coating layer as an alternative to graphene with enhanced alkali-ion storage performance. Chin. J. Struct. Chem. 2022, 41, 2201040-2201046.
Liu, J.; Cao, G. Z.; Yang, Z. G.; Wang, D. H.; Dubois, D.; Zhou, X. D.; Graff, G. L.; Zhang, J. G. Oriented nanostructures for energy conversion and storage. ChemSusChem. 2008, 1, 676-697.
Xu, K. Q.; Ben, L. B.; Li, H.; Huang, X. J. Silicon-based nanosheets synthesized by a topochemicalreaction for use as anodes for lithium ion batteries. Nano Res. 2015, 8, 2654-2662.
Poizot, P.; Laruelle, S.; Grugeon, S.; Dupont, L.; Tarascon, J. M. Nano-sized transition-metal oxides as negative-electrode materials for lithium-ion batteries. Nature 2000, 407, 496-499.
Li, X.; Wang, J. One-dimensional and two-dimensional synergized nanostructures for high-performing energy storage and conversion. InfoMat. 2020, 2, 3-32. doi: 10.1002/inf2.12040
Hu, X. L.; Zhang, W.; Liu, X. X.; Mei, Y. N.; Huang, Y. Nanostructured Mo-based electrode materials for electrochemical energy storage. Chem. Soc. Rev. 2015, 44, 2376-2404. doi: 10.1039/C4CS00350K
Yu, Y. Y.; Zhang, H. Q. Reduced graphene oxide coupled magnetic CuFe2O4-TiO2 nanoparticles with enhanced photocatalytic activity for methylene blue degradation. Chin. J. Struct. Chem. 2016, 35, 472-480.
Li, Y. J.; Zhou, J. H.; Guo, S. J. Advanced carbon materials for non-aqueous potassium ion battery anodes. Chin. J. Struct. Chem. 2019, 12, 1993-1998.
Ren, J. G.; Wang, C. D.; Wu, Q. H.; Liu, X.; Yang, Y.; He, L. F.; Zhang, W. J. A silicon nanowire-reduced graphene oxide nanocomposite as a high-performance lithium ion battery anode material. Nanoscale 2014, 6, 3353-3360.
Wang, B.; Li, X. L.; Zhang, X. F.; Luo, B.; Jin, M. H.; Liang, M. H.; Dayeh, S. A.; Picraux, S. T.; Zhi, L. J. Adaptable silicon-carbon nanocables sandwiched between reduced graphene oxide sheets as lithium ion battery anodes. ACS Nano. 2013, 7, 1437-1445.
Zhu, W. J.; Huang, H.; Gan, Y. P.; Tao, X. Y.; Xia, Y.; Zhang, W. K. Mesoporous cobalt monoxide nanorods grown on reduced graphene oxide nanosheets with high lithium storage performance. Electrochim. Acta 2014, 138, 376-382.
Cho, S. H.; Jung, J. W.; Kim, C.; Kim, D, I. Design of 1-D Co3O4 nano-fibers@low content graphene nanocomposite anode for high performance Li-ion batteries. Sci. Rep. 2017, 7, 45105.
Zhang, G. D.; Shi, Y. H.; Wang, H. R.; Jiang, L. L.; Yu, X. D.; Jing, S. Y.; Xing, S. X.; Tsiakaras, P. A facile route to achieve ultrafine Fe2O3 nanorods anchored on graphene oxide for application in lithium-ion battery. J. Power Sources 2019, 416, 118-124.
Zhao, B.; Liu, R. Z.; Cai, X. H.; Jiao, Z.; Wu, M. H.; Ling, X. T.; Lu, B.; Jiang, Y. Nanorod-like Fe2O3/graphene nanocomposite as a high-performance anode material for lithium ion batteries. J. Appl. Electrochem. 2013, 44, 53-60.
Radich, J. G.; Kamat, P. V. Origin of reduced graphene oxide enhancements in electrochemical energy storage. ACS Catal. 2012, 2, 807-816.
Liu, H. D.; Hu, Z. L.; Su, Y. Y.; Ruan, H. B.; Hu, R.; Zhang, L. MnO2 nanorods/3D-rGO nanocomposite as high performance anode materials for Li-ion batteries. Appl. Surf. Sci. 2017, 392, 777-784.
Chae, C.; Kim, K. W.; Yun, Y. J.; Lee, D.; Moon, J.; Choi, Y.; Lee, S. S.; Choi, S.; Jeong, S. Polyethylenimine-mediated electrostatic assembly of MnO2 nanorods on graphene oxides for use as anodes in lithium-ion batteries. ACS Appl. Mater. Interfaces 2016, 8, 11499-506.
Yun, Q. B.; Li, L. X.; Hu, Z. N.; Lu, Q. P.; Chen, B.; Zhang, H. Layered transition metal dichalcogenide-based nanomaterials for electrochemical energy storage. Adv. Mater. 2020, 32, 1903826.
Li, P. L.; Cui, J.; Zhou, J. D.; Guo, D.; Zhao, Z. Z.; Yi, J.; Fan, J.; Ji, Z. Q.; Jing, X. N.; Qu, F. M.; Yang, C. L.; Lu, L.; Lin, J. H.; Liu, Z.; Liu, G. T. Phase transition and superconductivity enhancement in Se-substituted MoTe2 thin films. Adv. Mater. 2019, 31, 1904641.
Wang, Q. S.; Li, J.; Besbas, J.; Hsu, C. H.; Cai, K. M.; Yang, L.; Cheng, S.; Wu, Y.; Zhang, W. F.; Wang, K. Y.; Chang, T. R.; Lin, H.; Chang, H. X.; Yang, H. Room-temperature nanoseconds spin relaxation in WTe2 and MoTe2 thin films. Adv. Sci. 2018, 5, 1700912.
Wu, B.; Luxa, J.; Kovalska, E.; Ivo, M.; Zhou, H. J.; Malek, R.; Marvan, P.; Wei, S. Y.; Liao, L. P.; Sofer, Z. Sub-millimetre scale Van der Waals single-crystal MoTe2 for potassium storage: electrochemical properties, and its failure and structure evolution mechanisms. Energy Storage Mater. 2021, 43, 284-292.
Zakhidov, D.; Rehn, D. A.; Reed, E. J.; Salleo, A. Reversible electrochemical phase change in monolayer to bulk-like MoTe2 by ionic liquid gating. ACS Nano 2020, 14, 2894-2903.
Chhowalla, M.; Shin, H. S.; Eda, G.; Li, L. J.; Loh, K. P.; Zhang, H. The chemistry of two-dimensional layered transition metal dichalcogenide nanosheets. Nat. Chem. 2013, 5, 263-275.
Chen, J. C.; Zhou, Z.; Liu, H. T.; Cheng, Z. G.; Bao, L. H.; Gao, H. J. One-dimensional weak antilocalization effect in 1T′-MoTe2 nanowires grown by chemical vapor deposition. J. Phys. Condens. Matter. 2021, 33, 185701.
Galván, D.; Rangel, R.; Adem, E. Formation of MoTe2 nanotubes by electron irradiation. Fullerene Sci. Technol. 1999, 7, 421-426.
Qiu, L. H.; Pol, V. G.; Wei, Y.; Gedanken, A. A two-step process for the synthesis of MoTe2 nanotubes: combining a sonochemical technique with heat treatment. J. Mater. Chem. 2003, 13, 2985-2988.
Zheng, N.; Jiang, G. Y.; Chen, X.; Mao, J. Y.; Zhou, Y. J.; Li, Y. S. Rational design of a tubular, interlayer expanded MoS2-N/O doped carbon composite for excellent potassium-ion storage. J. Mater. Chem. A 2019, 7, 9305-9315.
Zhu, H.; Wang, Q. X.; Cheng, L. X.; Addou, R.; Kim, J. Y.; Kim, M. J.; Wallace, R. M. Defects and surface structural stability of MoTe2 under vacuum annealing. ACS Nano. 2017, 11, 11005-11014.
Yao, K.; Xu, Z. W.; Huang, J. F.; Ma, M.; Fu, L. C.; Shen, X. T.; Li, J.; Fu, M. S. Bundled defect-rich MoS2 for a high-rate and long-life sodium-ion battery: achieving 3D diffusion of sodium ion by vacancies to improve kinetics. Small 2019, 15, 1805405.
Wang, Y. Q.; Shen, Y. L.; Xiao, X.; Dai, L. X.; Yao, S.; An, C. H. Topology conversion of 1T MoS2 to S-doped 2H-MoTe2 nanosheets with Te vacancies for enhanced electrocatalytic hydrogen evolution. Sci. China Mater. 2021, 64, 2202-2211.
Yoo, Y.; DeGregorio, Z. P.; Su, Y.; Koester, S. J.; Johns, J. E. In-plane 2H-1T' MoTe2 homojunctions synthesized by flux-controlled phase engineering. Adv. Mater. 2017, 29, 1605461.
Yang, J.; Ying, J. Y. A general phase-transfer protocol for metal ions and its application in nanocrystal synthesis. Nat Mater. 2009, 8, 683-689.
Zhao, W. Y.; Bai, M.; Li, S. W.; Tang, X. Y.; Wu, W. W.; Sun, C. C.; Yin, X. K.; Zhou, J.; Yuan, S.; Ma, Y. Integrated thin film battery design for flexible lithium ion storage: optimizing the compatibility of the current collector-free electrodes. Adv. Funct. Mater. 2019, 1903542.
Ma, N.; Jiang, X. Y.; Zhang, L.; Wang, X. S.; Cao, Y. L.; Zhang, X. Z. Novel 2D layered molybdenum ditelluride encapsulated in few-layer graphene as high-performance anode for lithium-ion batteries. Small 2018, 14, 1703680.
Panda, M. R.; Gangwar, R.; Muthuraj, D.; Sau, S.; Pandey, D.; Banerjee, A.; Chakrabarti, A.; Sagdeo, A.; Weyland, M.; Majumder, M.; Ban, Q. L.; Mitra, S. High performance lithium-ion batteries using layered 2H-MoTe2 as anode. Small 2020, 16, 2002669.
Panda, M. R.; Raj, K. A.; Ghosh, A.; Kumar, A.; Muthuraj, D.; Sau, S.; Yu, W. Z.; Zhang, Y. P.; Sinha, A. K.; Weyland, M.; Bao, Q. L.; Mitra, S. Blocks of molybdenum ditelluride: a high rate anode for sodium-ion battery and full cell prototype study. Nano Energy 2019, 64, 103951.
Xing, L. L.; Owusu, K. A.; Liu, X. Y.; Meng, J. S.; Wang, K.; An, Q. Y.; Mai, L. Q. Insights into the storage mechanism of VS4 nanowire clusters in aluminum-ion battery. Nano Energy 2021, 79, 105384.
Augustyn, V.; Come, J.; Lowe, M. A.; Kim, J. W.; Taberna, P. L.; Tolbert, S. H.; Abruna, H. D.; Simon, P.; Dunn, B. High-rate electrochemical energy storage through Li+ intercalation pseudocapacitance. Nat. Mater. 2013, 12, 518-522.
Hu, X.; Li, Y.; Zeng, G.; Jia, J. C.; Zhan, H. B.; Wen, Z. H. Three-dimensional network architecture with hybrid nanocarbon composites supporting few-layer MoS2 for lithium and sodium storage. ACS Nano 2018, 12, 1592-1602.
Gao, Q. S.; Wang, S. N.; Fang, H. C.; Weng, J. W.; Zhang, Y. H.; Mao, J. J.; Tang, Y. One-dimensional growth of MoOx-based organic-inorganic hybrid nanowires with tunable photochromic properties. J. Mater. Chem. 2012, 22, 4709-4715.

Figure 1 Schematic illustration for the fabrication of bare MoTe2 nanorods and MoTe2/rGO nanocomposite.

Figure 2 (a) XRD patterns of bare MoTe2 nanorods and MoTe2/rGO-10 nanocomposite together with standard pattern of MoTe2 highlighted with chopsticks, (b) SEM image, (c) TEM image, (d) HRTEM image, (e) SAED pattern, (f) TEM image and corresponding elemental mapping images of (g) Mo, (h) Te, (i) C (scale: 100 nm) in the MoTe2/rGO-10 nanocomposite.

Figure 3 High resolution XPS of MoTe2/GO-10 nanocomposite and bare MoTe2. (a) Mo 3d, and (b) Te 3d.

Figure 4 (a) CV curves of MoTe2/rGO-10 nanocomposite for initial six cycles at a scan rate of 0.2 mV s-1, (b) Initial charge/discharge profiles of the MoTe2/rGO-10 nanocomposite (1st-3rd cycles at 0.05 A g-1 and 4th-5th cycles at 0.2 A g-1), (c) Cycling performance of the bare MoTe2 and MoTe2/rGO-10 nanocomposite at 0.2 A g-1, (d) Rate capability of bare MoTe2 nanorods and MoTe2/rGO-10 nanocomposite, (e) Cycling performance of MoTe2/rGO-10 nanocomposite at 0.5 A g-1.

Figure 5 (a) CV curves of MoTe2/rGO-10 nanocomposite at different scan rates, (b) Log(i) versus log(v) plots at different oxidation and reduction states of MoTe2/rGO-10 nanocomposite, (c) Fitted pseudocapacitive contribution (red area) of the MoTe2/rGO-10 electrode at a scan rate of 0.9 mV s-1, (d) Ratio of pseudocapacitive (yellow) and diffusion-controlled (green) capacities at various scan rates of MoTe2/rGO-10 electrode.

Figure 6 (a) Galvanostatic charge/discharge curves at 0.1 C for different cycles of the MoTe2/rGO-10//LCO full cell in the voltage range of 1.5-3.8 V, (inset shows the 1st cycle charge/discharge curve), (b) Long-term cycling performance of the MoTe2/rGO-10//LCO full cell for 250 cycles at 0.1 C.

 扫一扫看文章

扫一扫关注我们
 DownLoad:
 下载:
下载:
 下载:
下载: