Citation:
Ye TIAN, Run-Ze MA, Ying JIANG. Structure and Growth of Two-dimensional Ices at the Surfaces Probed by Scanning Probe Microscopy[J]. Chinese Journal of Structural Chemistry,
2020, 39(3): 381-387.
doi:
10.14102/j.cnki.0254-5861.2011-2766
Structure and Growth of Two-dimensional Ices at the Surfaces Probed by Scanning Probe Microscopy
Received Date:
16 February 2020 Accepted Date:
20 February 2020 Available Online:
01 March 2020
Abstract:
Scanning probe microscopy (SPM) stands out as one of the most powerful tools for characterizing the solid surface and the adsorbed molecules with Ångström resolution in real space. In particular, this unique technique provides an unprecedented opportunity for directly probing the low-dimensional ices at surfaces. In this perspective, we first review the recent advances of scanning tunneling microscopy (STM) imaging of various two-dimensional (2D) ice structures on metal[1-7], insulator[8-12], graphite[13-15] surfaces and under strong confinement[10, 16-19]. We then introduce that noncontact atomic-force microscopy (AFM) with a CO-terminated tip enables atomic imaging of a genuine 2D ice grown on a hydrophobic Au(111) surface with minimal perturbation[20], paying particular attention to the growth processes at the edges of 2D ice. In the end, we present an outlook on the future applications of 2D ice as well as the relation between the 2D and 3D ice growth.
Water ices are ubiquitous in nature. The structure and growth of ice play critical roles in an incredibly broad spectrum of materials science, tribology, biology and atmospheric science. As early as the 1920s, Dennison, Bragg and Barnes studied the crystal structure of ice using X-ray diffraction, which represent the first attempts to learn about ice structures at molecular scale. For the following nearly 100 years, enormous experiments and theoretical calculations have led to the discovery of eighteen crystalline phases (three-dimensional phases), among which the hexagonal ice (Ice Ih) is the most common ice in the biosphere. However, whether the ice can exist at two dimensions (2D) has been under longstanding debate. At the monolayer limit, the 2D ice usually contains high-density unsaturated hydrogen bonds, and is thus unstable compared with the 3D case. Even though 2D ice can be stabilized through the interaction with the substrate, it largely relies on the structure and symmetry of the substrate. Therefore, it cannot be considered as the genuine 2D ice. In addition, conventional methods of investigating low-dimen-sional water ices are mostly based on spectroscopic and diffraction techniques, such as sum-frequency generation (SFG)[21], XRD[22, 23], nuclear magnetic resonance (NMR)[24, 25], neutron scattering[26, 27], and so on. However, due to the limitation of low spatial resolution, those techniques suffer from the broa-dening and averaging effects which may easily smear out the subtle details of water-solid interaction.
2.
RECENT ADVANCES
Scanning tunneling microscopy (STM), as a pro-mising tool to probe the solid surface and the adsorbed molecules with Ångström resolution in real space, provides an unprecedented opportunity for directly identifying the water structure at surface. Since STM usually requires conductive substrates, the majority of work is focused on various metal surfaces or ultra-thin insulator films on metal surface since the beginning of this century. For hydrophilic metal surface, the main factor governing the structure of the 2D water overlayers at surfaces is the delicate balance between the water-water H bonding and the water-metal bonding, which leads to immensely rich phases of surface water on Cu(110)[28-30], Pd(111)[31, 32], Pt(111)[2, 33], Ru(0001)[31, 32], and Ni(111)[3]. The wetting behavior of water is strongly dependent on surface structure and symmetry of the substrate, and deviates from the conventional bilayer-ice model, which was originally proposed by Doering and Madey to discuss the interfacial water in almost all environments[34].
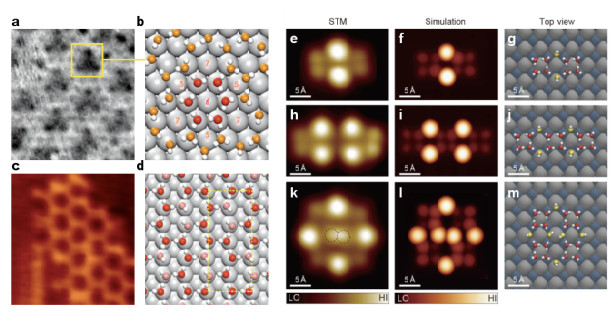
Fig. 1a~d show two representative examples of 2D water layers on the Pt(111) and Cu(110) surfaces. For Pt(111), the water structure consists of five-, six- and seven-membered rings with the water molecules at various heights above the surface forming a $ \sqrt{37}\times \sqrt{37}-25.3° $ phase[7]. For Cu(110), the STM images indicate the formation of a partially dissociated water layer that is ordered yet not fully stoichiometric with the H2O: OH ratio of approxi-mately 2[7]. On the other hand, water structures on the insulating surfaces are also related with the substrate lattice. Chen et al. demonstrate a new type of 2D ice-like bilayer structure built from planar water tetramers at an insulating NaCl(001) film on Au(111), which is completely different from the conventional hexagonal bilayer-ice picture[8] (Fig. 1, e~m). A novel bridging mechanism allows the interconnection of water tetramers to form chains, flakes and eventually a two-dimensional bilayer ice containing a regular array of Bjerrum D-type defects. Because of the strong water-substrate interaction, all these water structures largely rely on the symmetry and structure of the substrate, and cannot be considered as the genuine 2D ices, which are stable on their own.
Figure 1
Figure 1.
STM and DFT results for extended water overlayers on hydrophilic metal and insulator surface. a and b: STM image (a) the corresponding DFT-based structural model (b) of a water adlayer on Pt(111). The structural model consists of five-, six- and seven-membered rings with the water molecules at various heights above the surface. The water molecules in the six-membered rings that bind to the surface most strongly are indicated with red oxygen atoms. c and d: STM image (c) and a DFT-based structural model (d) of a water–hydroxyl overlayer on Cu(110). The periodic overlayer model consists of a 2:1 H2O: OH ratio. Water molecules are indicated with red oxygen atoms and hydroxyls with pink oxygen atoms. e~m: imaging and models of fourtypes of water clusters on the NaCl(001) surface. e, h and k: STM topographies of the water nanoclusters acquired at 5 K. Simulations and side views, respectively of the calculated adsorption configurations of the water clusters. For clarity, the O atoms of water molecules in lower and upper layers are represented by red and yellow spheres, respectively. Scale bars 5 Å. Figures reproduced from: a~d, ref. 7, e~m, ref. 8.
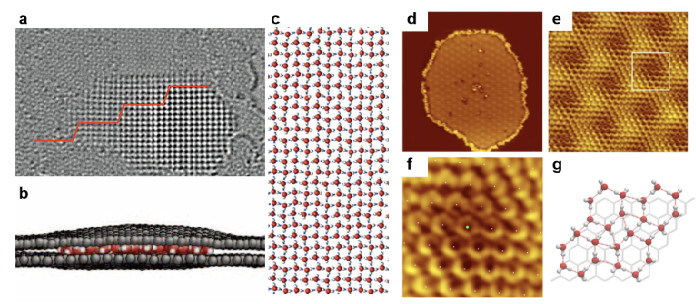
In order to find out the archetypal example of the 2D ices, we should pay particular attention to the water structure on the hydrophobic surface, as the water-surface interaction is much weaker than water-water H bonding. Algara-Siller et al. reported the high-resolution transmission electron microscopy (TEM) imaging of a 2D square ice at room tempera-ture locked between two graphene sheets, which can be deemed to a hydrophobic nano-confinement[17] (Fig. 2, a~c). However, in the subsequent com-ments, Zhou et al. suggested that the accidental contamination with NaCl (or another salt with a similar structure) and subsequent salt nanocrystal formation can better explain the reported experi-mental data than the 'square ice'[35]. Recently, Zhang et al. reported a novel monolayer ice built from water hexamers on the graphite surface, which is indepen-dent with the graphite lattice, confirming its stand-alone 2D nature[15] (Fig. 2, d~g). The water hexamers don't share edges with each other, but are interconnected via composing triangles or tetragons. It is worthy to be noted that such a 2D structure can only exist in small sizes (typically tens of nano-meters), and need to be stabilized by disordered water structure at the edges. Whether it represents a genuine 2D ice is still an open question.
Figure 2
Figure 2.
Water overlayers form under hydrophobic nano-confinements and on hydrophobic graphite surface. a~c: TEM images of water monolayer under graphene nano-confinement. a, Isolated crystallite with a varying number of layers. The red curve shows changes in the contrast averaged over the corresponding parts of the image. The changes occur in quantized steps. b, Side view of the simulations of 2D ice formed by a water nanodroplet (100 molecules) confined between two freely moving flexible graphene sheets. c, Typical snapshot of MD-simulated water in a graphene nanocapillary. d~g: STM images of the hexagonal monolayer ice without sharing edges on the graphite surface. d, Typical monolayer ice island with small misorientation (∼2.0°) relative to the graphite lattice recorded at 78 K. e, Moiré pattern revealed by the monolayer ice. f, Enlarged images corresponding to the box region in e. The green dots represent the center of the "flat" hexagonal ring. g, Top view of the optimized geometry of the monolayer ice from DFT calculations. The size of the images is 100nm × 100nm (d), 15nm × 15nm (e) and 4nm × 4nm. Figures reproduced from: a~c, ref. 17, d~g, ref. 15.
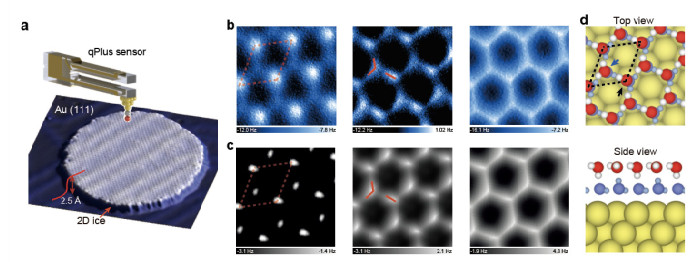
More than twenty years ago, Koga et al. Theore-tiaclly predicted that the 2D flat bilayer of hexagonal ice can form on hydrophobic surfaces and under hydrophobic confinements[16]. Ten years later, the evidence of such a 2D hexogonal ice was suggested by spectroscopic methods on graphene[14]. However, its existence still remains elusive and needs direct experimental proof. Most recently, Ma et al. have successfully grown the 2D bilayer hexagonal ice and imaged the 2D ice growth at the edges with atomic resolution at Au(111) surface by employing a qPlus-based atomic force microscopy (AFM) with CO-functionalized tip (Fig. 3, a)[36]. The AFM frequency-shift relies on the competition between the high-order electrostatic force and Pauli repulsion force, thus allowing to distinguish the H atoms from the O atoms in a nearly non-invasive manner.
Figure 3
Figure 3.
Experimental setup and detailed AFM images of 2D bilayer ice and the corresponding structural model. a: Schematic of STM and AFM imaging of a 2D bilayer ice island on Au(111) using qPlus-based of non-contact AFM with a CO-terminated tip. The line profile across the step edge shows the height the island (about 2.5 Å). b and c: Constant-height AFM (Δf) imaging and simulated AFM images for different tip heights (The tip height decreases from left to right). The O–H directionality of the water molecules is highlighted by the solid red lines. d: Top and side views of the bilayer ice structure on the Au(111) surface. The image size is 1.25nm × 1.25nm. Figures reproduced from: a~d, ref. 36.
The key step is to choose the hydrophobic Au(111) surface as the substrate, which only weakly interacts with the water molecules. By carefully tuning the temperature and water pressure, a single-crystal 2D ice can be grown, fully wetting the surface with a thickness of around 2.5 Å, corresponding to that of two water overlayers. The high-order electrostatic force is very sensitive to the orientation of water molecules[20, 37], such that the flat and vertical water molecules show distinctly different contrast in AFM images (Fig. 3, b and c, left and middle panels). When the tip height is further decreased to enter into the Pauli repulsion-force region, the AFM image shows a honeycomb structure with sharp lines connecting the two sub-lattices, resembling the H bonds (Fig. 3, b and c, right panel).
The submolecular-resolution images combined with Density functional theory (DFT) calculations reveal that the 2D ice grown on the Au(111) surface corresponds to an interlocked bilayer-ice structure, consisting of two flat hexagonal water layers (Fig. 3, d). In each water layer, half of the water molecules are lying flat while the other half are vertical with one O–H either upward or downward. The vertical water in one layer donates a H bond to the flat water in the other layer, leading to a fully saturated H-bonding structure. Therefore, it is the first genuine 2D ice confirmed both by theory and experiment, i.e., named 2D ice I.
To understand the ice growth mechanism, the AFM was employed to image the edges of the 2D ice island. The disturbance of the CO-tip on the water can be reduced to a minimal level, thanks to the ultra-high flexibility of the tip apex and the weak high-order electrostatic force between the tip and the water molecules. The weakly-perturbative nature of the probe overcomes the challenge of resolving highly fragile edge structures. Notably, the resear-chers deeply froze various metastable/intermediate edge structures involved in the ice growth, thus signi-ficantly prolonging their lifetimes to allow stable imaging. Those snapshots images were then used to reconstruct the ice growth process (Fig. 4). Very distinct ice growth behaviors were found, namely "collective bridging mode" for zigzag edge and "local seeding mode" for armchair edge.
Figure 4
Figure 4.
Proposed growing process for zigzag and armchair edges. a and b: Constant-height AFM images and the corresponding ball-and-stick models of the most stable (1) and metastable structures (2~4) of zigzag (a) and armchair (b) edges. The proposed growing process cycles through steps 1 to 4. In the AFM images, each red arrow indicates the addition of one bilayer water pair, leading to the structure in the subsequent image. In the ball-and-stick models, the red balls and sticks represent the newly added bilayer water pairs, and those in blue show the existing structures. The size of the images is 3.2nm × 1.9nm (a) and 3.7nm × 2.2nm (b). Figures reproduced from: a, b, ref. 36.
The experimental confirmation of the existence of the genuine 2D ice (2D ice I) opens the door to explore other stand-alone 2D ice phases in nature. It is the first experiment to yield the atomic-scale information of ice growth in real space, which may renovate our conventional understanding of the formation and melting of low-dimensional ices on hydrophobic surfaces or under hydrophobic confine-ment. The observed growth behavior might be a generic phenomenon for 2D ice, given that the relative stability of the different edge structures shows negligible dependence on the water spacing and the commensurability with the substrate. For the next, it is interesting to study the growth evolution from 2D to 3D ices, which has wider relevance to ice formation and growth in general. It can be expected that the 2D growth mode can persist up to a certain thickness, after which the whole ice overlayers will undergo a structural transformation from the stacked flat bilayer ices to interconnected buckled bilayer ice, similar to the transformation from the graphite to diamond.
Technologically, the 2D ices also have many potential applications. For example, the 2D ice on the surface can promote or inhibit the formation of 3D ice, which may provide new guide for the design of anti-icing materials. As all H bonds of water molecu-les in the 2D ice are saturated, the interaction with the surface is thus minimal. Such a property can lead to super-lubrication and be used to reduce friction between materials. Moreover, the 2D ice itself can also be employed as a unique 2D material, which constitutes a new platform for the research on high-temperature superconductivity, deep ultraviolet detection and cryo-electron microscopy.
[1]
Hodgson, A.; Haq, S. Water adsorption and the wetting of metal surfaces. Surf. Sci. Rep.2009, 64(9), 381–451. doi: 10.1016/j.surfrep.2009.07.001
[2]
Nie, S.; Feibelman, P. J.; Bartelt, N. C.; Thurmer, K. Pentagons and heptagons in the first water layer on Pt(111). Phys. Rev. Lett.2010, 105(2), 026102. doi: 10.1103/PhysRevLett.105.026102
[3]
Thurmer, K.; Nie, S. Formation of hexagonal and cubic ice during low-temperature growth. P. Natl. Acad. Sci. USA.2013, 110(29), 11757–11762. doi: 10.1073/pnas.1303001110
[4]
Maier, S.; Lechner, B. A. J.; Somorjai, G. A.; Salmeron, M. Growth and structure of the first layers of ice on Ru(0001) and Pt(111). J. Am. Chem. Soc.2016, 138(9), 3145–3151. doi: 10.1021/jacs.5b13133
[5]
Lin, C.; Avidor, N.; Corem, G.; Godsi, O.; Alexandrowicz, G.; Darling, G. R.; Hodgson, A. Two-dimensional wetting of a stepped copper surface. Phys. Rev. Lett.2018, 120(7), 076101. doi: 10.1103/PhysRevLett.120.076101
[6]
Mehlhom, M.; Morgenstern, K. Faceting during the transformation of amorphous to crystalline ice. Phys. Rev. Lett.2007, 99(24), 246101. doi: 10.1103/PhysRevLett.99.246101
[7]
Carrasco, J.; Hodgson, A.; Michaelides, A. A molecular perspective of water at metal interfaces. Nat. Mater.2012, 11(8), 667–674. doi: 10.1038/nmat3354
[8]
Chen, J.; Guo, J.; Meng, X. Z.; Peng, J. B.; Sheng, J. M.; Xu, L. M.; Jiang, Y.; Li, X. Z.; Wang, E. G. An unconventional bilayer ice structure on a NaCl(001) film. Nat. Commun.2014, 54056.
[9]
Hu, J.; Xiao, X. D.; Ogletree, D. F.; Salmeron, M. Imaging the condensation and evaporation of molecularly thin-films of water with nanometer resolution. Science1995, 268(5208), 267–269. doi: 10.1126/science.268.5208.267
[10]
Xu, K.; Cao, P. G.; Heath, J. R. Graphene visualizes the first water adlayers on mica at ambient conditions. Science2010, 329(5996), 1188–1191. doi: 10.1126/science.1192907
[11]
Odelius, M.; Bernasconi, M.; Parrinello, M. Two dimensional ice adsorbed on mica surface. Phys. Rev. Lett.1997, 78(14), 2855–2858. doi: 10.1103/PhysRevLett.78.2855
[12]
Meier, M.; Hulva, J.; Jakub, Z.; Pavelec, J.; Setvin, M.; Bliem, R.; Schmid, M.; Diebold, U.; Franchini, C.; Parkinson, G. S. Water agglomerates on Fe3O4(001). P. Natl. Acad. Sci. USA.2018, 115(25), E5642–E5650.
[13]
Lupi, L.; Kastelowitz, N.; Molinero, V. Vapor deposition of water on graphitic surfaces: Formation of amorphous ice, bilayer ice, ice I, and liquid water. J. Chem. Phys.2014, 141(18), 18C508. doi: 10.1063/1.4895543
[14]
Kimmel, G. A.; Matthiesen, J.; Baer, M.; Mundy, C. J.; Petrik, N. G.; Smith, R. S.; Dohnalek, Z.; Kay, B. D. No confinement needed: Observation of a metastable hydrophobic wetting two-layer ice on graphene. J. Am. Chem. Soc.2009, 131(35), 12838–12844. doi: 10.1021/ja904708f
[15]
Zhang, X.; Xu, J. Y.; Tu, Y. B.; Sun, K.; Tao, M. L.; Xiong, Z. H.; Wu, K. H.; Wang, J. Z.; Xue, Q. K.; Meng, S. Hexagonal monolayer ice without shared edges. Phys. Rev. Lett.2018, 121(25), 256001. doi: 10.1103/PhysRevLett.121.256001
[16]
Koga, K.; Zeng, X. C.; Tanaka, H. Freezing of confined water: A bilayer ice phase in hydrophobic nanopores. Phys. Rev. Lett.1997, 79(26), 5262–5265. doi: 10.1103/PhysRevLett.79.5262
[17]
Algara-Siller, G.; Lehtinen, O.; Wang, F. C.; Nair, R. R.; Kaiser, U.; Wu, H. A.; Geim, A. K.; Grigorieva, I. V. Square ice in graphene nanocapillaries. Nature2015, 519(7544), 443–445. doi: 10.1038/nature14295
[18]
Chen, J.; Schusteritsch, G.; Pickard, C. J.; Salzmann, C. G.; Michaelides, A. Two dimensional ice from first principles: Structures and phase transitions. Phys. Rev. Lett.2016, 116(2), 025501. doi: 10.1103/PhysRevLett.116.025501
[19]
Bampoulis, P.; Teernstra, V. J.; Lohse, D.; Zandvliet, H. J. W.; Poelsema, B. Hydrophobic ice confined between graphene and MoS2. J. Phys. Chem. C.2016, 120(47), 27079–27084. doi: 10.1021/acs.jpcc.6b09812
[20]
Peng, J. B.; Guo, J.; Hapala, P.; Cao, D. Y.; Ma, R. Z.; Cheng, B. W.; Xu, L. M.; Ondracek, M.; Jelinek, P.; Wang, E. G.; Jiang, Y. Weakly perturbative imaging of interfacial water with submolecular resolution by atomic force microscopy. Nat. Commun.2018, 9122.
[21]
Shen, Y. R.; Ostroverkhov, V. Sum-frequency vibrational spectroscopy on water interfaces: Polar orientation of water molecules at interfaces. Chem. Rev.2006, 106(4), 1140–1154. doi: 10.1021/cr040377d
[22]
Dosch, H.; Lied, A.; Bilgram, J. H. Disruption of the hydrogen-bonding network at the surface of I-h ice near surface premelting. Surf. Sci.1996, 366(1), 43–50. doi: 10.1016/0039-6028(96)00805-9
[23]
Nakamura, M.; Ito, M. Monomer structures of water adsorbed on p(2x2)-Ni(111)-O surface at 25 and 140 K studied by surface X-ray diffraction. Phys. Rev. Lett.2005, 94(3), 035501. doi: 10.1103/PhysRevLett.94.035501
[24]
Matubayasi, N.; Wakai, C.; Nakahara, M. Structural study of supercritical water. 1. Nuclear magnetic resonance spectroscopy. J. Chem. Phys.1997, 107(21), 9133–9140. doi: 10.1063/1.475205
[25]
Mallamace, F.; Broccio, M.; Corsaro, C.; Faraone, A.; Wanderlingh, U.; Liu, L.; Mou, C. Y.; Chen, S. H. The fragile-to-strong dynamic crossover transition in confined water: Nuclear magnetic resonance results. J. Chem. Phys.2006, 124(16), 161102. doi: 10.1063/1.2193159
[26]
Steitz, R.; Gutberlet, T.; Hauss, T.; Klosgen, B.; Krastev, R.; Schemmel, S.; Simonsen, A. C.; Findenegg, G. H. Nanobubbles and their precursor layer at the interface of water against a hydrophobic substrate. Langmuir2003, 19(6), 2409–2418. doi: 10.1021/la026731p
[27]
Schwendel, D.; Hayashi, T.; Dahint, R.; Pertsin, A.; Grunze, M.; Steitz, R.; Schreiber, F. Interaction of water with self-assembled monolayers: Neutron reflectivity measurements of the water density in the interface region. Langmuir2003, 19(6), 2284–2293. doi: 10.1021/la026716k
[28]
Kumagai, T.; Okuyama, H.; Hatta, S.; Aruga, T.; Hamada, I. Water clusters on Cu(110): Chain versus cyclic structures. J. Chem. Phys.2011, 134(2), 024703. doi: 10.1063/1.3525645
[29]
Carrasco, J.; Michaelides, A.; Forster, M.; Haq, S.; Raval, R.; Hodgson, A. A one-dimensional ice structure built from pentagons. Nat. Mater.2009, 8(5), 427–431. doi: 10.1038/nmat2403
[30]
Forster, M.; Raval, R.; Hodgson, A.; Carrasco, J.; Michaelides, A. c(2 x 2) water-hydroxyl layer on Cu(110): A wetting layer stabilized by Bjerrum defects. Phys. Rev. Lett.2011, 106(4), 046103. doi: 10.1103/PhysRevLett.106.046103
[31]
Tatarkhanov, M.; Ogletree, D. F.; Rose, F.; Mitsui, T.; Fomin, E.; Maier, S.; Rose, M.; Cerda, J. I.; Salmeron, M. Metal- and hydrogen-bonding competition during water adsorption on Pd(111) and Ru(0001). J. Am. Chem. Soc.2009, 131(51), 18425–18434. doi: 10.1021/ja907468m
[32]
Maier, S.; Stass, I.; Mitsui, T.; Feibelman, P. J.; Thurmer, K.; Salmeron, M. Adsorbed water-molecule hexagons with unexpected rotations in islands on Ru(0001) and Pd(111). Phys. Rev. B2012, 85(15), 155434. doi: 10.1103/PhysRevB.85.155434
[33]
Standop, S.; Redinger, A.; Morgenstern, M.; Michely, T.; Busse, C. Molecular structure of the H2O wetting layer on Pt(111). Phys. Rev. B2010, 82(16), 161412(R). doi: 10.1103/PhysRevB.82.161412
[34]
Doering, D. L.; Madey, T. E. The adsorption of water on clean and qxygen-dosed Ru(001). Surf. Sci.1982, 123(2–3), 305-337. doi: 10.1016/0039-6028(82)90331-4
[35]
Wang, F. C.; Wu, H. A.; Geim, A. K. The observation of square ice in graphene questioned Reply. Nature2015, 528(7583), E1-E2. doi: 10.1038/nature16145
[36]
Ma, R. Z.; Cao, D. Y.; Zhu, C. Q.; Tian, Y.; Peng, J. B.; Guo, J.; Chen, J.; Li, X. Z.; Francisco, J. S.; Zeng, X. C.; Xu, L. M.; Wang, E. G.; Jiang, Y. Atomic imaging of the edge structure and growth of a two-dimensional hexagonal ice. Nature2020, 577(7788), 60–63. doi: 10.1038/s41586-019-1853-4
[37]
Peng, J. B.; Cao, D. Y.; He, Z. L.; Guo, J.; Hapala, P.; Ma, R. Z.; Cheng, B. W.; Chen, J.; Xie, W. J.; Li, X. Z.; Jelinek, P.; Xu, L. M.; Gao, Y. Q.; Wang, E. G.; Jiang, Y. The effect of hydration number on the interfacial transport of sodium ions. Nature2018, 557(7707), 701–705. doi: 10.1038/s41586-018-0122-2
Figure 1
STM and DFT results for extended water overlayers on hydrophilic metal and insulator surface. a and b: STM image (a) the corresponding DFT-based structural model (b) of a water adlayer on Pt(111). The structural model consists of five-, six- and seven-membered rings with the water molecules at various heights above the surface. The water molecules in the six-membered rings that bind to the surface most strongly are indicated with red oxygen atoms. c and d: STM image (c) and a DFT-based structural model (d) of a water–hydroxyl overlayer on Cu(110). The periodic overlayer model consists of a 2:1 H2O: OH ratio. Water molecules are indicated with red oxygen atoms and hydroxyls with pink oxygen atoms. e~m: imaging and models of fourtypes of water clusters on the NaCl(001) surface. e, h and k: STM topographies of the water nanoclusters acquired at 5 K. Simulations and side views, respectively of the calculated adsorption configurations of the water clusters. For clarity, the O atoms of water molecules in lower and upper layers are represented by red and yellow spheres, respectively. Scale bars 5 Å. Figures reproduced from: a~d, ref. 7, e~m, ref. 8.
Figure 2
Water overlayers form under hydrophobic nano-confinements and on hydrophobic graphite surface. a~c: TEM images of water monolayer under graphene nano-confinement. a, Isolated crystallite with a varying number of layers. The red curve shows changes in the contrast averaged over the corresponding parts of the image. The changes occur in quantized steps. b, Side view of the simulations of 2D ice formed by a water nanodroplet (100 molecules) confined between two freely moving flexible graphene sheets. c, Typical snapshot of MD-simulated water in a graphene nanocapillary. d~g: STM images of the hexagonal monolayer ice without sharing edges on the graphite surface. d, Typical monolayer ice island with small misorientation (∼2.0°) relative to the graphite lattice recorded at 78 K. e, Moiré pattern revealed by the monolayer ice. f, Enlarged images corresponding to the box region in e. The green dots represent the center of the "flat" hexagonal ring. g, Top view of the optimized geometry of the monolayer ice from DFT calculations. The size of the images is 100nm × 100nm (d), 15nm × 15nm (e) and 4nm × 4nm. Figures reproduced from: a~c, ref. 17, d~g, ref. 15.
Figure 3
Experimental setup and detailed AFM images of 2D bilayer ice and the corresponding structural model. a: Schematic of STM and AFM imaging of a 2D bilayer ice island on Au(111) using qPlus-based of non-contact AFM with a CO-terminated tip. The line profile across the step edge shows the height the island (about 2.5 Å). b and c: Constant-height AFM (Δf) imaging and simulated AFM images for different tip heights (The tip height decreases from left to right). The O–H directionality of the water molecules is highlighted by the solid red lines. d: Top and side views of the bilayer ice structure on the Au(111) surface. The image size is 1.25nm × 1.25nm. Figures reproduced from: a~d, ref. 36.
Figure 4
Proposed growing process for zigzag and armchair edges. a and b: Constant-height AFM images and the corresponding ball-and-stick models of the most stable (1) and metastable structures (2~4) of zigzag (a) and armchair (b) edges. The proposed growing process cycles through steps 1 to 4. In the AFM images, each red arrow indicates the addition of one bilayer water pair, leading to the structure in the subsequent image. In the ball-and-stick models, the red balls and sticks represent the newly added bilayer water pairs, and those in blue show the existing structures. The size of the images is 3.2nm × 1.9nm (a) and 3.7nm × 2.2nm (b). Figures reproduced from: a, b, ref. 36.

 DownLoad:


 下载:
下载:


 下载:
下载:
