Table 1.
Selected Bond Lengths (Å) and Bond Angles (°) for Complex 1
Citation:
Jian-Mei HU, Yong WANG. Synthesis and Characterization of the cis-Dicyanoiron(Ⅱ) Building Block and Its Interactions with Selected Metal Ions[J]. Chinese Journal of Structural Chemistry,
2020, 39(9): 1714-1722.
doi:
10.14102/j.cnki.0254-5861.2011-2666

Synthesis and Characterization of the cis-Dicyanoiron(Ⅱ) Building Block and Its Interactions with Selected Metal Ions
English
Synthesis and Characterization of the cis-Dicyanoiron(Ⅱ) Building Block and Its Interactions with Selected Metal Ions
Abstract:
In this work, a cis-dicyanoiron(Ⅱ) building block, cis-FeⅡ(bpy)2(CN)2 (1, bpy = 2,2΄-bipyridine), has been prepared and fully characterized by IR, electronic absorption spectra, elemental analysis, cyclic voltammetry and single-crystal X-ray diffraction analysis. The interactions of complex 1 with selected metal ions, such as Cu(Ⅱ), Fe(Ⅲ), Pb(Ⅱ), Fe(Ⅱ), Cr(Ⅲ), Cd(Ⅱ), Co(Ⅱ), Zn(Ⅱ), Ni(Ⅱ) and Mn(Ⅱ), were investigated employing electronic absorption spectroscopy. The electronic absorption spectroscopy indicates Cu(Ⅱ), Fe(Ⅲ), Cr(Ⅲ), Cd(Ⅱ), Co(Ⅱ), Zn(Ⅱ) and Ni(Ⅱ) ions steadily coordinate with 1 via cyanide, respectively. Fluorescent emission intensity of 1 increased upon the addition of Zn(Ⅱ) ion, quenched by adding ions Cu(Ⅱ), Fe(Ⅲ) and Pb(Ⅱ), and it was almost unchanged when adding the Fe(Ⅱ), Cr(Ⅲ), Cd(Ⅱ), Co(Ⅱ), Ni(Ⅱ) and Mn(Ⅱ) ions.
-
Key words:
- cyanide
- / iron(Ⅱ)
- / molecular structure
- / electronic absorption spectroscopy
- / fluorescent spectroscopy
-
1. INTRODUCTION
Currently, many efforts have been devoted to the rapid detection of transition metal ions because of their widespread societal concern related to human health and environment. Most transition metal ions are essential trace elements for human body[1]. As a vital kind of element, iron is an indispensable and the most abundant trace element in the human body, which participates in important physiological processes such as hemoglobin, myoglobin, brain albumin and DNA synthesis, and cellular energy metabolism. The detection and quantification of Fe(Ⅲ) ion are extremely essential for living organisms since either its deficiency or overloading will result in many physiological disorders[2]. Copper as the third-most abundant transition metal also plays a significant role in various biological processes like the composition of copper-containing enzyme and copper-binding protein, maintaining normal hematopoietic function, protecting central nervous system health and so on. Copper deficiency can lead to elevated plasma cholesterol and increase the risk of atherosclerosis, which is an important factor in causing coronary heart disease. Copper excess has been reported to lead many diseases including Alzheimer's, Parkinson's and Prion disease and Amyotrophic Lateral Sclerosis[3]. Cadmium can be accumulated in several organs. Even the low concentration of cadmium may lead to digestive, kidney and especially carcinogenic effects[4]. For instance, it needs to be mentioned that recognition and sensing of these transition metal ions play a significant role in life science, medicinal science, environmental science, and the nuclear industry[5]. In order to detect the low metal ions concentration in different samples, very sensitive techniques are required. The conventional detection methods for chromium, including atomic absorption spectrometry (AAS), inductively coupled plasma atomic emission spectrometry (ICP-AES), inductively coupled plasma mass spectrometry (ICP-MS), etc[6], usually suffer from needing expensive instruments and complicated and tedious sample preparation. To overcome the shortage of these traditional methods, fluorescence methods[7-9] have gained increasing interest in chemical and biological applications due to their simplicity and high detection sensitivity, low toxicity, and flexibility of synthesis[10].
Polypyridine containing cyanide is one of the favourite ''building blocks" in fluorophore construction due to its availability and tailorability and thus its derived systems have intensively been exploited in molecular recognitions[11-13]. In this work, we have synthesized and characterized a cis-dicyanoiron(Ⅱ) building block, cis-FeⅡ(bpy)2(CN)2 (1). Electronic absorption spectroscopy and fluorescent spectroscopy were utilized to investigate the interaction of selected metal ions (Cu(Ⅱ), Fe(Ⅲ), Pb(Ⅱ), Fe(Ⅱ), Cr(Ⅲ), Cd(Ⅱ), Co(Ⅱ), Zn(Ⅱ), Ni(Ⅱ), Mn(Ⅱ), Fe(Ⅱ) and Pb(Ⅱ)) with complex 1.
2. EXPERIMENTAL
2.1 Physical measurements
Elemental analyses (C, H, N) were performed at a Vario MICRO elemental analyzer. Infrared (IR) spectra were obtained from KBr pellets with a Perkin-Elmer Spectrum One FT-IR spectrophotometer. Electronic absorption spectra were measured on a JASCO V770 UV-vis-NIR spectrophotometer in a quartz cell (1 cm). Electrochemical measurements were performed on a V3-Studio using a three-electrode system: glassy graphite electrode, Ag/AgCl electrode and platinum wire serving as the working, reference and counter electrodes, respectively, which were measured in acetonitrile solution containing 0.1 M (Bu4N)(PF6) as a supporting electrolyte at a scan rate of 100 mV·s-1. Fluorescent spectra were recorded on an F-4600 spectrophotometer in a quartz cell (1 cm). Excitation and emission slits were both at 5 nm and the scan speed was 1200 nm/min with a PMT voltage at 600 V.
2.2 Synthesis of cis-Fe(bpy)2(CN)2·2H2O·CH2Cl2 (1)
Caution. Potassium cyanide is potentially explosive, so careful handling in small quantities is highly suggested for safety consideration.
This complex was prepared according to a modified method based on the previous report[14, 15]. 2,2΄-Bipyridine (3.44 g, 0.022 mol) was added to a solution of (NH4)2Fe(SO4)2·6H2O (3.93 g, 0.01 mol) in water (100 mL), and the mixture was heated to 90 ℃ for 3 h, during which the solution changed from colorlessness to red quickly. After cooling to room temperature, 20 equivalents of KCN (13.00 g, 0.20 mol) were added to the red solution, and then the mixture was heated to 90 ℃ for additional 8 h. During this period the solution gradually changed from red to violet and some violet precipitate appeared. After the reaction was cooled to room temperature, a purple precipitate was collected by filtration and washed with water (3 × 20 mL), 2-propanol (3 × 15 mL) and ethyl ether (2 × 15 mL), respectively. After drying in air, the desired purple product (4.98 g, 92%) was obtained. Purple crystals of 1 suitable for single-crystal X-ray diffraction were obtained by a mixed solution of CH3OH (5 mL), CH2Cl2 (5 mL) and diethyl-ether (30 mL). Anal. Calcd. for C23H22Cl2FeN6O2: C, 51.04, H, 4.10; N, 15.53%. Found: C, 50.82; H, 4.36; N, 15.27%. IR (KBr pellet, cm−1): 3378s, 3107w, 3077w, 3064w, 3027w, 3019w, 2079s, 2069s, 1634w, 1602m, 1568w, 1486w, 1468s, 1445s, 1428m, 1385w, 1315m, 1277m, 1243m, 1177w, 1159m, 1122w, 1103w, 1075w, 1061w, 1045w, 1018w, 970w, 907w, 879w, 803m, 777s, 769s, 748m, 733s, 649w, 559w, 522w. UV-vis (CH3CN), λmax, nm (ε, dm3·mol·cm-1): 196 (121400), 246 (18130), 295 (33820), 388 (6553), 606 (7080).
2.3 X-ray structure determination
The crystal data for complex 1 were collected on a Saturn724+ CCD diffractometer equipped with graphite-monochromatic MoKα (λ = 0.71073 Å) radiation by using an ω-scan mode at 293 K. For 1, a total of 5409 reflections were collected in the range of 2.00≤θ≤27.50º, of which 4121 (Rint = 0.0528) were independent. The structure was solved by direct methods using SHELXS-2016[16] and refined by full-matrix least-squares techniques on F2 with SHELXL-2016. Anisotropic thermal parameters were used for the non-hydrogen atoms, and isotropic thermal parameters for the hydrogen atoms. Hydrogen atoms on the aromatic rings were placed geometrically with isotropic thermal parameters 1.2 times that of the attached carbon atom. The final R = 0.0903 and wR = 0.2445 (w =1/[σ2(Fo2) + (0.0614P)2 + 0.00P], where P = (Fo2 +2Fc2)/3) for all data, S = 1.015. Selected bond distances and bond angles for complex 1 are listed in Table 1.
Table 1

 DownLoad:
CSV
DownLoad:
CSV
Bond Dist. Bond Dist. Bond Dist. Fe(1)–C(1) 1.921(4) C(2)≡N(2) 1.139(5) Fe(1)–N(5) 1.964(3) Fe(1)–C(2) 1.931(4) Fe(1)–N(3) 2.010(3) Fe(1)–N(6) 1.999(3) C(1)≡N(1) 1.155(5) Fe(1)–N(4) 1.971(3) Angle (°) Angle (°) Angle (°) C(1)–Fe(1)–C(2) 89.49(15) C(1)–Fe(1)–N(6) 90.02(14) N(3)–Fe(1)–N(5) 92.68(13) N(1)≡C(1)–Fe(1) 177.2(3) C(2)–Fe(1)–N(3) 90.84(14) N(3)–Fe(1)–N(6) 89.94(12) N(2)≡C(2)–Fe(1) 179.8(4) C(2)–Fe(1)–N(4) 89.08(14) N(4)–Fe(1)–N(5) 172.68(12) C(1)–Fe(1)–N(3) 176.10(13) C(2)–Fe(1)–N(5) 94.96(14) N(4)–Fe(1)–N(6) 95.29(12) C(1)–Fe(1)–N(4) 94.99(14) C(2)–Fe(1)–N(6) 175.64(13) N(5)–Fe(1)–N(6) 80.71(13) C(1)–Fe(1)–N(5) 91.16(13) N(3)–Fe(1)–N(4) 81.13(13) 3. RESULTS AND DISCUSSION
3.1 Molecular structure of compound 1
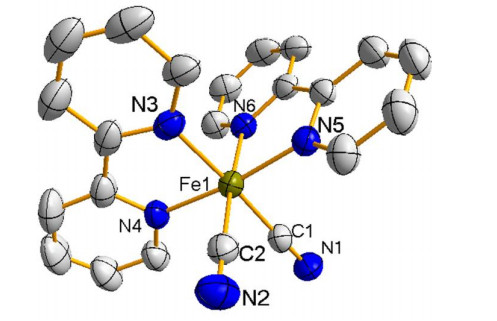
The crystal structure of compound 1 was determined by single-crystal X-ray diffraction. Selected important bond lengths and bond angles of 1 are collected in Table 1, and the representative structural diagram is shown in Figs. 1 and 2. The crystal of 1 belongs to the monoclinic system, space group P21/n, with a = 11.209(6), b = 15.981(8), c =13.699(8) Å, β = 105.687(9)º, C23H22Cl2FeN6O2, Mr = 541.18, V = 2362(2) Å3, Dc = 1.510 g/cm3, Z = 4, F(000) = 1096, μ = 0.898 mm-1, R = 0.0751 and wR = 0.2224 for 4121 observed reflections (I > 2σ(I)). 1 contains one cis-Fe(bpy)2(CN)2, two uncoordinated water and one dichloromethane solvent molecules. As shown in Fig. 1, cis-Fe(bpy)2(CN)2 adopts a distorted [FeC2N4] octahedral coordination, in which four coordination sites around the Fe metal center are occupied by four nitrogen atoms from two bpy ligands and the other two sites are located by two carbon atoms from the cyanide bridges in a cis-position.
Figure 1
 Figure 1. ORTEP view of the heteronuclear complex 1 with atom-numbering scheme at the 50% probability level. Hydrogen atoms and solvent molecules are omitted for clarity
Figure 2
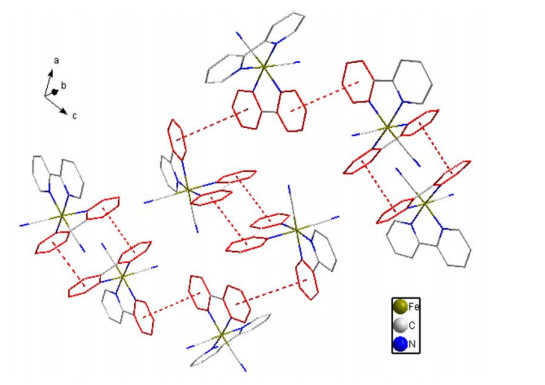
 Figure 2. One-dimensional zigzag of complex 1 by intermolecular interaction
The bond lengths of Fe(1)–N(4) (1.971(3) Å) and Fe(1)–N(5) (1.964(3) Å) are shorter than those of Fe(1)–N(3) (2.010(3)) Å) and Fe(1)–N(6) (1.999(3) Å) in 1 owing to the structural trans-effect[17]. The Fe–C bonds are 1.921(4) and 1.931(4) Å, and C≡N are 1.155(5) and 1.139(5) Å, respectively. The bond angle of C(1)–Fe(1)–C(2) is 89.49(15)o, and N(1)≡C(1)–Fe(1) are 177.2(3)o and 179.8(4)o. These data are very close to cis-Fe(bpy)2(CN)2 in literature[18, 19].
Moreover, the distances of bpy groups between two chains are considerably short. The two paralle bpy groups took an offset face-to-face formation and vertical separation of the aromatic rings in 1 was approximately 3.43 Å, which was in accordance with the common stacking distance of about 3.4 to 3.6 Å[20, 21], suggesting the existence of π-π interactions.
3.2 IR spectroscopy
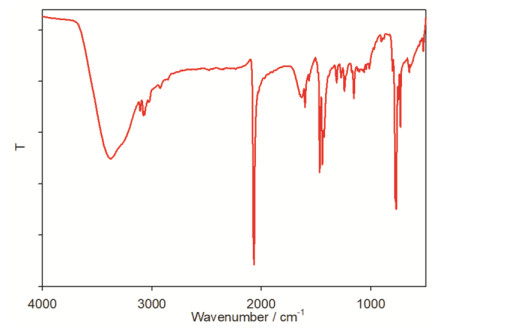
IR spectra of complex 1 are presented in Fig. 3, and the IR data for 1 are listed in the Experimental Section. Infrared spectra of complex 1 present characteristic bands due to the bpy ligand vibrations. Peaks at 3378 cm-1 can be assigned to the O–H stretching vibration of water, and those at 3107, 3077, 3064, 3027 and 3019 cm-1 to the aromatic ring C–H stretching vibrations. Peaks at 2079 and 2069 cm-1 result from the cyanide C≡N stretching vibrations, which are the combination of symmetric and asymmetric stretching frequencies in cis-complex. Peaks at 1634, 1602, 1568, 1486, 1468, 1445 and 1428 cm-1 are caused by the aromatic ring skeleton vibration, while those at 803, 777, 769, 748, 733 and 649 cm-1 correspond to the aromatic ring C–H deformation vibrations.
Figure 3
 Figure 3. IR spectra of complex 1 at room temperature (KBr pellet)
3.3 Electrochemistry
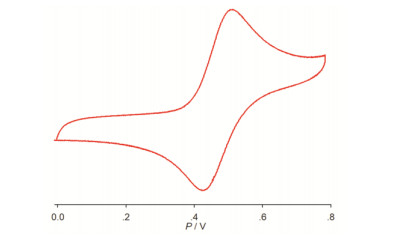
Cyclic voltammetry study was carried out on 1 to determine its redox properties, as well as to establish whether it was stable and potentially separated. Complex 1 was subjected to cyclic voltammetry in acetonitrile solution, with the cyclic voltammogram shown in Fig. 4, which shows a reversible (ΔEp = 60~80 mV) redox process at +0.46 V assigned to the cis-FeⅡ/Ⅲ(bpy)2(CN)2 process. This potential is close to that of the mononuclear compound cis-Fe(bpy)2(CN)2[22].
Figure 4
 Figure 4. Cyclic voltammogram of complex 1 in CH3CN containing 0.1 M (Bu4N)(PF6) electrolyte
3.4 Electronic absorption spectroscopy
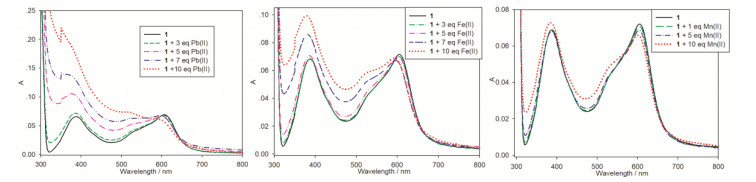
In order to investigate the interaction of selected metal ions with complex 1, the electronic absorption spectroscopy of 1 upon adding metal ions was measured in CH3CN solution at room temperature. Complex 1 exhibits maximum absorption wavelengths λmax at 196, 246, 295, 388 and 606 nm (Fig. 5). The bands of λmax at 196, 246 and 295 nm can be ascribed to π → π* transition, and those at 388 and 606 nm can be attributed to the FeⅡ → bpy metal-to-ligand charge transfer (MLCT). These absorption bands are of characteristic features of cis-Fe(bpy)2(CN)2[23-25].
Figure 5
 Figure 5. Spectral variation of complex 1 in an acetonitrile solution (1.0 × 10⁻⁵ mol·L-1) upon the addition of Pb(Ⅱ) ion (left), Fe(Ⅱ) ion (middle) and Mn(Ⅱ) ion (right)
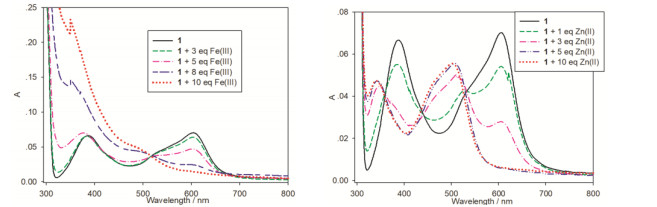
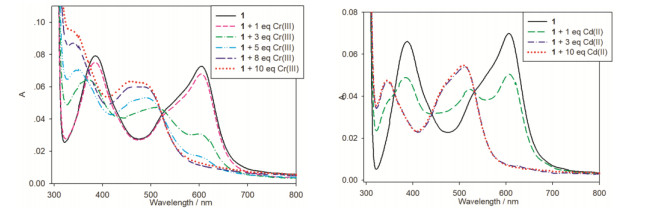
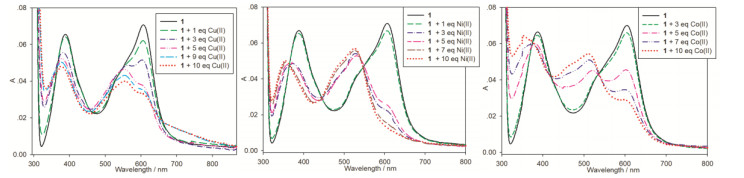
The interactions of complex 1 with selected metal ions, such as Cu(Ⅱ), Fe(Ⅲ), Pb(Ⅱ), Fe(Ⅱ), Cr(Ⅲ), Cd(Ⅱ), Co(Ⅱ), Zn(Ⅱ), Ni(Ⅱ) and Mn(Ⅱ), were investigated employing electronic absorption spectroscopy, as shown in Figs. 5~8. Upon the addition of these metal ions investigated, two distinct categories of responses were observed. The electronic absorption spectroscopy of Pb(Ⅱ), Fe(Ⅱ) and Mn(Ⅱ) exhibited hardly any spectral variations, while that of Cu(Ⅱ), Fe(Ⅲ), Cr(Ⅲ), Cd(Ⅱ), Co(Ⅱ), Zn(Ⅱ) and Ni(Ⅱ) ions fell into the other category. Owing to the similar result, here only the interaction of Zn(Ⅱ) with complex 1 was described. Upon adding the Zn(Ⅱ) ion into 1, the absorbance of bands at λmax of 339 and 500 nm increase, companied with the bands at λmax of 388 and 606 nm that have disappeared. Clean isosbestic points were observed at 362, 436 and 527 nm. These data demonstrate steady coordination between the metal ion Zn(Ⅱ) and complex 1 via cyanide[26, 27]. Similar pheonomena can be found in Cu(Ⅱ), Fe(Ⅲ), Cr(Ⅲ), Cd(Ⅱ), Co(Ⅱ) and Ni(Ⅱ) ions.
Figure 6
 Figure 6. Spectral variation of complex 1 in an acetonitrile solution (1.0 × 10⁻⁵ mol·L-1) upon the addition of Fe(Ⅲ) (left) and Zn(Ⅱ) (right) ions
Figure 7
 Figure 7. Spectral variation of complex 1 in an acetonitrile solution (1.0 × 10⁻⁵ mol·L-1) upon adding Cr(Ⅲ (left) and Cd(Ⅱ) (right) ions
Figure 8
 Figure 8. Spectral variation of complex 1 in an acetonitrile solution (1.0 × 10⁻⁵ mo·L-1) upon the addition of Cu(Ⅱ) (left), Ni(Ⅱ) (middle) and Co(Ⅱ) (right) ions
3.5 Fluorescence spectroscopy
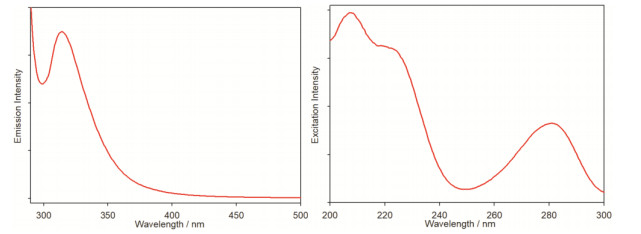
To investigate the selectivity of complex 1 to the selected metal ions, the fluorescence emission spectroscopy of 1 and such ions was measured upon excitation at 279 nm. A strong fluorescent emission peak appears at 310 nm in acetonitrile solution at room temperature with concentration of 1.0 × 10⁻⁵ mol·dm-3 under 279 nm excitation, which can be assigned to the Fe(dπ) → bpy(π*) MLCT; while peaks at 208, 223 and 279 nm are found upon emission at 310 nm, and there is a peak at 310 nm under 279 nm excitation (Fig. 9).
Figure 9
 Figure 9. Fluorescence emission spectra (left) and excitation spectra (right) of complex 1 (1.0 × 10⁻⁵ mol·L-1) in an acetonitrile solution (λex = 279 nm, λem = 310 nm)
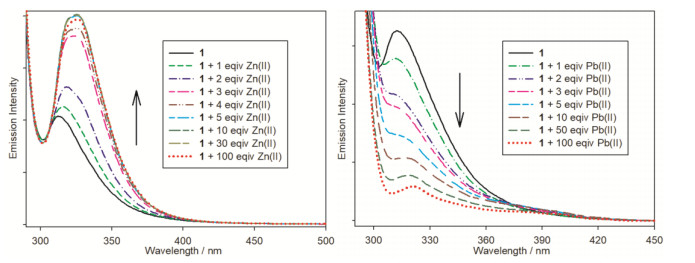
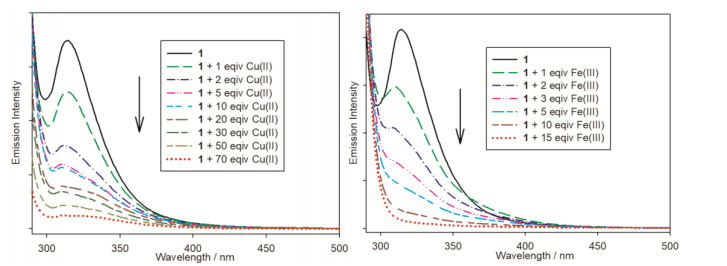
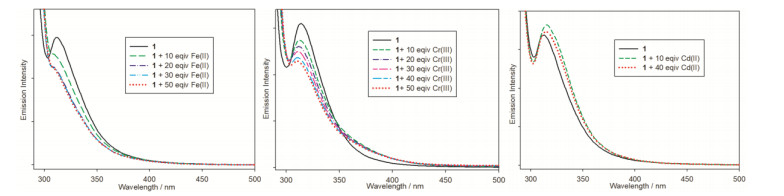
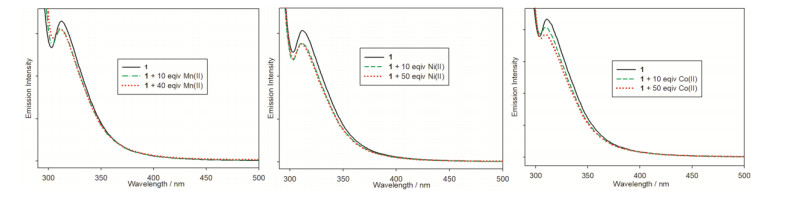
Upon addition of selected metal ions investigated, three distinct categories of responses were observed in the emission spectra of complex 1. For Zn(Ⅱ) ion, the emission intensity of 1 increased upon the addition of metal ion with excitation at 279 nm (Fig. 10). The strong fluorescence enhancement may be attributed to the fact that Zn(Ⅱ) has d10 electronic structure characteristics. When the electron pair of N atom is bound by the coordination of Zn(Ⅱ), the electron transfer from Fe(Ⅱ) to Zn(Ⅱ) via cyanide is blocked and the fluorescence is switched on, leading to a significant fluorescence emission enhancement. For Cu(Ⅱ), Fe(Ⅲ) and Pb(Ⅱ) ions, adding metal ion weakened steadily the emission intensity of 1 and resulted in completely quenching under 279 nm excitation. The weakening of fluorescence can be assigned to the energy transfer from complex 1 to the metal ion after the coordination of cyanide to metal ion, resulting in fluorescence quenching. For Fe(Ⅱ), Cr(Ⅲ), Cd(Ⅱ), Co(Ⅱ), Ni(Ⅱ) and Mn(Ⅱ) ions, the emission intensity of 1 was almost unchanged upon the addition of metal ion (Figs. 10~13).
Figure 10
 Figure 10. Fluorescence emission spectra of complex 1 (1.0 × 10⁻⁵ mol·L-1) in an acetonitrile solution upon the addition of Zn(Ⅱ) (left) and Pb(Ⅱ) (right) ions
Figure 11
 Figure 11. Fluorescence emission spectra of complex 1 (1.0 × 10⁻⁵ mol·L-1) in anacetonitrile solution upon the addition of Cu(Ⅱ) (left) and Fe(Ⅲ) (right) ions
Figure 12
 Figure 12. Fluorescence emission spectra of complex 1 (1.0 × 10⁻⁵ mol·L-1) in an acetonitrile solution upon the addition of Fe(Ⅱ) (left), Cr(Ⅲ) (middle) and Cd(Ⅱ) (right) ions
Figure 13
 Figure 13. Fluorescence emission spectra of complex 1 (1.0 × 10⁻⁵ mol·L-1) in an acetonitrile solution upon the addition of Mn(Ⅱ) (left), Ni(Ⅱ) (middle) and Co(Ⅱ) (right) ions
4. CONCLUSION
In conclusion, complex 1 was synthesized and well characterized by IR, electronic absorption spectra, elemental analysis, electrochemistry and single-crystal X-ray diffraction analysis. Electronic absorption spectroscopic investigations revealed that metal ions Cu(Ⅱ), Fe(Ⅲ), Cr(Ⅲ), Cd(Ⅱ), Co(Ⅱ), Zn(Ⅱ) and Ni(Ⅱ) steady coordinate with complex 1 via cyanide. Complex 1 has an excellent selectivity for Zn(Ⅱ) ion by fluorescent enhancement, while by decreased fluorescence for Cu(Ⅱ), Fe(Ⅲ) and Pb(Ⅱ) ions.
-
-
[1]
Das, S.; Rissanen, K.; Sahoo, P. Rare crystal structure of open spirolactam ring along with the closed-ring form of a rhodamine derivative: sensing of Cu2+ ions from spinach. ACS Omega 2019, 4, 5270–5274. doi: 10.1021/acsomega.9b00053
-
[2]
Zhang, C.; Yan, Y.; Pan, Q.; Sun, L.; He, H.; Liu, Y.; Liang, Z.; Li, J. A microporous lanthanum metal-organic framework as a bi-functional chemosensor for the detection of picric acid and Fe3+ ions. Dalton Trans. 2015, 44, 13340–13346. doi: 10.1039/C5DT01065A
-
[3]
Gaggelli, E.; Kozlowski, H.; Valensin, D.; Valensin, G. Copper homeostasis and neurodegenerative disorders (Alzheimer's, Prion, and Parkinson's diseases and amyotrophic lateral sclerosis). Chem. Rev. 2006, 106, 1995–2044. doi: 10.1021/cr040410w
-
[4]
Shabani, A. M. H.; Dadfarnia, S.; Dehghani, Z. On-line solid phase extraction system using 1,10-phenanthroline immobilized on surfactant coated alumina for the flame atomic absorption spectrometric determination of copper and cadmium. Talanta 2009, 79, 1066–1070. doi: 10.1016/j.talanta.2009.02.008
-
[5]
Zhang, J. F.; Zhou, Y.; Yoon, J.; Kim, J. S. Recent progress in fluorescent and colorimetric chemosensors for detection of precious metal ions (silver, gold and platinum ions). Chem. Soc. Rev. 2011, 40, 3416–3429. doi: 10.1039/c1cs15028f
-
[6]
Si, H.; Sheng, R.; Li, Q.; Feng, J.; Li, L.; Tang, B. Highly sensitive fluorescence imaging of Zn2+ and Cu2+ in living cells with signal amplification based on functional DNA self-assembly. Anal. Chem. 2018, 90, 8785–8792. doi: 10.1021/acs.analchem.7b05268
-
[7]
Gabr, M. T.; Pigge, F. C. A fluorescent turn-on probe for cyanide anion detection based on an AIE active cobalt(Ⅱ) complex. Dalton Trans. 2018, 47, 2079–2085. doi: 10.1039/C7DT04242F
-
[8]
Zhu, X. D.; Zhang, K.; Wang, Y.; Long, W. W.; Sa, R. J.; Liu, T. F.; Lü, J. Fluorescent metal-organic framework (MOF) as a highly sensitive and quickly responsive chemical sensor for the detection of antibiotics in simulated wastewater. Inorg. Chem. 2018, 57, 1060–1065. doi: 10.1021/acs.inorgchem.7b02471
-
[9]
Griesbeck, S.; Michail, E.; Wang, C.; Ogasawara, H.; Lorenzen, S.; Gerstner, L.; Zang, T.; Nitsch, J.; Sato, Y.; Bertermann, R.; Taki, M.; Lambert, C.; Yamaguchi, S.; Marder, T. B. Tuning the π-bridge of quadrupolar triarylborane chromophores for one- and two-photon excited fluorescence imaging of lysosomes in live cells. Chem. Sci. 2019, 10, 5405–5422 doi: 10.1039/C9SC00793H
-
[10]
Bhalla, V.; Tejpal, R.; Kumar, M.; Puri, R. K.; Mahajan, R. K. Terphenyl based 'turn on΄fluorescent sensor for mercury. Tetra. Lett. 2009, 50, 2649–2652. doi: 10.1016/j.tetlet.2009.03.110
-
[11]
Chorazy, S.; Wang, J.; Ohkoshi, S. I. Yellow to greenish-blue colour-tunable photoluminescence and 4f-centered slow magnetic relaxation in a cyanido-bridged DyⅢ(4-hydroxypyridine)-CoⅢ layered material. Chem. Commun. 2016, 52, 10795–10798. doi: 10.1039/C6CC05337H
-
[12]
Barthelmes, K.; Jäger, M.; Kübel, J.; Friebe, C.; Winter, A.; Wächtler, M.; Dietzek, B.; Schubert, U. S. Efficient energy transfer and metal coupling in cyanide-bridged heterodinuclear complexes based on (bipyridine)(terpyridine)ruthenium(Ⅱ) and (phenylpyridine)iridium(Ⅲ) complexes. Inorg. Chem. 2016, 55, 5152–5167. doi: 10.1021/acs.inorgchem.5b02919
-
[13]
Büldt, L. A.; Guo, X.; Vogel, R.; Prescimone, A.; Wenger, O. S. A tris(diisocyanide)chromium(0) complex is a luminescent analog of [Fe(2, 2΄-bipyridine)3]2+. J. Am. Chem. Soc. 2017, 139, 985–992. doi: 10.1021/jacs.6b11803
-
[14]
Comte, V.; Vahrenkamp, H. Cyanide bridged oligonuclear complexes containing CuCl and CuCl2. J. Organomet. Chem. 2001, 627, 153–158. doi: 10.1016/S0022-328X(01)00739-2
-
[15]
Qin, Z. T.; Sheng, T. L.; Hu, S. M.; Xiang, S. C.; Fu, R. B.; Wang, X.; Shen, C. J.; Wu, X. T. Design, synthesis and crystal structure of two one-dimensional zigzag chain-like compounds. Chin. J. Struc. Chem. 2008, 27, 1013–1019.
-
[16]
Sheldrick, G. M. Program for X-ray Crystal Structure Refinement. University of Göttingen: Germany 2016.
-
[17]
Anderson, K. M.; Orpen, A. G. On the relative magnitudes of cis and trans influences in metal complexes. Chem. Commun. 2001, 2682–2683.
-
[18]
Ma, B. Q.; Sun, H. L.; Gao, S. Vertex-sharing water tape consisting of cyclic hexamers. Eur. J. Inorg. Chem. 2005, 2005, 3902–3906. doi: 10.1002/ejic.200500374
-
[19]
Wang, Y.; Ma, X.; Hu, S. M.; Wen, Y. H.; Xue, Z. Z.; Zhu, X. Q.; Zhang, X. D.; Sheng, T. L.; Wu, X. T. Syntheses, crystal structures, MMCT and magnetic properties of four one-dimensional cyanide-bridged complexes comprised of MⅡ-CN-FeⅢ (M = Fe, Ru, Os). Dalton Trans. 2014, 43, 17453–17462. doi: 10.1039/C4DT02272F
-
[20]
Hunter, C. A.; Sanders, J. K. M. The nature of. π-π interactions. J. Am. Chem. Soc. 1990, 112, 5525–5534. doi: 10.1021/ja00170a016
-
[21]
Główka, M. L.; Martynowski, D.; Kozłowska, K. Stacking of six-membered aromatic rings in crystals. J. Mol. Struct. 1999, 474, 81–89. doi: 10.1016/S0022-2860(98)00562-6
-
[22]
Wang, Y.; Ma, X.; Hu, S. M.; Xue, Z. Z.; Wen, Y. H.; Sheng, T. L.; Wu, X. T. Syntheses, crystal structures, spectroscopy, electrochemical and magnetic properties of four cyanido-bridged MⅡ–MnⅢ (M = Fe, Ru, Os) complexes. J. Coord. Chem. 2015, 68, 55–70. doi: 10.1080/00958972.2014.981537
-
[23]
Bryant, G.; Fergusson, J.; Powell, H. Charge-transfer and intraligand electronic spectra of bipyridyl complexes of iron, ruthenium, and osmium. I. Bivalent complexes. Aust. J. Chem. 1971, 24, 257–273. doi: 10.1071/CH9710257
-
[24]
Schilte, A. A. Proton affinities of some cyanide and aromatic diimine complexes of iron, ruthenium and osmium. J. Am. Chem. Soc. 1963, 85, 904–908. doi: 10.1021/ja00890a016
-
[25]
Schilt, A. A. Unusual proton affinities of some mixed ligand iron(Ⅱ) complexes. J. Am. Chem. Soc. 1960, 82, 5779–5783. doi: 10.1021/ja01507a004
-
[26]
Qiao, N.; Wei, N. N.; Zhang, J. N.; Hao, C. The dual-luminescence mechanism of the ESIPT chemosensor tetrasubstituted imidazole core compound: a TDDFT study. New J. Chem. 2018, 42, 11804–11810. doi: 10.1039/C8NJ01162A
-
[27]
Ernsting, N. P.; Breffke, J.; Vorobyev, D. Y.; Duncan, D. A.; Pfeffer, I. Sub-picosecond. fluorescence evolution of amino-cyano-stilbenes in methanol: polar solvation obeys continuum theory without evidence of twisting. Phys. Chem. Chem. Phys. 2008, 10, 2043–2049. doi: 10.1039/b717541h
-
[1]
-
Figure 1 ORTEP view of the heteronuclear complex 1 with atom-numbering scheme at the 50% probability level. Hydrogen atoms and solvent molecules are omitted for clarity
Figure 4 Cyclic voltammogram of complex 1 in CH3CN containing 0.1 M (Bu4N)(PF6) electrolyte
Figure 5 Spectral variation of complex 1 in an acetonitrile solution (1.0 × 10⁻⁵ mol·L-1) upon the addition of Pb(Ⅱ) ion (left), Fe(Ⅱ) ion (middle) and Mn(Ⅱ) ion (right)
Figure 6 Spectral variation of complex 1 in an acetonitrile solution (1.0 × 10⁻⁵ mol·L-1) upon the addition of Fe(Ⅲ) (left) and Zn(Ⅱ) (right) ions
Figure 7 Spectral variation of complex 1 in an acetonitrile solution (1.0 × 10⁻⁵ mol·L-1) upon adding Cr(Ⅲ (left) and Cd(Ⅱ) (right) ions
Figure 8 Spectral variation of complex 1 in an acetonitrile solution (1.0 × 10⁻⁵ mo·L-1) upon the addition of Cu(Ⅱ) (left), Ni(Ⅱ) (middle) and Co(Ⅱ) (right) ions
Figure 9 Fluorescence emission spectra (left) and excitation spectra (right) of complex 1 (1.0 × 10⁻⁵ mol·L-1) in an acetonitrile solution (λex = 279 nm, λem = 310 nm)
Figure 10 Fluorescence emission spectra of complex 1 (1.0 × 10⁻⁵ mol·L-1) in an acetonitrile solution upon the addition of Zn(Ⅱ) (left) and Pb(Ⅱ) (right) ions
Figure 11 Fluorescence emission spectra of complex 1 (1.0 × 10⁻⁵ mol·L-1) in anacetonitrile solution upon the addition of Cu(Ⅱ) (left) and Fe(Ⅲ) (right) ions
Figure 12 Fluorescence emission spectra of complex 1 (1.0 × 10⁻⁵ mol·L-1) in an acetonitrile solution upon the addition of Fe(Ⅱ) (left), Cr(Ⅲ) (middle) and Cd(Ⅱ) (right) ions
Figure 13 Fluorescence emission spectra of complex 1 (1.0 × 10⁻⁵ mol·L-1) in an acetonitrile solution upon the addition of Mn(Ⅱ) (left), Ni(Ⅱ) (middle) and Co(Ⅱ) (right) ions
Table 1. Selected Bond Lengths (Å) and Bond Angles (°) for Complex 1
Bond Dist. Bond Dist. Bond Dist. Fe(1)–C(1) 1.921(4) C(2)≡N(2) 1.139(5) Fe(1)–N(5) 1.964(3) Fe(1)–C(2) 1.931(4) Fe(1)–N(3) 2.010(3) Fe(1)–N(6) 1.999(3) C(1)≡N(1) 1.155(5) Fe(1)–N(4) 1.971(3) Angle (°) Angle (°) Angle (°) C(1)–Fe(1)–C(2) 89.49(15) C(1)–Fe(1)–N(6) 90.02(14) N(3)–Fe(1)–N(5) 92.68(13) N(1)≡C(1)–Fe(1) 177.2(3) C(2)–Fe(1)–N(3) 90.84(14) N(3)–Fe(1)–N(6) 89.94(12) N(2)≡C(2)–Fe(1) 179.8(4) C(2)–Fe(1)–N(4) 89.08(14) N(4)–Fe(1)–N(5) 172.68(12) C(1)–Fe(1)–N(3) 176.10(13) C(2)–Fe(1)–N(5) 94.96(14) N(4)–Fe(1)–N(6) 95.29(12) C(1)–Fe(1)–N(4) 94.99(14) C(2)–Fe(1)–N(6) 175.64(13) N(5)–Fe(1)–N(6) 80.71(13) C(1)–Fe(1)–N(5) 91.16(13) N(3)–Fe(1)–N(4) 81.13(13)  下载: 导出CSV
-


 扫一扫看文章
计量
- PDF下载量: 3
- 文章访问数: 821
- HTML全文浏览量: 16
 下载:
下载:
