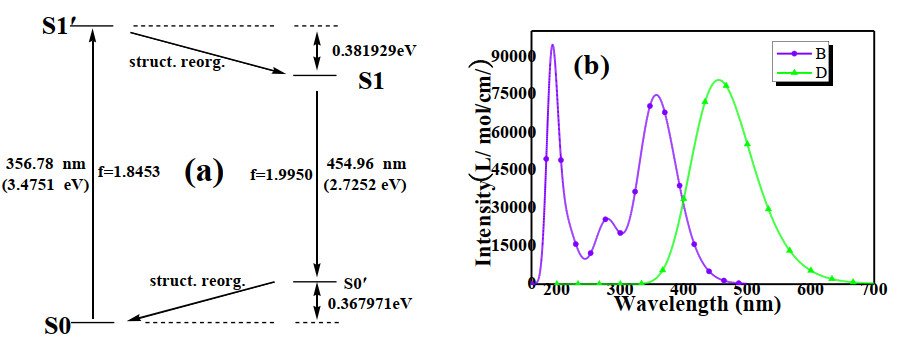
Figure 1.
(a) Energy variation and oscillator strength for excitation, structure reorganization (struct. reorg.) and deexcitation. (b) Computational results of OPA and OPEF
Structure, Calculation, Optical Properties and Bioimaging of an Organic Fluorescence Compound
Feng JIN , Qi-Juan XIONG , Zhuo-Ni LIU , Ya-Ting XIAO , Fang YANG , Ting-Ting CHENG , Lin ZHANG , Dong-Liang TAO , Rong-Bao LIAO , Yong LIU

Organic fluorescence materials have attracted significant interest because of their potential applications as optical materials in several areas, such as fluorescence imaging, fluorescent detection probe, and so on[1-7]. As is wellknown, molecule with delocalized π-electron system containing strong electron donor and acceptor usually has excellent optical property because of the certain electron transition or transfer in the molecule[8-10]. In order to exploit strong organic fluorescence materials, suitable structural organic molecules with conjugated system should be designed and synthesized. So far, many organic molecules with such structures and excellent optical properties have been developed[11-14].
In previous work, we have studied an organic material, which possesses excellent optical property[15]. As series of works, in this article, we continue to explore the properties of such kind of compounds by exchanging the different electron acceptors. Ultraviolet-visible absorption spectra and fluorescence of the compound were studied in detail through theoretical calculation and experiment. Furthermore, potential biological application of it was also carried out.
All computational results were obtained by Gaussian 16 software package[16] with the presence of dichloromethane (DCM) based on polarizable continuum model (PCM)[17-19]. The ground state optimization and computation were performed at CAM-B3LYP/6-311G* level, and the excitation process was performed by time-dependent method at the same level. The optimized ground state S0 and the first excited state S1 were further confirmed by frequency calculation based on the optimized geometry.
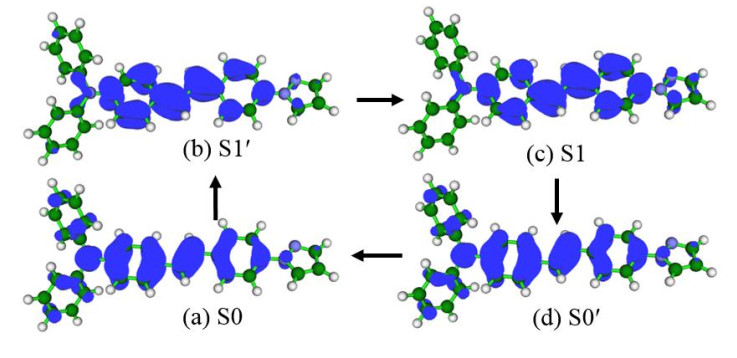
The excitation and de-excitation mechanism are displayed in Fig. 1, and the electron transition process is presented in Fig. 2 by hole-electron method[20]. S0′ is the excited electronic state under the optimized geometry of S0, while S1′ is the ground electronic state under the optimized geometry of S1.
The optimized geometries of S0 and S1 are presented in Tables 1 and 2, respectively. The dihedral angles of R1-R2 and R2-R3 indicate that S1 has more delocalized properties than S0. In addition, the single C(7)−C(10) bonds on S0 and S1 are 1.466 and 1.404 Å, respectively, and C(10)−C(11) double bonds are 1.337 and 1.407 Å, respectively. The equalization effect of the bond length for single and double bonds also verify the better delocalization of S1 than S0.
 DownLoad:
CSV
DownLoad:
CSV
| Bond | Dist. | Bond | Dist. | Dihedral angle | (°) | ||
| N(1)−C(4) | 1.417 | N(3)−C(15) | 1.410 | R1-R2 | 25.18 | ||
| C(7)−C(10) | 1.466 | N(3)−C(16) | 1.418 | R2-R3 | 19.67 | ||
| C(10)−C(11) | 1.337 | N(3)−C(22) | 1.419 | R3-R4 | 67.95 | ||
| C(11)−C(12) | 1.465 | N(1)−N(2) | 1.348 | R4-R5 | 73.06 |
DownLoad:
CSV
| Bond | Dist. | Bond | Dist. | Dihedral angle | (°) | ||
| N(1)−C(4) | 1.407 | N(3)−C(15) | 1.387 | R1-R2 | 15.47 | ||
| C(7)−C(10) | 1.404 | N(3)−C(16) | 1.420 | R2-R3 | 1.47 | ||
| C(10)−C(11) | 1.407 | N(3)−C(22) | 1.419 | R3-R4 | 65.64 | ||
| C(11)−C(12) | 1.397 | N(1)−N(2) | 1.352 | R4-R5 | 73.46 |
The OPA peak of S0→S1′ locates at 356.78 nm, while the peak of the OPA curve locates at 356.57 nm. The slight difference 0.21 nm originates from the effect of other electronic-transition, such as S0 → S2′ and so on. The OPEF peak locates at 454.92 nm. Then the Stokes shift on computation is 98 nm, in good agreement with the experimental value of 99 nm. Furthermore, both OPA and OPEF curves in Fig. 1(b) are in good accordance with the experimental results in dichloromethane solvent (Fig. 4). During excitation, the electron translates from S0 (Fig. 2(a)) to S1′ (Fig. 2(b)). Then there is structure reorganization under the excited electronic state, and the geometry of S0 will proceed to S1. Due to the rigidity of the S1 geometry, some excited molecules can de-excite back to ground S0′ by means of fluorescence emission. The S0′ possesses the same geometry as S1, and will return to the optimized S0 geometry through structure reorganization under the ground electronic state. Evidently, it is very hard to find any appreciable difference between Fig. 2(b) and Fig. 2(c) because of the slight structure reorganization under the excited electronic state from S1′ to S1. Owing to the slight structure reorganization, the energy difference between S1′ and S1 is also not very significant, and the value is 0.382 eV as illustrated in Fig. 1(a). Generally, it is natural that the smaller the energy change of structure reorganization from S1′ to S1, the greater the fluorescence intensity. The structure reorganization energy from S0′ to S0 has nothing to do with the intensity of fluorescence emission, although it's a small value either. However, the S0′→S0 energy variation is related to the fluorescence wavelength.
The used commercially available chemicals are analytical grade. The solutions used in optical test are chromatogramphically pure. The intermediates 4-((iodotriphenylphospho-ranyl)methyl)-N, N-diphenylaniline and 4-(1H-pyrazole-1-yl)benzaldehyde were prepared according to the literatures[21, 22].
IR spectra, mass spectrum and NMR spectra were measured with nicolet FT-IR NEXUS 870 spectrometer, Bruker Autoflex III smart beam mass spectrometer and Bruker AV 400 spectrometer, respectively. UV-Vis absorption spectra and fluorescence (OPEF) spectra in dichloromethane (DCM), ethyl acetate (EA), ethonal (EtOH) and dimethyl sulfoxide (DMSO) were measured with TU-1901 spectrophotometer and Hitachi F-7000 fluorescence spectrophotometer, respectively. The concentration is 1.0 × 10⁻⁵ mol·L-1. The pass widths of excitation and emission are 2.5 nm. Two-photon excited fluorescence (TPEF) was obtained at femtosecond laser pulse and Ti: sapphire system (680~1080 nm, 80 MHz, 140 fs) as the light source. The compound was dissolved in DMSO at concentration of 1.0 × 10⁻³ mol·L-1.
The diffraction data were collected at 298 K on a Bruker SMART CCD diffractometer with graphite-monochromated MoKα radiation (λ = 0.71073 Å). A total of 8976 reflections were collected in the range of 2.09 < θ < 27.80° by using an ω scan mode, of which 4849 were unique with Rint = 0.0569, and 6328 observed reflections with I > 2σ(I) were used in the succeeding structure calculations. The intensity data were corrected for Lorentz-polarization factors, and empirical absorption correction was applied. The structure was solved by direct methods and difference Fourier syntheses. The non-hydrogen atoms were refined anisotropically, and hydrogen atoms were introduced geometrically. The final refinement of full-matrix least-squares for 6328 unique reflections with I > 2σ(I) was converged to R = 0.0569, wR = 0.1700 (w = 1/[σ2(Fo2) + (0.0827P)2], where P = (Fo2 + 2Fc2)/3), S = 1.023 and (Δ/σ)max = 0.001. All calculations were performed with SHELXL-2014/7 package[23].
NIH/3T3 cells were seeded in 6-well culture plates at density of 2 × 10⁵ cells per well in cell-culture media (10% fetal calf serum (FCS), 90% dulbecco's modified eagle medium (DMEM)) and grown for 95 hours. The material was dissolved in DMSO (1.0 × 10⁻³ mol·L-1) and diluted with cell-culture media to the concentration of 20 μL/mL. The cells were incubated with the solution and kept at 37 ℃ for 30 min (5% CO2 and 95% air). And then, before use, the cells were washed for 3 times with cell-culture media. NIH/3T3 cells were imaged with TCS-SP5 II, Leica confocal laser scanning microscope using magnification 40 × for monolayer cultures.
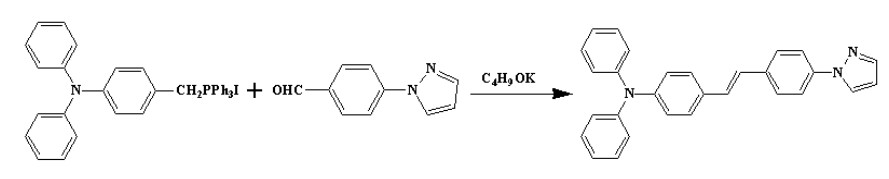
4-((Iodotriphenylphosphoranyl)methyl)-N, N-diphenylaniline (6.47 g, 10 mmol), 4-(1H-pyrazole-1-yl)benzaldehyde (172 g, 10 mmol) and t-BuOK (5.60 g, 50 mmol) were introduced in a mortar. They were ground for about 10 min. The mixture became sticky, and then it was ground for another 10 min. The reaction was monitored by Thin Layer Chromatography. When the reaction finished, the mixture was poured into distilled water (500 mL). The product was extracted with dichloromethane. The organic layer was dried with anhydrous MgSO4. After that, dichloromethane was removed with evaporator. The crude product was obtained. It was purified by recrystallization from methanol. Yield: 3.57 g (81%). Anal. Calcd. (%) for C29H23N3: C, 84.23; H, 5.61; N, 10.16. Found (%): C, 84.16; H, 5.46; N, 10.31. FT-IR (KBr, cm-1): 3126, 1589, 1493, 1400, 1334, 1288, 1174, 970, 826, 750, 696, 621, 538, 500. 1H NMR (DMSO-D6, 400 MHz): δ (ppm) 6.55 (t, J = 2 Hz, 1H), 6.97 (d, J = 8.8 Hz, 2H), 7.07~7.03 (m, 6H), 7.17 (s, 1H), 7.22 (s, 1H), 7.32 (t, J = 14 Hz, 4H), 7.52 (d, J = 8.8 Hz, 2H), 7.69 (d, J = 8.4 Hz, 2H), 7.76 (s, 1H), 7.85 (d, J = 8.8 Hz, 2H), 8.53 (d, J = 2.4 Hz, 1H). 13C NMR (100 MHz, DMSO-D6: δ (ppm) 108.4, 1118.9, 123.4, 123.7, 124.6, 126.3, 127.2, 128.1, 128.4, 130.0, 131.7, 135.7, 139.0, 141.4, 147.2, 147.4. MS (ESI) (m/z): Calcd. for C29H23N3: 414.19 [MH]+; Found: 414.16[MH]+.
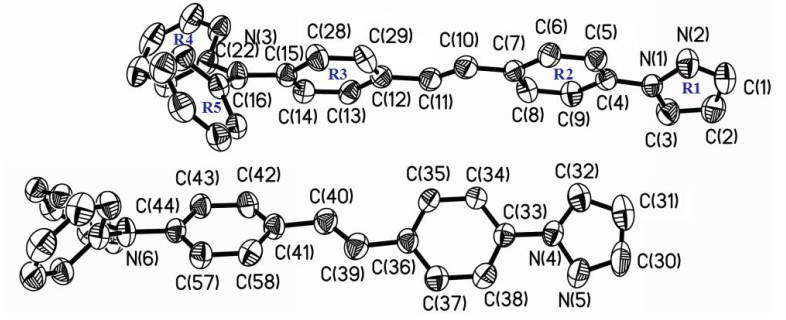
The single-crystal X-ray diffraction analysis reveals that the compound crystallizes in monoclinic system, space group P21. In the molecular structure of the compound, there are two crystallographically and conformationally independent molecules, as shown in Fig. 3. An inspection of the crystal structure reveals that the two unique molecules differ in the conformation of the molecular backbone. In one molecule, atoms of C(4)~C(15), C(28) and C(29) define a plane (plane equation: –5.450x + 7.078y – 4.261z = –0.4384), with the largest atom deviation of 0.0439 Å. In the other molecule, atoms C(33)~C(44), C(57) and C(58) define a plane (plane equation: 5.391x + 7.265y + 2.424z = 9.2945, with the largest atom deviation of 0.2103 Å. Least-squares plane calculation shows that the dihedral angles between the phenyl rings are 5.2° (rings C(4)~C(9) and C(12)~C(15), C(28), C(29)) and 34.4° (rings C(33)~C(38) and C(41)~C(44), C(57), C(58)). From the bond lengths (Table 3), we can see that the bond distances of C−C and N−C are almost shorter than the normal single bond and longer than the normal double bond (the normal C−N single bond (1.47 Å), C=N double bond (1.33 Å), C=C double bond (1.34 Å), C−C single bond (1.54 Å)[24]). The facts indicate that there exists extensive electron delocalization in the molecule, which should facilitate excellent optical properties.
 DownLoad:
CSV
DownLoad:
CSV
| Bond | Dist. | Bond | Dist. | Bond | Dist. | ||
| N(1)−C(4) | 1.416(4) | C(11)−C(12) | 1.497(6) | N(3)−C(22) | 1.409(5) | ||
| C(7)−C(10) | 1.472(6) | N(3)−C(15) | 1.431(5) | N(4)−C(33) | 1.417(5) | ||
| C(10)−C(11) | 1.287(6) | N(3)−C(16) | 1.417(5) | C(36)−C(39) | 1.477(6) | ||
| C(40)−C(39) | 1.268(6) | C(41)−C(40) | 1.490(6) | N(6)− C(44) | 1.415(5) |
Ultraviolet-visible absorption spectra of the compound are shown in Fig. 4(a). It has two distinct absorption bands in all solvents. The absorption bands in the high energy regions are assigned to the π-π* transition of triphenylamine, and those at longer wavelengths originate from intramolecular charge transfer (ICT) of the whole conjugated molecule. It can be conformed by TD-DFT calculation result. The absorption spectra originated from ICT exhibit solvatochromic behaviour obviously. They were red-shifted with increasing solvent polarity. The result indicates charge redistribution upon excitation[14].
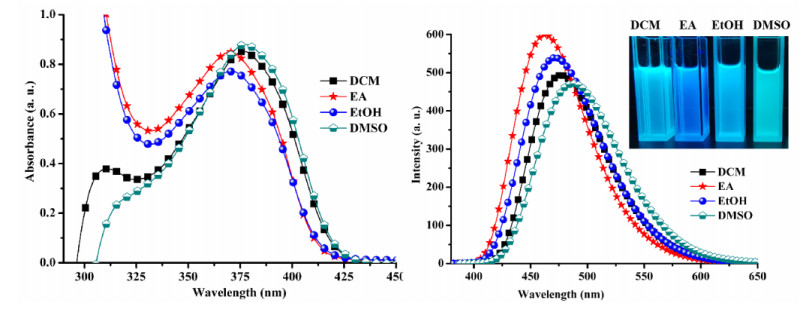
The compound has strong one-photon excited fluorescence. The OPEF spectra and fluorescent photographs in four organic solvents are shown in Fig. 4(b). The maximum fluorescence emissions locate at around 460~490 nm. The experimental results fit the theoretical calculations quite well.
With increasing the solvent polarity, the fluorescence spectra show red-shift and weakening of the emission intensity, which may be due to the higher polarity of the excited state, and the stronger dipole-dipole interaction between the solute and solvent results in lowering energy level of the excited state[14].
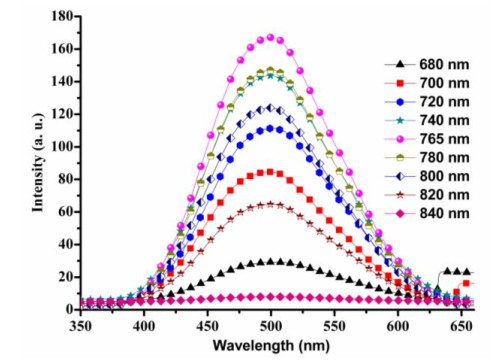
TPEF spectra in DMSO pumped by femtosecond laser pulses at 500 mW at excitation wavelengths in the range of 680~840 nm. In the measurement of ultraviolet-visible absorption spectra, no OPA was detected in the wavelength scope of 680~840 nm for the compound, which exhibits no energy level corresponding to one electron transition appears in the scope. Therefore, the fluorescence should be twophoton absorption excited fluorescence if up conversion fluorescence arises upon excitation with a tunable laser in this wavelength scope. The measurements show that the compound exhibits excellent two-photon excited fluorescence. As shown in Fig. 5, it shows good TPA activity in the range of 680~840 nm, and the optimal excitation wavelength is 765 nm, which is longer than twice the corresponding OPA maximum of 377 nm.
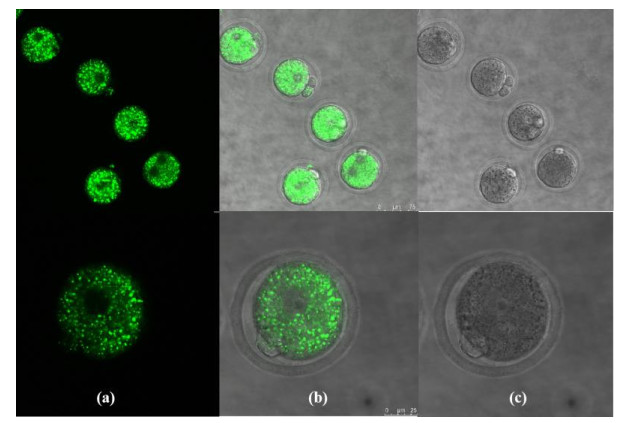
To explore the potential application of the material in fluorescence microscopy imaging, live cell fluorescent imaging research with NIH/3T3 cells stained with the material by fluorescence microscopy was carried. The results are exhibited in Fig. 6. Fluorescence from the cells indicates the material can be availably internalized by NIH/3T3 cells. The fluorescence material can go through the zona pellucida and membrane, and then localized uniformly in the cytoplasm. The result indicates the cell cytoplasm can be labelled by the material, showing its potential for fluorescence microscopy imaging application.
In summary, a D-π-A structural organic compound was prepared and characterized. The structure and optical properties were studied through theoretical calculation and experimental research. The compound has excellent fluorescence property. The result of cell imaging experiment shows the value of it in fluorescence microscopy bioimaging application.
Li, L.; Zhang, C. W.; Ge, J.; Qian, L.; Chai, B. H.; Zhu, Q.; Lee, J. S.; Lim, K. L.; Yao, S. Q. A small-molecule probe for selective profiling and imaging of monoamine oxidase B activities in models of Parkinson's disease. Angew. Chem. Int. Ed. 2015, 54, 10821−10825. doi: 10.1002/anie.201504441
Li, D. D.; Sun, X. S.; Wang, M. M.; Yu, H.; Zhou, H. P.; Wu, J. Y.; Tian, Y. P. Novel colorimetric detection probe for copper(II) ions based on triphenylamine mixed-valence chromophores bearing prodigious two-photon absorption activity. Sens. Actuators B 2015, 220, 1006–1016. doi: 10.1016/j.snb.2015.06.011
Jin, F.; Xu, D. L.; Zhou, H. P.; Wu, J. Y.; Tian, Y. P. New conjugated organic dyes with various electron donors: one- and two-photon excited fluorescence, and bioimaging. Dyes. Pigm. 2014, 109, 42–53. doi: 10.1016/j.dyepig.2014.04.032
Chen, S. Y.; Zhao, M.; Su, J.; Zhang, Q.; Tian, X. H.; Li, S. L.; Zhou, H. P.; Wu, J. Y.; Tian, Y. P. Two novel two-photon excited fluorescent pH probes based on the A-π-D-π-A system for intracellular pH mapping. Dyes. Pigm. 2017, 136, 807–816. doi: 10.1016/j.dyepig.2016.09.020
Xiao, H. B.; Zhang, Y. Z.; Zhang, W.; Li, S. Z.; Xu, R. H. Two novel dyes containing spirobifluorene and triphenylamine: synthesis, one- and two-photon excited fluorescence and applications as probes for silver ions, water and cell imaging. Sens. Actuators B 2016, 233, 469–475. doi: 10.1016/j.snb.2016.04.101
Jin, F.; Rong, Z. K.; Guo X. J.; Ma, M. Y.; Lv, J. J.; Zhang, L.; Liao, R. B.; Liu, Y.; Tao, D. L.; Tian, Y. P. Novel D-π-A-π-D structural 2, 2΄-bipyridine derivatives with different electron donors: structure, one- and two-photon excited fluorescence and bioimaging. Dyes. Pigm. 2018, 150, 174–180. doi: 10.1016/j.dyepig.2017.12.015
Kulkarni, R. U.; Vandenberghe, M.; Thunemann, M.; James, F.; Andreassen, O. A.; Djurovic, S.; Devor, A.; Miller, E. W. In vivo two-photon voltage imaging with sulfonated rhodamine dyes. ACS Cent. Sci. 2018, 4, 1371−1378. doi: 10.1021/acscentsci.8b00422
Kong, L.; Tian, Y. P.; Chen, Q. Y.; Zhang, Q.; Wang, H.; Tan, D. Q.; Xue, Z. M.; Wu, J. Y.; Zhou, H. P.; Yang, J. X. Self-assembly of metal ion induced highly emissive fluorophore-triphenylamine nanostructures: enhanced two-photon action cross-section for bioimaging applications. J. Mater. Chem. C 2015, 3, 570–581. doi: 10.1039/C4TC01605J
Huang, Y.; Qiu, F.; Shen, L. Y.; Chen, D.; Su, Y.; Yan, D. Y. Combining two-photon-activated fluorescence resonance energy transfer and near-infrared photothermal effect of unimolecular micelles for enhanced photodynamic therapy. ACS Nano. 2016, 10, 10489−10499. doi: 10.1021/acsnano.6b06450
Kannan, R.; He, G. S.; Yuan, L. X.; Xu, F. M.; Prasad, P. N.; Dombroskie, A. G.; Reinhardt, B. A.; Baur, J. W.; Vaia, R. A.; Tan, L. S. Diphenylaminofluorene-based two-photon-absorbing chromophores with various π-electron acceptors. Chem. Mater. 2001, 13, 1896–1904. doi: 10.1021/cm000747o
Liu, J.; Zhu, Y. Z.; Tian, X. H.; Li, F.; Wu, J. Y.; Tian, Y. P. Synthesis, crystal structures of a series of novel 2, 2΄: 6΄, 2΄΄-terpyridine derivatives: the influences of substituents on their photophysical properties and intracellular acid organelle targeting. Dyes. Pigm. 2016, 128, 149–157. doi: 10.1016/j.dyepig.2015.10.040
Ji, L.; Fang, Q.; Yuan, M. S.; Liu, Z. Q.; Shen, Y. X.; Chen, H. F. Switching high two-photon efficiency: from 3, 8, 13-substituted triindole derivatives to their 2, 7, 12-isomers. Org. Lett. 2010, 12, 5192–5195. doi: 10.1021/ol102057t
Liu, Y. L.; Guo, Y. Q.; Dong, Z. J.; Fu, Y. Conjugate fluorescent compound based on pyrene-imidazole: design, synthesis, crystal structure and fluorescence property. Chin. J. Struct. Chem. 2019, 38, 550–558.
Zheng, Z.; Zhang, Q.; Yu, Z. P.; Yang, M. D.; Zhou, H. P.; Wu, J. Y.; Tian, Y. P. Four new two-photon absorbing imidazo [4, 5-f] 1, 10-phenanthroline dye derivatives with different dipole moment orientation based on different groups: synthesis, optical characterization and bioimaging. J. Mater. Chem. C 2013, 1, 822–830. doi: 10.1039/C2TC00175F
Jin, F.; Ye, Z. F.; Liao, R. B.; Qiao, L. Y.; Tao, D. L.; Liu, Y. Crystal structure, one- and two-photon excited fluorescence and bioimaging of a D-π-A structural triphenylamine derivative. Chin. J. Struct. Chem. 2019, 38, 224–232.
Frisch, M. J.; Trucks, G. W.; Schlegel, H. B.; Scuseria, G. E.; Robb, M. A.; Cheeseman, J. R.; Scalmani, G.; Barone, V.; Petersson, G. A.; Nakatsuji, H.; Li, X.; Caricato, M.; Marenich, A. V.; Bloino, J.; Janesko, B. G.; Gomperts, R.; Mennucci, B.; Hratchian, H. P.; Ortiz, J. V.; Izmaylov, A. F.; Sonnenberg, J. L.; Williams-Young, D.; Ding, F.; Lipparini, F.; Egidi, F.; Goings, J.; Peng, B.; Petrone, A.; Henderson, T.; Ranasinghe, D.; Zakrzewski, V. G.; Gao, J.; Rega, N.; Zheng, G.; Liang, W.; Hada, M.; Ehara, M.; Toyota, K.; Fukuda, R.; Hasegawa, J.; Ishida, M.; Nakajima, T.; Honda, Y.; Kitao, O.; Nakai, H.; Vreven, T.; Throssell, K.; Montgomery, J. A.; Peralta, J. E.; Ogliaro, F.; Bearpark, M. J.; Heyd, J. J.; Brothers, E. N.; Kudin, K. N. V.; Staroverov, N.; Keith, T. A.; Kobayashi, R.; Normand, J.; Raghavachari, K.; Rendell, A. P.; Burant, J. C.; Iyengar, S. S.; Tomasi, J.; Cossi, M.; Millam, J. M.; Klene, M.; Adamo, C.; Cammi, R.; Ochterski, J. W.; Zakrzewski, V. G.; Voth, G. A.; Salvador, P.; Dannenberg, J. J.; Dapprich, S.; Daniels, A. D.; Martin, R. L.; Morokuma, K.; Farkas, Ö.; Foresman, J. B.; Fox, D. J. Gaussian 16, Revision B. 01. Gaussian, Inc., Wallingford CT 2016.
Miertuš, S.; Scrocco, E.; Tomasi, J. Electrostatic interaction of a solute with a continuum. A direct utilization of ab initio molecular potentials for the prevision of solvent effects. Chem. Phys. 1981, 55, 117–129. doi: 10.1016/0301-0104(81)85090-2
Pascual-Ahuir, J. L.; Silla, E.; Tuñón, I. GEPOL: an improved description of molecular-surfaces. 3. A new algorithm for the computation of a solvent-excluding surface. J. Comp. Chem. 1994, 15, 1127–1138. doi: 10.1002/jcc.540151009
Tomasi, J.; Mennucci, B.; Cammi, R. Quantum mechanical continuum solvation models. Chem. Rev. 2005, 105, 2999–3093. doi: 10.1021/cr9904009
Lu, T.; Chen, F. W. Multiwfn: a multifunctional wave function analyzer. J. Comput. Chem. 2012, 33, 580–592. doi: 10.1002/jcc.22885
Jin, F.; Hao, F. Y.; Ma, J. L.; Wu, J. Y.; Tian, Y. P. Synthesis, crystal structure and spectral properties of a novel Co(II) complex containing imidazole derivative. Chin. J. Struct. Chem. 2006, 25, 1303−1308.
Jin, F.; Lu, T. Q.; Wang, P.; Rong, Z. K.; Wu, X. Q.; Qiao, L. Y.; Liu, Y.; Liao, R. B.; Tao, D. L. Crystal structures, two-photon excited fluorescence and bioimaging of Zn(II) complexes based on D-π-A structural triphenylamine derivative. J. Lumin. 2017, 192, 1127–1132. doi: 10.1016/j.jlumin.2017.08.030
Sheldrick, G. M. SHELXL-2014/7. Program for the Solution of Crystal Structures. University of Göttingen, Göttingen 2014.
Jin, F.; Ma, M. Y.; Lv, J. J.; Guo, X. J.; Zha, Q. J.; Sun, L.; Zhang, L.; Liao, R. B. Crystal structure and the third-order nonlinear optical property of a cadmium(II) complex based on a D-π-A structural organic ligand. Chin. J. Struct. Chem. 2019, 38, 1099–1106.

Figure 1 (a) Energy variation and oscillator strength for excitation, structure reorganization (struct. reorg.) and deexcitation. (b) Computational results of OPA and OPEF

Figure 2 Hole and electron map of electron transition. (a) and (b) are the hole and electron of excitation, while (c) and (d) are the hole and electron of deexcitation. The surface isovalue is 0.001 au

Figure 4 (a) Ultraviolet-visible absorption spectra and (b) OPEF spectra of the compound in five organic solvents

Figure 5 TPEF spectra of the complex in DMSO pumped by femtosecond laser pulses under the excitation wavelengths from 680 to 840 nm

Figure 6 (a) Fluorescence microscopy image of NIH/3T3 cells stained with the material (b) Bright-field image (c) Merged image
Table 1. Bond Distances (Å) and Dihedral Angles (°) of S0 (Optimized in DCM)
| Bond | Dist. | Bond | Dist. | Dihedral angle | (°) | ||
| N(1)−C(4) | 1.417 | N(3)−C(15) | 1.410 | R1-R2 | 25.18 | ||
| C(7)−C(10) | 1.466 | N(3)−C(16) | 1.418 | R2-R3 | 19.67 | ||
| C(10)−C(11) | 1.337 | N(3)−C(22) | 1.419 | R3-R4 | 67.95 | ||
| C(11)−C(12) | 1.465 | N(1)−N(2) | 1.348 | R4-R5 | 73.06 |
 下载: 导出CSV
Table 2. Bond Distances (Å) and Dihedral Angles (°) of S1 (Optimized in DCM)
| Bond | Dist. | Bond | Dist. | Dihedral angle | (°) | ||
| N(1)−C(4) | 1.407 | N(3)−C(15) | 1.387 | R1-R2 | 15.47 | ||
| C(7)−C(10) | 1.404 | N(3)−C(16) | 1.420 | R2-R3 | 1.47 | ||
| C(10)−C(11) | 1.407 | N(3)−C(22) | 1.419 | R3-R4 | 65.64 | ||
| C(11)−C(12) | 1.397 | N(1)−N(2) | 1.352 | R4-R5 | 73.46 |
下载: 导出CSV
Table 3. Selected Bond Lengths (Å) for the Compound
| Bond | Dist. | Bond | Dist. | Bond | Dist. | ||
| N(1)−C(4) | 1.416(4) | C(11)−C(12) | 1.497(6) | N(3)−C(22) | 1.409(5) | ||
| C(7)−C(10) | 1.472(6) | N(3)−C(15) | 1.431(5) | N(4)−C(33) | 1.417(5) | ||
| C(10)−C(11) | 1.287(6) | N(3)−C(16) | 1.417(5) | C(36)−C(39) | 1.477(6) | ||
| C(40)−C(39) | 1.268(6) | C(41)−C(40) | 1.490(6) | N(6)− C(44) | 1.415(5) |
下载: 导出CSV

 扫一扫看文章

扫一扫关注我们


 下载:
下载: