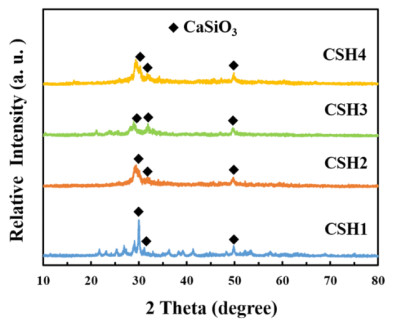
Figure 1.
XRD patterns of the CSH samples

Global water contamination is always associated with the releasing of heavy metals in water and with eutrophication as well[1, 2]. The rapid development of industry has resulted in discharge of a substantial amount of lead (Pb) into the environment. The lead and its compounds can exert a great threat to both the ecosystem and human beings. On the other side, there has a large amount of phosphorus releasing into the environment and spanning the discharge of domestic sewage, industrial effluents, and animal husbandry wastewater [3-7].
As of today, adsorption technique remains one of the most appealing pathways in treating the wastewater due to low cost and facile procedure. Researchers have focused on developing different types of highly effective adsorbents. For instance, Petrella et al.[8] developed the lignocellulosic residues from the olive oil production as adsorbent for lead; Yan et al.[9] showed that the ECCSB@Fe3O4 is efficient for lead extraction; Abdelrahman et al.[10] studied adsorption capacity toward Pb(II) ions by chitosan biopolymer composites that are prepared by hydroxysodalite nano-particles.
On this basis, researchers have dedicated themselves to the development of high-performance adsorbents. For instance, Filote et al.[11] showed that a biorefinery macroalgae can remove the lead from wastewater with a maximum adsorption capacity up to 132 ± 14 mg/g; Hongyu Wang et al.[12] employed an engineered biochar of hickory wood treated with KMnO4, and found that it had the maximum Pb(II) sorption capacity up to 153.1 mg/g. Liu et al.[13] prepared a chitosan/graphene oxide composite material with Pb(II) adsorption capacity up to 216.92 mg/g; Deng et al.[14] demonstrated the functional graphene by electrolytic method, and the saturated adsorption capacity of lead increased by 406.6 mg/g. Despite these advances, the designed adsorbents always suffered from the low adsorption capacity that has a finite saturated adsorption capacity.
We proposed in this work that, if the adsorbent can not only extract the pollutants, but also use the pollutants as the building blocks to provoke the crystal growth of adsorbent that will be applicable to the next cycling, we would break through the limitation of maximum adsorption capacity of adsorbents. To this end, we employed the biowaste materials as the precursor to create the highly cost-effective adsorbents featured with aforementioned merits. The structures of bio-derived adsorbents were determined, their abilities for wastewater treatment were investigated to study, and the underlying mechanism was discussed.
The calcium-based adsorbents were prepared employing the biomass waste (e.g., oyster shell, crab shell, eggshell, and clamshell) as the precursor. Specifically, the biomass wastes were washed with deionized water for several times and dried under 60 ℃. After that, they were calcined at 500 ℃ to give the CaO, and the bio-derived CaO was ground and screened through 200 mesh for subsequent applications.
The bio-derived CaO and silicon micro powder (mass ratio: 1.39) were ground and mixed with an addition of trace amount of deionized water. The mixture was then calcined at 800 ℃ and then hydrothermally treated at 180 ℃ to give the CSH samples. The CSH products were centrifuged, washed, and dried at 60 ℃. With the oyster shell, crab shell, eggshell, or clamshell as the precursor, the obtained CSH samples were referred to as CSH1, CSH2, CSH3, and CSH4, respectively.
The crystal structures of the materials were determined by X-ray diffraction analysis using a Miniflex 600 X-ray diffractometer (XRD) with CuKa radiation at 40 kV and 15 mA in a continuous scanning mode. The spectra were recorded over the 2θ range of 10~80o at 3 o·min-1 with a step size of 0.01o. The morphologies of the samples were examined by using scanning electron microscopy (SEM, SUPPA 55) and transmission electron microscopy (TEM, TECNAI G2 F20). N2 absorption-desorption measurements were conducted on a 3Flex. X-ray photoelectron spectro-scopy (XPS) spectra were obtained from an XPS system (Thermo Fisher Scientific Inc. ESCALAB 250).
Phosphorus extraction: CSH (100.0 mg) was added into the 100.0 mL phosphorus solutions that have 100, 200 and 300 mg/L PO43-, respectively, and then stirred for 12 hours at a speed of 500 rpm. At each time interval, the adsorbent was extracted and dried at 60 ℃ for 24 h. It gave the hydroxyapatite. For example, the CSH1 sample after being treated in 200 mg/L PO43- solution was referred to as HAP1-200.
Metal ion extraction: The adsorbent (15.0 mg) was added into 60.0 mL simulated waste solution that contains 100.0 mg/L Pb2+, and the mixture was stirred at a speed of 500 rpm at room temperature (25 ℃). Samples were taken at the same time intervals to test the concentration of metal ion by Shimadzu AA-6880 atomic absorption spectrophotometer. Subsequently, the adsorption capacities of the samples toward the metal ions were calculated based on Eq. (1):
|
|
(1) |
where C0 is the initial concentration (mg/L) of metal ion in the solution, Ce is the concentration (mg/L) of metal ion when reaching the adsorption equilibrium, V is the volume (L) of solution; m is the mass (g) of adsorbent; and qe is the adsorption capacity (mg/g) for metal ion while reaching the adsorption equilibrium.
Fig. 1 shows the XRD patterns of Ca-based CSH adsorbents which were prepared by using the oyster shell, crab shell, eggshell, and clamshell as the precursor, respectively. The diffraction peaks of CSH at 28.9o, 30.0o, 31.9o and 49.7o correspond to the (202), (320), (
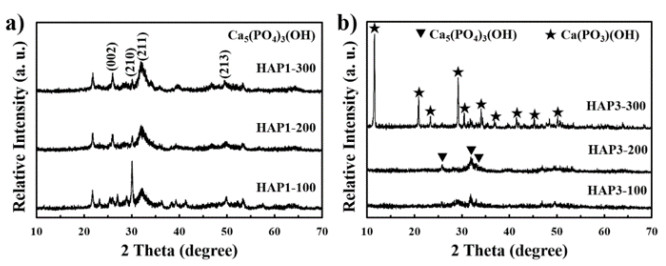
The CSHs were then evaluated as adsorbents to remove the phosphorus from the aqueous solution, and the phases of retrieved CSHs were determined by XRD (Fig. 2). Markedly, the CSH1 after adsorbing the phosphorus has new diffraction peaks (Fig. 2a) at 25.8°, 28.9°, 31.7°, 32.2°, 32.9° and 49.5°, which correspond to the (002), (210), (211), (112), (300) and (213) diffraction of the hexagonal hydroxyapatite (HAP), i.e., Ca5(PO4)3(OH) (JCPDS 09-0432). Accordingly, the retrieved CSHs after extracting the phosphorus are referred to as HAPs. The chemical components of HAPs highly depend on the initial concentrations of phosphorus in solution. According to the XRD pattern of HAP3 (Fig. 2b), when the concentration of phosphorus solution is set at 100 or 200 mg/L, the main products are both Ca5(PO4)3(OH). As the phosphorus concentration in solution increases to 300 mg/L, the Ca(PO3)(OH) (JCPDS 09-0077) is generated. Clearly, the calcium-phosphorus ratio in the product decreases as an increase of the phosphorus concentration in the initial solution. It means that the CSH can not only extract the phosphorus from the solution, but also use the phosphorus to create a new HAP in the structure. In other words, the phosphorus extraction is associated with the growth of HAPs on CSHs.
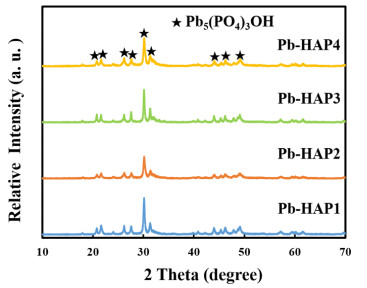
We further evaluated the adsorption capability of HAPs for the removal of heavy metal (with Pb2+ as an indicator) from the solution. The XRD analysis (Fig. 3) reveals the HAP is efficient for scavenging Pb2+, and the removal of Pb2+ by HAP is associated with the generation of a new phase, i.e., Pb5(PO4)3(OH) (JCPDS 08-0259). It means the HAP possesses a satisfactory extraction capacity for Pb2+ taking advantage of the ion exchange between Pb2+ and Ca2+.
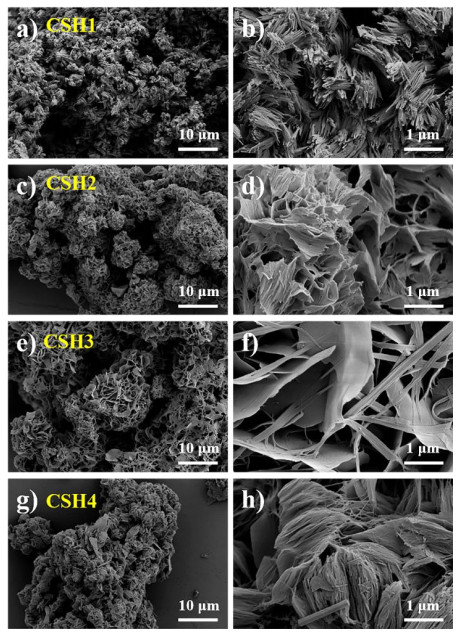
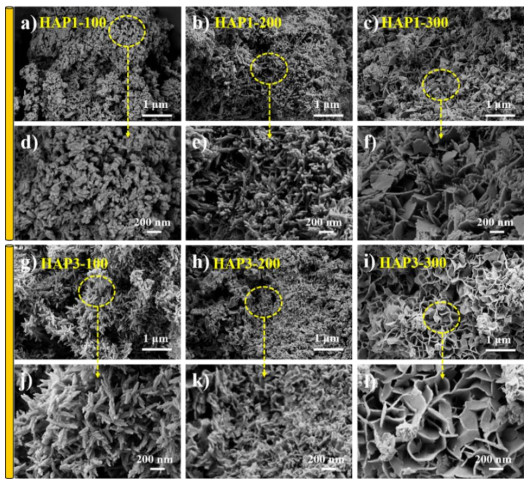
SEM observation helps to study the microscopic morphology of adsorbent in each step. Fig. 4 shows SEM images of the four CSH samples. The CSH1 has a bunch-like structure by assembling rod-like particles of ~1 micron in length (Fig. 4a-b). By comparison, the CSH2, CSH3 and CSH4 are of hierarchically porous structure with nanosheets as the building blocks. All the four CSHs have mesoporous (2~50 nm) or even macroporous (> 50 nm) structure that can promote the mass transport of adsorbates to the active adsorption site.
The morphology of HAP was also investigated and is found to change with the phosphorus concentration (Fig. 5). Fig. 5a-f and Fig. 5g-l show that the surface of the initial CSH is relatively smooth. After extracting low-concentration phosphorus, the HAP nanorods are decorated onto the surface of CSH substrate. Taking the HAP3-300 as an example, the nanosheet-like structures are found as the phosphorus concentration increases. Based on the aforementioned SEM images and XRD patterns, the main component of HAP3-300 is Ca(PO3)(OH) nanosheets. It is worth mentioning that whether the building blocks of HAP samples are rod-like or sheet-like stacking particles, these samples are of hierarchical porous structures featured with highly abundant pores favoring the adsorption of pollutants.
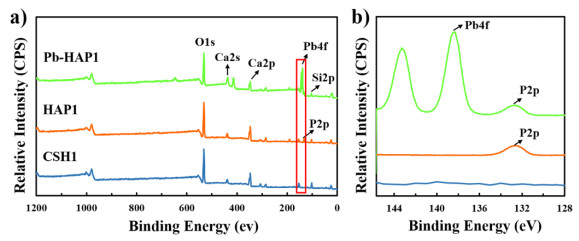
XPS spectra were collected to identify the chemical components of CSH1, HAP1-200, and Pb-HAP1 that have extracted the Pb2+. As depicted in Fig. 6a, the XPS spectra of CSH1 have four peaks of Ca 2p, Ca 2s, Si 2p and O 1s, in line with the chemical component of CSH reported in the literature[15]. By comparison (Fig. 6b), appearing of new XPS peaks ascribed to the P 2p and Pb 4f in XPS spectra of HAP1-200 and Pb-HAP1. It confirms that the CSH and HAP can extract the phosphorus and Pb2+ from wastewater, respectively.
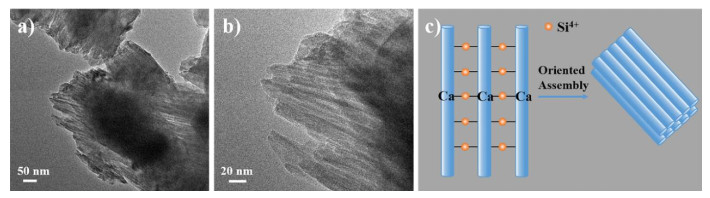
The microstructure of CSH was further studied based on transmission electron microscopy (TEM). Fig. 7 a, b show that the CSH nanosheets are actually composed of nanorods, approximately 10 nm in width and several hundred nm in length. It is worth noting that these nanorods are orderly assembled via the same orientation, forming the lamellar structure. Such phenomenon of particle-mediated self-assembly behavior could be explained by the non-classical oriented attachment mechanism[16], wherein two nanoparticles of identical lattice orientation can grow into a new particle or form an assembled structure[16]. Beyond doubt, the ordered structure can create a substantial amount of pores in the structure and allow the exposure of adsorption sites, thereby facilitating the wastewater purification capacity[17].
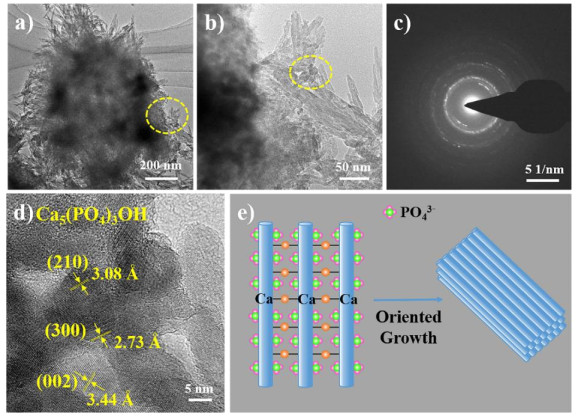
The microstructure of HAP1-200 was identified by TEM images (Fig. 8 a and b). After phosphorus adsorption, some elongated rod-like nanocrystals (about 100~200 nm) appear. The HRTEM images of these nanorods in HAP1-200 (Fig. 8d) are Pb5(PO4)3(OH) that display the (210), (300) and (002) planes of Pb5(PO4)3(OH) with 3.08, 2.73 and 3.44 Å lattice spacing, respectively. Hence, a schematic diagram of Pb2+ adsorption by HAP is presented. As shown in Fig. 8e, the HAP1-200 after Pb2+ absorption has a well-preserved 3D porous structure. Since the ion exchange between Pb2+ and Ca2+ occurs on the surface of HAP nanorods, the Pb5(PO4)3(OH) nanoparticles are attached closely to the surface of the nanowires that help to avoid the blocking of the pores in structure. The retrieved adsorbent can be still abundant in pore structure and be efficient for wastewater treatment in the next cycle.
The N2 adsorption-desorption curves were carried out to determine the specific surface area of the adsorbents. As shown in Table 1, the hierarchically porous 2D structures of CSH2, CSH3 and CSH4 all have large specific surface areas. Table 2 shows that in the process of phosphorus adsorption, the specific surface area of adsorbent increases from 31.2 m2/g for CSH1 to 108 m2/g for HAP1-200. The newly-generated HAP nanorods have enlarged specific surface areas. However, the specific surface area slightly decreases from 108 m2/g for CSH3 to 87.3 m2/g for HAP3-200, probably since the sheet-like structure of CSH3 is partially grown into the nanoparticles (Fig. 5 h and k), while the agglomeration of nanoparticles results in the decrease of specific surface area of the adsorbent.
 DownLoad:
CSV
DownLoad:
CSV
| Samples | Specific surface area(m2/g) | Pore volume(cm3/g) | Pore size(nm) |
| CSH1 | 31.2 | 0.145 | 23.6 |
| CSH2 | 66.6 | 0.333 | 22.4 |
| CSH3CSH4 | 10861.1 | 0.3980.295 | 19.819.3 |
DownLoad:
CSV
| Samples | Specific surface area(m2/g) | Pore volume(cm3/g) | Pore size(nm) |
| HAP1-200 | 108 | 0.350 | 13.6 |
| HAP3-200 | 87.3 | 0.295 | 16.1 |
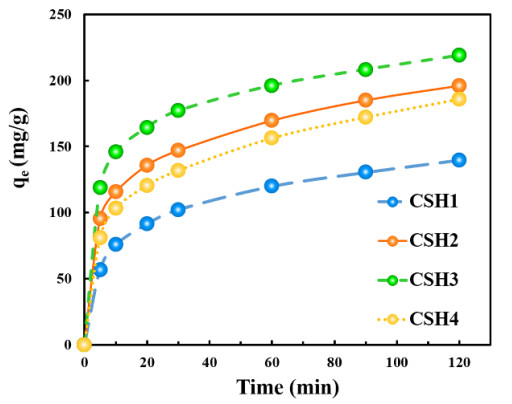
To confirm the efficiency of HAP in next cycling of wastewater treatment, we compared the adsorption capacities of CSH and HAP-200 toward the removal of Pb2+ under the same condition. As shown in Figs. 9 and 10, all of the four CSHs show moderate adsorption capacities for Pb2+. The adsorption capacities of the CSHs are highly associated with the specific surface area and pore volume of adsorbents. It suggests that the specific surface area and pore volume of the adsorbents determine the adsorption capacity of CSHs. It is worth noting that the hierarchically porous 2D materials composed of nanosheets have abundant pores in structures and thus have a high adsorption capacity.
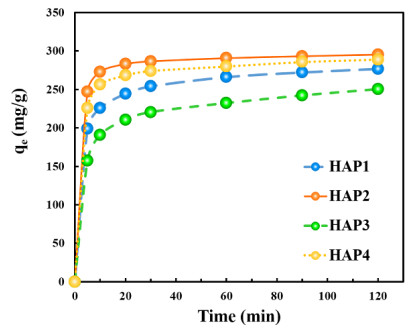
In reference with CSHs, the HAP-200 shows enhanced ability toward the removal of Pb2+ from aqueous solution (Fig. 10). In addition, all the HAP-200 samples can reach the adsorption equilibrium within 40 mins. The adsorption capacities of the four HAP-200 samples were 277, 295, 250 and 289 mg/g, respectively. It should be noted that the adsorption capacity of HAP1-200 is nearly twice as high as that of CSH1, owing to the formation of HAP nanoparticles on the smooth surface of CSH1 nanorods (Fig. 5 b and e), which endows the adsorbent with additional active sites.
In summary, in the process of scavenging pollutants, the CSH structure has the self-growing structure by using pollutants as the building blocks, not only achieving high adsorption capacity for pollutants, but also maintaining the hierarchically porous structure that supports the high efficiency in the next cycling. Such CSH adsorbents can be prepared by using the waste oyster shells as the precursors, and such strategy can be applied to other Ca-based biomass. The findings here reveal an intriguing principle for the rational design of efficient adsorbents to tackle the challenge of traditional adsorbents.
Lin, L.; Yu, Y. Adsorption of Pb2+ and Cu2+ with unburned desulphurization slag modified nickel slag. Chin. J. Struct. Chem. 2017, 36, 491–502.
Kong, F. L.; Xi, M.; Xu, L. H.; Li, Y.; Qin, P. R. Review of studies on the limitation of nutrients in the eutrophic water. J. Earth Environ. 2016, 7, 121–129.
Lin, L.; Yu, Y. A study on the surface physicochemical properties of modified nickel slag adsorbent to remove Pb2+ and Cu2+ from aqueous solution. J. Fuzhou Univ. (Nat. Sci. Ed. ) 2016, 44, 119–123.
Lin, L.; Yu, Y. Application of modified nickel slag adsorbent on the removal of Pb2+ and Cu2+ from aqueous solution. Chin. J. Struct. Chem. 2016, 35, 879–888.
Ince, O. K.; Ince, M.; Yonten, V.; Goksu, A. A food waste utilization study for removing lead(II) from drinks. Food Chem. 2017, 214, 637–643. doi: 10.1016/j.foodchem.2016.07.117
Lin, L. Preparation of wastewater phosphorus removal materials by dry FGD ash produced from iron industry. Chin. J. Struct. Chem. 2013, 32, 266–272.
Yin, H. B.; Kong, M. Reduction of sediment internal P-loading from eutrophic lakes using thermally modified calcium-rich attapulgite-based thin-layer cap. J. Environ. Manage. 2015, 151, 178–185. doi: 10.1016/j.jenvman.2015.01.003
Petrella, A.; Spasiano, D.; Acquafredda, P.; Vietro, N. D.; Ranieri, E.; Cosma P.; Rizzi, V.; Petruzzelli, V.; Petruzzelli, D. Heavy metals retention (Pb(II), Cd(II), Ni(II)) from single and multimetal solutions by natural biosorbents from the olive oil milling operations. Process Saf. Environ. Prot. 2018, 114, 79–90. doi: 10.1016/j.psep.2017.12.010
Yan, Y. K.; Yuvaraja, G.; Liu, C. J.; Kong, L. J.; Guo, K.; Reddy, G. M.; Zyryanov, G. V. Removal of Pb(II) ions from aqueous media using epichlorohydrin crosslinked chitosan Schiff's base@Fe3O4(ECCSB@Fe3O4). Int. J. Biol. Macromol. 2018, 117, 1305–1313. doi: 10.1016/j.ijbiomac.2018.05.204
Abdelrahman, E. A.; Hegazey, R. M. Utilization of waste aluminum cans in the fabrication of hydroxysodalite nanoparticles and their chitosan biopolymer composites for the removal of Ni(II) and Pb(II) ions from aqueous solutions: kinetic, equilibrium, and reusability studies. Microchem. J. 2019, 145, 18–25. doi: 10.1016/j.microc.2018.10.016
Filote, C.; Volf, I.; Santos, S. C. R.; Botelho, C. M. S. Bioadsorptive removal of Pb(II) from aqueous solution by the biorefinery waste of Fucus spiralis. Sci. Total Environ. 2019, 648, 1201–1209. doi: 10.1016/j.scitotenv.2018.08.210
Wang, H. Y.; Gao, B.; Wang, S. S.; Fang, J. Removal of Pb(II), Cu(II), and Cd(II) from aqueous solutions by biochar derived from KMnO4 treated hickory wood. Bioresour. Technol. 2015, 197, 356–362. doi: 10.1016/j.biortech.2015.08.132
Liu, L.; Li, C.; Bao, C. L.; Jia, Q.; Xiao, P.; Liu, X.; Zhang, Q. Preparation and characterization of chitosan/graphene oxide composites for the adsorption of Au(III) and Pd(II). Talanta. 2012, 93, 350–357. doi: 10.1016/j.talanta.2012.02.051
Deng, X. J.; Lü, L. L.; Li, H. W.; Luo, F. The adsorption properties of Pb(II) and Cd(II) on functionalized graphene prepared by electrolysis method. J. Hazard. Mater. 2010, 183, 923–930. doi: 10.1016/j.jhazmat.2010.07.117
Kang, X. J.; Huang, S. S.; Yang, P. P.; Ma, P. A.; Yang, D. M.; Lin, J. Preparation of luminescent and mesoporous Eu3+/Tb3+ doped calcium silicate microspheres as drug carriers via a template route. Dalton Trans. 2011, 40, 1873–1879.
Penn, R. L.; Banfield, J. F. Imperfect oriented attachment: dislocation generation in defect-free nanocrystals. Science 1998, 281, 969–971. doi: 10.1126/science.281.5379.969
You, W. J.; Weng, Y. L.; Wang, X.; Zhuang, Z. Y.; Yu, Y. Synthesis and adsorption properties of hierarchically ordered nanostructures derived from porous CaO network. ACS Appl. Mater. Interfaces 2016, 8, 33656–33665.

Figure 2 XRD patterns of (a) HAP1 and (b) HAP3 generated from CSH1 and CSH3 treated with different concentration of pollutant respectively

Figure 6 (a) XPS spectra of CSH1, HAP1-200 and Pb-HAP1, (b) Pb 4f XPS spectra for Pb-HAP1

Figure 7 (a, b) TEM images of CSH and (c) scheme illustrating the oriented attachment mechanism of CSH1 nanowires into ordered system

Figure 8 (a, b) TEM images of HAP1-200 (c) SAED pattern of HAP1-200, (d) HRTEM image of HAP1-200 and (e) Self-growth mechanism of HAP1-200 during water treatment
Table 1. Specific Surface Area, Pore Volume and Pore Size of CSHs
| Samples | Specific surface area(m2/g) | Pore volume(cm3/g) | Pore size(nm) |
| CSH1 | 31.2 | 0.145 | 23.6 |
| CSH2 | 66.6 | 0.333 | 22.4 |
| CSH3CSH4 | 10861.1 | 0.3980.295 | 19.819.3 |
 下载: 导出CSV
Table 2. Specific Surface Area, Pore Volume and Pore Size of HAPs
| Samples | Specific surface area(m2/g) | Pore volume(cm3/g) | Pore size(nm) |
| HAP1-200 | 108 | 0.350 | 13.6 |
| HAP3-200 | 87.3 | 0.295 | 16.1 |
下载: 导出CSV

 扫一扫看文章

扫一扫关注我们


 下载:
下载: