Figure 1.
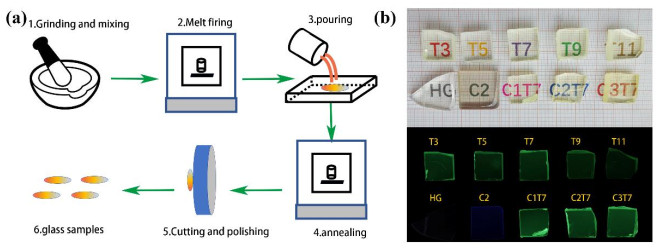
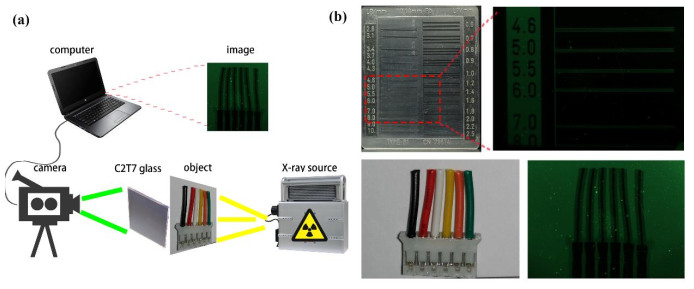
(a) Picture of flow chart of making glass experiment, (b) Picture of glass sample under sunlight and X-ray irradiation
Scintillation Properties of Ce3+/Tb3+ Co-doped Oxyfluoride Glass with the Exploration of Imaging Application
Da-Yi CHEN , Yan LI , Yi-Heng WU , Zhi-Lin WANG , Shuai-Hua WANG , Qing SU , Bi-Sheng ZHANG , Qing-You ZENG , Shao-Fan WU

Scintillator is an energy conversion material that can convert signals that are not easily detectable, such as high-energy ions (α particles, neutrons, protons, etc.) and high-energy rays (X-rays, β-rays), into detectable signals[1-4]. There are many types of scintillators, mainly scintillation of crystals, ceramics and glasses. Compared with scintillation of crystals and ceramics, scintillation glass has the characteri-stics of simple preparation process, low cost, good thermal stability, high transparency, and the ability to prepare bulk detectors[5, 6]. At present, scintillation glass is gradually becoming a research hotspot due to its potentiality of applications in high-energy physics, medical imaging, border security, and astrophysics[7, 8].
Scintillation glass generally takes rare earth ions as its luminescence center, and common ones include[9-13] Ce3+, Tb3+, Sm3+, Dy3+, etc. There are many studies on Ce3+ and Tb3+ ion single-doped glass[14-16], but few reports on the Ce3+/Tb3+ co-doped scintillation glass. The glass matrix of scintillation glass usually includes silicate, borate, germanate, and phosphate systems[17, 18]. As the most widely studied glass, silicate always has the characteristics of strong chemical stability and high transparency, but its low density and low X-ray cut-off ability will limit its application in scintillation[19]. Therefore, we can increase the density of glass by introducing heavy metal ions. This article introduces gadolinium and gallium as heavy ions into the glass matrix to increase the glass density. Oxyfluoride glass is the current research popular direction, mainly because it combines the high mechanical strength of oxide glass and the low generation energy of fluoride glass. Not only the tolerance of rare earth ions is high, but the chemical composition ratio can be adjusted in a wide range.
Thence, this article takes Ce3+/Tb3+ co-doped oxyfluoride scintillation glass as the research target to explore its scintillation performance. Experiments indicated that cerium ions can sensitize the luminescence of terbium ions. The XEL strength of Ce3+/Tb3+ co-doped scintillation glass is 1.8 times that of Tb3+ ion single-doped glass. For the X-ray imaging research, there have been reports on the imaging of crystals[20-23], but almost no reports of imaging of glass are found. In order to image the cerium-terbium co-doped glass, we independently built a simple X-ray imaging platform. The results showed that at a dose rate of 42.29 mGys-1, the resolution reached 7.0 lp/mm of the spatial resolution card. Similarly, the corresponding sensitivity of the glass to X-ray was tested, and the results showed that the sensitivity of Ce3+/Tb3+ co-doped scintillation glass is 1.7 times that of the BGO crystal. This certifies that the cerium-terbium co-doped glass we prepared has high resolution and corresponding radiation sensitivity, which can be applied in practical work.
Silicon dioxide (SiO2, 99%), aluminium oxide (Al2O3, 99%), strontium fluoride (SrF2, 99%), diantimony trioxide (Sb2O3, 99%), gadolinium oxide (Ga2O3, 99.99%), gadolinium fluoride (GdF3, 99.99%), tetraterbium heptaoxide (Tb4O7, 99.995%) and cerium oxide (CeO2, 99.995%) were all purchased from Aladdin.
The oxyfluoride glasses were admixed through a conventional melting‐quenching method, as shown in Fig. 1a. The raw materials were all accurately weighed according to the molar ratio firstly (The formula is shown in Table 1). Then they were placed in an agate mortar, ground and mixed thoroughly for half an hour. Subsequently, the well mixed powder was transferred to a covered alumina crucible and melted at 1500 ℃ for 30 min in the box furnace. The melt mixture was poured into a preheated iron mold, annealed rapidly in a muffle furnace at 400 ℃ for 4 hours to relieve thermal stress, and cooled naturally to room temperature to form bulk glass. With cutting and polishing, a series of oxyfluoride glass samples with terbium ion doping and Ce-terbium ion co-doping were all available, which were 15mm × 15mm in size. At last, after naming the host glass as HG, the glass doped with tetraterbium heptaoxide as T, the glass doped with cerium oxide as C, and the glass co-doped with cerium oxide and tetraterbium heptaoxide as CT, we went further optical performance test.
 DownLoad:
CSV
DownLoad:
CSV
| 45SiO2-28Ga2O3-6Al2O3-0.5Sb2O3-14.5SrF2-6GdF3-xTb4O7-yCeO2 | ||||||||||
| Doping concentration (mol%) | ||||||||||
| Sample | HG | T3 | T5 | T7 | T9 | T11 | C1T7 | C2T7 | C3T7 | C2 |
| x | 1 | 3 | 5 | 7 | 9 | 11 | 7 | 7 | 7 | 0 |
| y | 0 | 0 | 0 | 0 | 0 | 0 | 1 | 2 | 3 | 2 |
Fig. 1b is a picture of the scintillation glass sample prepared in the experiment under sunlight and X-ray with a dose rate of 42.29 mGys-1. It can be seen from the figure that due to the difference in doping concentration and composition, the transmittance of glass under natural light has changed, but basically retains a very high transmittance, while the luminescence under radiation changes greatly. The matrix glass hardly emits light, but cerium single-doped glass samples emit faint blue light and cerium-terbium double-doped glass samples can emit extremely bright green light.
The density test was carried out using electronic density meter (DX-120C). The XRD characterization was measured over the scanning range of 10~80º (2θ) by a MiniFlex600 X-ray diffractometer at room temperature. The thermal stability analysis experiment of oxyfluoride glass samples was measured by Synchronous thermal analyzer (STA4493) heated from 50 to 900 ºC at a heating rate of 10 ℃/min under air atmosphere. The UV-Vis absorption spectra were probed by UV-Vis NIR spectrophotometer (Lambda 950). Photolumine-scence (PL) spectra were examined to seek excitation and emission spectra using an FLS 1000 spectrometer, which were excited by xenon lamp (500 W). The fluorescence lifetime test was also carried out by using the FLS 1000 spectrometer, but different in the excitation source, the later was excited by a Microsecond lamp. X-ray excitation spectroscopy was tested by X-ray source (MagProTUB0014).
The results of density measurement are shown in Table 1, from which we can see that the density of all glass sample is above 4.2 g/cm3, the minimum is 4.281 g/cm3 for the matrix glass and the maximum is 4.762 for the T11 sample. Obviously, the density of glass sample increases with increasing the doping concentration of cerium oxide and tetraterbium heptaoxide because rare earth ion has higher atomic number and larger ion radius. High density helps increase the absorption coefficient, thereby reducing the radiation length of the scintillator, which is an important parameter for evaluating scintillator performance. The lower the radiation length, the smaller the size of scintillator required, and the smaller the cost and detector volume. The principle is as follows:
|
|
Where I is the energy passing through the scintillator, d is the thickness of the scintillator, and µ is the absorption coefficient of the scintillator for high-energy rays or high-energy particles.
DownLoad:
CSV
| Sample | CeO2 (mol%) | Tb4O7 (mol%) | Density (g/cm3) |
| HG | 0 | 0 | 4.281 |
| C2 | 2 | 0 | 4.305 |
| T3 | 0 | 3 | 4.340 |
| T5 | 0 | 5 | 4.506 |
| T7 | 0 | 7 | 4.503 |
| T9 | 0 | 9 | 4.628 |
| T11 | 0 | 11 | 4.762 |
| C1T7 | 1 | 7 | 4.445 |
| C2T7 | 2 | 7 | 4.452 |
| C3T7 | 3 | 7 | 4.489 |
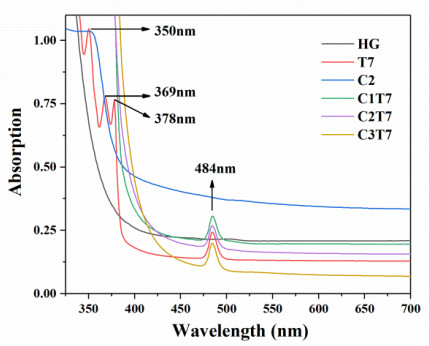
Fig. 2 elaborates the absorption UV-Vis spectra of host glass (HG), Ce3+ doped (C2), Tb3+ doped (T7) and Ce3+/Tb3+ co-doped (CT) transparent glass samples in the range of 300~700 nm. In this figure, all samples exhibit high transparency from 400 to 700 nm. It can be seen from the figure that as the doping concentration of rare earth compounds increases, the UV absorption edge shrinks from 343 to 383 nm. For the T7 sample curve, absorption peaks are observed at 350, 369, 378 and 484 nm, which represent 7F6→5L9, 5L10, 5D3 and 5D4 of Tb3+ ions respectively. The same peak at 484 nm can be observed in the CT sample, but those at 351, 368, and 378 nm disappeared, which may be due to the influence of cerium ions.
The X-ray diffraction patterns of glass samples HG, C2, T7, and C2T7 are located in Fig. 3. Clearly, there is no evident sharp peak in the whole patterns, and we can find a broad peak between 15° and 35°. That will confirm the amorphous nature of the inorganic salt of the sample we prepared.
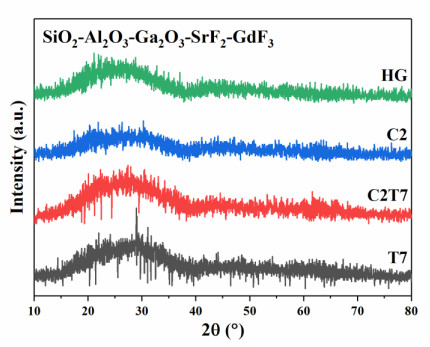
Fig. 4 shows the TG/DTA chart of Ce3+/Tb3+ co-doped C2T7 glass sample. It can be seen from the figure that in the range of 100~900 ℃, the glass almost does not lose weight, indicating that the glass has good thermal stability and can well meet the work needs of scintillating materials in high-temperature environments.
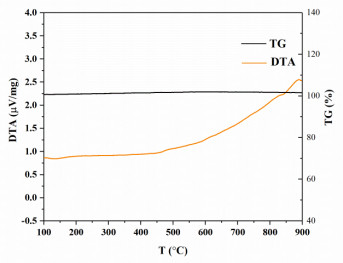
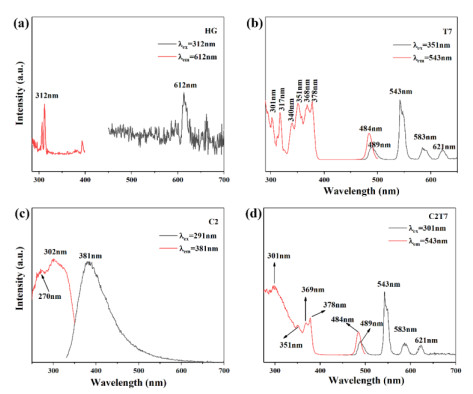
Fig. 5 exhibits the fluorescence excitation and emission spectra of host glass (HG), Tb3+ doped glass (T7), Ce3+ doped glass and Ce3+/Tb3+ co-doped glass (C2T7) samples. As can be seen from Fig. 5a, the main excitation peaks of the HG sample falling at 273, 307, and 312 nm represent 8S7/2 → 6IJ, 6P5/2, and 6P7/2 of Gd3+ ion, separately; the main emission peaks of the HG sample at 612 nm may be the result of defect state light emission. Fig. 5b shows the excitation peaks of 301, 317, 340, 351, 368, 378 and 484 nm, which correspond to 7F6→5H6, 5H7, 5L8, 5L9, 5L10, 5D3 and 5D4 of Tb3+ ions, respectively. Similarly, the main emission peaks of T7 sample at 489, 543, 583 and 621 nm exactly match 5D4→7F6, 7F5, 7F4 and 7F3. Furthermore, the excitation wavelength of the strongest emission peak is 351 nm, and the emission wavelength of the strongest excitation peak is 543 nm. The excitation peaks of the excitation spectra of the C2 sample are two broad peaks of 270 and 302 nm, corresponding to 2F2/5 and 2F2/7→5D, and 2F2/5 and 2F2/7 belonging to the 4f energy level spin-orbital split. And there is only one broad peak of emission spectra of C2 sample at 381 nm, which matching electric dipole allows the transition of 5d→4f. In Fig. 5d, the excitation peaks are only 301, 351, 369, 378 and 484 nm, however 317 and 340 nm vanish because they are covered by the excitation peak of Ce3+ ion at 301 nm of 4f→5d. While compared with the T7 sample, the emission peak position of the C2T7 sample has not changed.
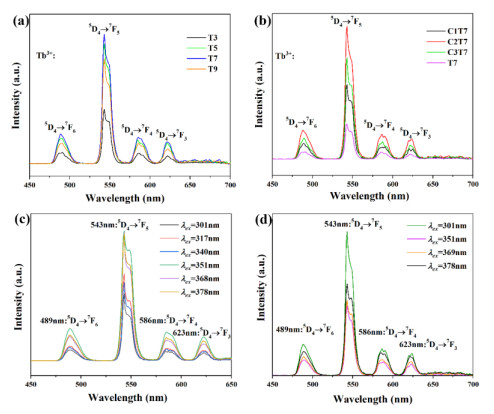
As Fig. 6 shows, the X-ray excited optical luminescence intensity increases with the growth of Tb3+ doping concentration, and reaches the maximum when the concentration of Tb4O7 is 4%. But the emission intensity of T9 and T11 samples decreased, which may be the result of concentration quenching. Similarly, the same phenomenon can be observed in the emission spectrum of Ce3+/Tb3+ co-doped glass samples. The emission intensity first increases with the doping concentration, the C2T7 sample is the largest, and then decreases. They are also due to the concentration quenching effect. It is worth noting that the emission intensity of the cerium-terbium co-doped samples is significantly enhanced compared to the samples doped with cerium ion alone, because the Ce3+ ion can sensitize the luminescence of Tb3+. According to the previously measured excitation peaks of the C2T7 samples in Fig. 5d, we measured the emission spectra of the C2T7 samples at different excitation wavelengths and found that the excitation spectrum intensity was the strongest at 301 nm. However, the strongest excitation wavelength of T7 glass sample is 351 nm. The reason is that the excitation peak of Ce3+ ion at 301 nm, attributed to the 4f→5d electronic transition, is superimposed with the excitation peak of 7F6→5H6 of Tb3+ at 301 nm and thus enhances the emission of Tb3+.
Fluorescence decay curve of Ce3+/Tb3+ co-doped (C2T7), Ce3+ doped (C2), and Tb3+ doped (T5) samples are placed at Fig. 7. Fluorescence lifetime refers to the average residence time of a molecule in the excited state before it returns to the ground state after being excited by a light pulse. The fluorescent molecule in the excited state emits fluorescence and releases energy during the process of de-excited to the ground state. The decay of the fluorescence intensity of the excited state fluorophore can be expressed as a single exponential function by mathematical formula:
|
|
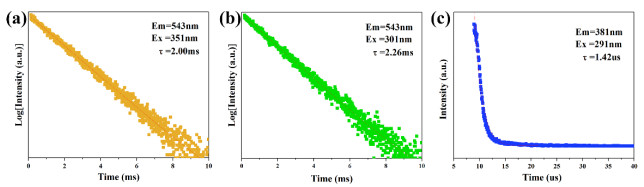
Among them, I(t) is the intensity measured at time t after the sample is excited by the light pulse; I0 is the intensity at t = 0; τ is the average fluorescence lifetime and is the characteristic value of the molecule, defined as t The time required for the fluorescence intensity to decay to 1/e of the initial value I0. According to this principle, we can calculate: The fluorescence lifetime of the C2T7 sample under excitation at 301 nm and emission at 543 nm is 2.26 ms. The fluorescence lifetime of the C2 sample upon 291 nm excitation and 381 nm emission is 1.42 µs. The fluorescence lifetime of the T7 sample under the conditions of excitation (301 nm) and emission (543 nm) is 2.00 ms. This composite Tb3+ ion has a slower decay characteristic than Ce3+ ion.
Fig. 8a illustrates the X-ray luminescence spectra of Tb3+ doped glass samples, from which we can see the position of the peak is consistent with that of the PL spectra. Meanwhile, the intensity of ray emission increases with raising the Tb3+ doping concentration. The strongest is the T7 sample, which is also consistent with the PL spectrum. Fig. 8c clearly compares the X-ray emission intensity of different samples with BGO crystals. It is not difficult to find that Ce3+/Tb3+ co-doped glass sample has a significant increase in ray intensity compared to the Tb3+ doped one, with the peak intensity increased by 0.8 times. In addition, the peak intensity of the C2T7 sample is 1.97 times that of BGO crystal but the peak integrated area is only 0.32 times that of BGO crystal. Fig. 8c shows the sensitivity curves of C2T7 samples, and BGO and LYSO crystals. As the X-ray dose rate increases, the X-ray intensity of them all increases linearly. The comparison of the slope K is KLYSO > KC2T7 > KBGO. Through the fitting results, the values of K are 4.647, 1.816 and 1.064, respectively. The fitting equations are yLYSO = 2767 + 4.647x, yC2T7 = –1517 + 1.816x, and yBGO = –1287 + 1.064x, respectively. Therefore, our cerium-terbium double-doped glass has higher X-ray sensitivity than BGO crystals. As we all know, the higher the sensitivity of the scintillation material, the higher the imaging resolution, the smaller the radiation dose required, and the less radiation damage to human body. Therefore, our cerium-terbium double-doped glass will be a scintillating glass material with high sensitivity and high ray response.
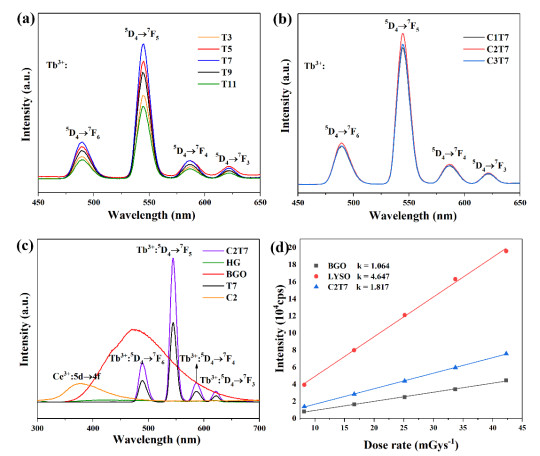
Fig. 9a illustrates the schematic diagram of the principle of X-ray imaging. We built an uncomplicated X-ray imaging platform with ray source (MagProTUB0014), imaging objects, C2T7 glass, digital cameras and laptops. X-ray imaging is mainly based on the ability of scintillating materials to transit from the valence band to the conduction band under the radiation of high-energy rays to form electron-to-face pairs. The electrons recombine with the mixture and release energy in the form of photons. Traditional scintillation detectors are mainly composed of scintillators, light collection components and photoelectric conversion devices. The horizontal lines are arranged. The role of the lead box is to conduct radiation to prevent the damage to human body, also avoiding the influence of natural light on the experiment.
First the ray hits the object, then passes through the C2T7 scintillation glass, and finally the camera captures and takes a video. Because different components in the object have inconsistent ray cut-off capabilities, the intensity of the rays at different positions after passing through the object is different, which causes the luminous brightness of the scintillation glass to change, so it can be imaged. At the top of Fig. 9b is the Type 81 spatial resolution test card, which reflects the inherent spatial resolution of X-ray imaging, and its X-ray imaging picture at a dose rate of 42.29 mGy·s-1. As can be seen from Fig. 9b, our scintillation glass imaging resolution has reached 7.0 lp/mm. At the same time, we also took the common plastic wires to do imaging experiments, and the results of the imaging photo can clearly see the internal metal wires wrapped in the plastic shell, which indicates that our scintillation glass has excellent spatial resolution. In addition, glass has the characteristics of easy availability, short preparation cycle, and large area glass preparation. Therefore, our scintillation glass will have great potential as a large area scintillation detector.
In summary, we prepared the oxyfluoride scintillation glass co-doped with cerium and terbium by the melt quenching method, which had high transmittance, high thermal stability and high density. Through the doping of cerium ions, the characteristic emission peak of terbium at 543 nm is significantly enhanced by 0.8 times. Moreover, the X-ray emission intensity of Ce3+/Tb3+ co-doped glass (C2T7) is 1.97 times that of BGO crystal, and the X-ray response sensitivity of C2T7 sample is 1.70 times that of BGO crystal. Furthermore, we used the prepared cerium-terbium co-doped scintillation glass for X-ray imaging, and the results showed that our glass has outstanding spatial resolution of 7.0 lp/mm at a dose rate of 42.29 mGy·s-1. It is expected to be a candidate material for large-area scintillation detectors. In the future, we will further conduct research on the preparation of detector devices.
Zanella, G.; Zannoni, R.; Dalligna, R. Nuclear instruments and methods in physics research section a: accelerators, spectrometers, detectors and associated equipment. Nucl. Instr. Meth. A 1994, 345, 198–201. doi: 10.1016/0168-9002(94)90987-3
Anderson, D. F. Properties of the high-density scintillator cerium fluoride. IEEE T. Nucl. Sci. 1989, 36, 137–140. doi: 10.1109/23.34420
Blasse, G. Scintillator materials. Chem. Mater. 1994, 6, 1465–1475. doi: 10.1021/cm00045a002
Murray, R. B.; Meyer, A. Scintillation response of activated inorganic crystals to various charged particles. Phys. Rev. 1961, 122, 815–826. doi: 10.1103/PhysRev.122.815
Liu, S.; Zheng, S. P.; Tang, C. M. Photoluminescence and radio luminescence properties of Yb3+-doped silica glass. Mater. Lett. 2015, 144, 43–45. doi: 10.1016/j.matlet.2015.01.005
Nguyen, L. Q.; Gabella, G.; Goldblum, B. L.; Laplace, T. A.; Carlson, J. S.; Brubaker, E.; Feng, P. L. Boron-loaded organic glass scintillators. Nucl. Instrum. Meth. A 2021, 988, 164898–7. doi: 10.1016/j.nima.2020.164898
Ortega-Alfaro, M. C.; Hernández, N.; Cerna, I.; López-Cortés, J. G.; Gómez, E.; Toscano, R. A.; Alvarez-Toledano, C. Novel dinuclear iron (0) complexes from α, β-unsaturated ketones β-positioned with sulfide and sulfoxide groups. J. Organomet. Chem. 2004, 689, 885‒893. doi: 10.1016/j.jorganchem.2003.12.015
Lecoq, P. On the stabilization of Ce, Tb, and Eu ions with different oxidation states in silica based glasses. J. Alloy. Compd. 2016, 809, 130–139.
Ronda, C.; Wieczorek, H.; Khanin, V.; Rodnyi, P. Review—scintillators for medical imaging: a tutorial overview. Ecs. J. Solid. State. Sc. 2016, 5, 3121–3125. doi: 10.1149/2.0131601jss
Wantana, N.; Kaewnuam, E.; Kim, H. J. X-ray/proton and photoluminescence behaviors of Sm3+ doped high density tungsten gadolinium borate scintillating glass. J. Alloy. Compd. 2020, 849, 156574–8. doi: 10.1016/j.jallcom.2020.156574
Lecoq, P. Development of new scintillators for medical applications. Nucl. Instrum. Meth. A 2016, 809, 130–139. doi: 10.1016/j.nima.2015.08.041
Lecoq, P.; Gektin, A.; Korzhik, M. Inorganic Scintillators for Detecting Systems. Springer International Publishing, Switzerland, 2017, p1–408.
Kawano, N.; Kawaguchi, N.; Okada, G. Scintillation and dosimetric properties of Ce-doped strontium aluminoborate glasses. J. Non-Cryst. Solids 2017, 030, 0022–3093.
Saidi, K.; Dammak, M. Crystal structure, optical spectroscopy and energy transfer properties in NaZnPO4: Ce3+, Tb3+ phosphors for UV-based LEDs. RSC Adv. 2020, 37, 21867–21875.
Yi, Z.; Lu, W.; Qian, C.; Zeng, T.; Yin, L. Urchin-like Ce/Tb co-doped GdPO4 hollow spheres for in vivo luminescence/X-ray bioimaging and drug delivery. Biomater. Sci. 2014, 10, 1404–1411.
Zhang, W.; Hua, R.; Qi, X.; Zhao, J.; Qin, L.; Liu, T. Photoluminescence properties and energy transfer of Ce3+–Tb3+ co-doped SrAlF5 nanorods by a hydrothermal method. CrystEngComm. 2017, 19, 5214–5222. doi: 10.1039/C7CE01054K
Liang, C.; Gong, X. H.; Huang, J. H. Preparation and spectroscopic properties of Pr3+-doped transparent glass-ceramic containing LiYF4 nanocrystals. Chin. J. Struct. Chem. 2017, 36, 614–620.
Zhang, H. D.; Wang, S. H.; Wu, S. F. A new copper coordination polymer with magnetic property based on 3-(1, 2, 4-traiazol-1-1-yl) benzoic acid. Chin. J. Struct. Chem. 2017, 036, 2011–1615.
Chen, J.; Wang, S. H.; Zhang, H. D. Crystal structure and luminescence with relative principles calculation of a new one-dimensional Zn(II) coordination polymer. Chin. J. Struct. Chem. 2017, 36, 711–715.
Liang, J. X.; Xin, S. L.; Qing, Q. H. Highly efficient eco-friendly X-ray scintillators based on an organic manganese halide. Nat. Commun. 2020, 11, 4329–7. doi: 10.1038/s41467-020-18119-y
Zhang, Y. H.; Sun, R. J.; Ou, X Y. Metal halide perovskite nanosheet for X-ray high-resolution scintillation-imaging screens. ACS Nano. 2019, 13, 2520–2525. doi: 10.1021/acsnano.8b09484
Cao, J. T.; Guo, Z.; Zhu, S. Preparation of lead-free two-dimensional-layered (C8H17NH3)2SnBr4 perovskite scintillators and their application in X-ray imaging. ACS Appl. Mater. Inter. 2020, 12, 19797–19804. doi: 10.1021/acsami.0c02116
Qiu, Z. H.; Wang, S. H.; Wang, W. Q. Polymer composites entrapped Ce-doped LiYF4 microcrystals for high-sensitivity X-ray scintillation and imaging. ACS. Appl. Mater. Inter. 2020, 12, 29835–29843.
Jin, H. H.; Dong, H. S. High-performance next-generation perovskite nanocrystal scintillator for nondestructive X-ray imaging. Adv. Mater. 2018, 1801743–6.

Figure 1 (a) Picture of flow chart of making glass experiment, (b) Picture of glass sample under sunlight and X-ray irradiation

Figure 2 UV-Vis spectra of host glass (HG), Ce3+ doped (C2), Tb3+ doped (T7) and Ce3+/Tb3+ co-doped (CT) transparent glass samples

Figure 3 XRD patterns of host glass (HG), Ce3+ doped (C2), Tb3+ doped (T5), and Ce3+/Tb3+ co-doped (C2T7) samples

Figure 5 Excitation and emission spectra of (a) host glass (HG), (b) Tb3+ doped glass (T7) (c) Ce3+ doped glass (d) Ce3+/Tb3+ co-doped glass (C2T7) samples

Figure 6 Emission spectrum of series doping concentration of (a) Tb3+ doped (T) glass samples, (b) Ce3+/Tb3+ co-doped (CT) glass samples; emission spectra under different excitation wavelengths of (c) T7 glass sample, (d) C2T7 glass sample

Figure 7 Fluorescence decay curve of (a) Tb3+ doped (T7), (b) Ce3+/Tb3+ co-doped (C2T7), (c) Ce3+ doped (C2) glass samples

Figure 8 XEL spectra at a dose rate of 42.29 mGys-1 of (a) Tb3+ single-doped glass samples, (b) Ce3+/Tb3+ co-doped glass samples, (c) HG, C2, T7 and C2T7 glass samples and BGO crystals; (d) XEL intensity at different radiation dose rates of BGO crystals, LYSO crystals and C2T7 glass sample

Figure 9 (a) Schematic diagram of X-ray excitation imaging, (b) objects in daylight and images imaged under X-ray irradiation
Table 1. Composition of Oxyfluoride Glass Samples
| 45SiO2-28Ga2O3-6Al2O3-0.5Sb2O3-14.5SrF2-6GdF3-xTb4O7-yCeO2 | ||||||||||
| Doping concentration (mol%) | ||||||||||
| Sample | HG | T3 | T5 | T7 | T9 | T11 | C1T7 | C2T7 | C3T7 | C2 |
| x | 1 | 3 | 5 | 7 | 9 | 11 | 7 | 7 | 7 | 0 |
| y | 0 | 0 | 0 | 0 | 0 | 0 | 1 | 2 | 3 | 2 |
 下载: 导出CSV
Table 2. Density Table of Glass Samples
| Sample | CeO2 (mol%) | Tb4O7 (mol%) | Density (g/cm3) |
| HG | 0 | 0 | 4.281 |
| C2 | 2 | 0 | 4.305 |
| T3 | 0 | 3 | 4.340 |
| T5 | 0 | 5 | 4.506 |
| T7 | 0 | 7 | 4.503 |
| T9 | 0 | 9 | 4.628 |
| T11 | 0 | 11 | 4.762 |
| C1T7 | 1 | 7 | 4.445 |
| C2T7 | 2 | 7 | 4.452 |
| C3T7 | 3 | 7 | 4.489 |
下载: 导出CSV

 扫一扫看文章

扫一扫关注我们

 下载:
下载: