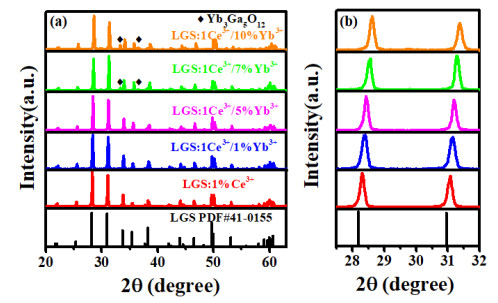
Figure 1.
(a) XRD patterns of Ce3+/Yb3+ doped LGS; (b) Main peaks of Ce3+/Yb3+ doped LGS in the range of 27.5°~32°

Solar cells have become more and more important in recent years because they could convert sunlight into electricity. And the photovoltaic market is dominated by crystalline silicon (c-Si) solar cells[1]. However, there is a mismatch between the solar spectrum (300~2500 nm) and silicon spectral response[2]. The strongest absorption of silicon solar cells is in a range of 800~1100 nm, but in the short wavelength region (especially in 300~500 nm), the response becomes weak because of higher reflection[3, 4]. Spectral mismatch leads to the theoretical conversion efficiency of solar cells only about 30%[5]. One feasible way to solve this problem is spectral modification by using down-conversion (DC) luminescent materials, which can convert high-energy photons to NIR photons[6].
At present, many DC phenomena from visible to NIR have been reported in RE/Yb3+ (RE = Tb3+, Pr3+, Tm3+, Ho3+) co-doped system[7-11]. Yb3+ ion is used as an acceptor which has an excited state at approximately 10000 cm-1, matching well with the band gap of crystalline silicon. However, the absorption of these RE sensitizer ions arises from the parity forbidden 4f-4f transitions, which is naturally small in cross section (merely 10-21 cm2) and narrow in bandwidth[12]. Unlike above RE ions, the absorption of Ce3+ is originated from the parity allowed 4f-5d electric-dipole transitions with a large cross section (about 10-18 cm2)[13, 14]. Besides, the excitation and emission wavelength of Ce3+ can be turned by the host materials, which means that choosing appropriate host materials can enhance the efficiency of DC[15]. The DC of Ce3+/Yb3+ co-doped has been reported in various hosts, such as YAG, phosphates, silicates, and borates[16-23].
La3Ga5SiO14 (LGS) has a trigonal structure with space group P321[24]. It belongs to the langasite family with the general formula A3BC3D2O14, in which La3+ occupies decahedral site (A), and Ga3+ occupies the octahedral (B) and tetrahedral (C) sites. The D site is shared equally by Si4+ and Ga3+[25]. Meanwhile, the material exhibits high thermal stability[26]. The LGS has been reported as a promising host for achieving red and NIR emitting in these years, such as LGS: Eu3+ and LGS: Er3+/Ce3+[25, 27]. However, Ce3+/Yb3+ co-doped LGS phosphor was rarely mentioned. Moreover, ions substitution is a useful means for modifying the properties of materials[28]. Reports of Al3+ replacing Ga3+ in LGS have focused on crystal growth and properties such as La3Ga3.5Al1.5SiO14, but not on La3Ga5-zAlzSiO14: Ce3+ phosphors[29, 30].
In this work, a NIR emission phosphor of Ce3+/Yb3+ co-doped LGS was synthesized by high-temperature solid-state reaction. The visible and NIR emission, decay lifetime, energy transfer efficiency, and energy transfer mechanism were studied. Besides, La3Ga5-zAlzSiO14 (z = 0, 1, 2, 3): Ce3+/Yb3+ phosphors were synthesized for the first time, and the influence of Al3+ ions on the luminescent properties was analyzed.
A series of (La1-xCex)3Ga5SiO14 (LGS: xCe3+, x = 0.5%, 0.8%, 1%, 1.5%, 2%), (La0.99-yCe0.01Yby)3Ga5SiO14 (LGS: 1%Ce3+/yYb3+, y = 1%, 3%, 5%, 7%, 10%), La3Ga5-zAlzSiO14 (z = 1, 2, 3, 4, 5): 1%Ce3+ and La3Ga5-zAlzSiO14: 1%Ce3+/5%Yb3+ (z = 1, 2, 3, 4, 5) phosphors were synthesized by high-temperature solid-state reaction with raw materials of high-purity La2O3, Ga2O3, Al2O3, SiO2, CeO2 and Yb2O3. The starting materials were weighted according to the stoichiometric ratio. Then the materials were mixed and ground in an agate mortar thoroughly. After that, the homogenous raw materials were transferred to an alumina crucible and sintered in air at 1450 ℃ for 20 h in a muffle furnace. After cooling to room temperature naturally, the products were ground to powders for further characterization.
X-ray diffraction (XRD) measurements were carried out on a MiniFlex 600 powder diffractometer with CuKα radiation (λ = 1.5405 Å) operating at 40 KV/15 mA. The scanning speed for phase determination was 0.2 °/min. The morphology and elemental analysis of the samples were recorded using a field emission scanning electron microscope (FESEM, SU-8010) equipped with an energy-dispersive spectrometer (EDS). The photoluminescence (PL) and excitation (PLE) spectra as well as decay curves were recorded by a spectrometer (Edinburgh Instruments, FLS 980) equipped with xenon lamps (450W) as exciting sources. Diffuse reflection spectra (DRS) of the power samples were measured by a spectrophotometer (Lambda 900) and using BaSO4 as a standard reference.
The recorded XRD patterns of LGS: xCe3+ (x = 0.5%, 0.8%, 1%, 1.5%, 2%) and LGS: 1%Ce3+/yYb3+ (y = 1%, 3%, 5%, 7%, 10%) phosphors are similar, so only several of them are shown in Fig. 1a for the sake of brevity. The XRD patterns of LGS: xCe3+ (x = 0.5%, 0.8%, 1%, 1.5%, 2%) and LGS: 1%Ce3+/yYb3+ (y = 1%, 3%, 5%) samples match well with the standard card of LGS (PDF #41-0155) and no impurity phases are observed. But for LGS: 1%Ce3+/yYb3+ (y = 7%, 10%), there is a little impurity identified as Yb3Ga5O12, indicating the end of the solubility range. Besides, it is obvious that the positions of two strong diffraction peaks shift slightly to higher angle at 2θ = 28.2° and 31° with the doping of Ce3+ and Yb3+ in Fig. 1b. According to the Bragg equation λ = 2dsinθ, the shift can be attributed to the smaller radii of Ce3+ (RCe3+ = 1.28 Å for CN = 8) and Yb3+ (RYb3+ = 1.12 Å for CN = 8) than that of La3+ (RLa3+ = 1.30 Å for CN = 8). These results indicate that single-phase phosphors are obtained and Ce3+/Yb3+ ions enter the host lattice.
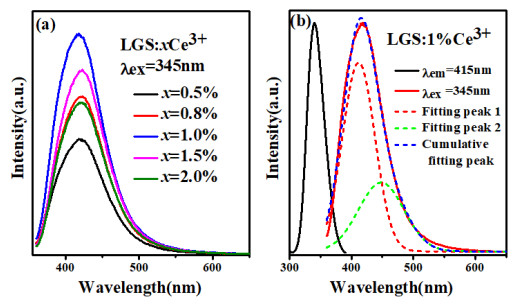
The PL spectra of Ce3+ singly doped LGS under excitation at 345 nm are shown in Fig. 2a. The emission intensity increases initially and then decreases with the Ce3+ concentration from 0.5% to 2%, and it reaches a maximum value when the concentration is 1%. Therefore, 1% was chosen as the concentration of Ce3+ in Ce3+/Yb3+ co-doped LGS. Fig. 2b shows the PLE and PL spectra of LGS: 1%Ce3+. The PLE spectrum monitored at 415 nm exhibits strong excitation band peaking at 345 nm, which is assigned to the 4f-5d transition of Ce3+. Under excitation at 345 nm, the emission band peaking at 415 nm can be decomposed to two Gaussian bands centered at about 413 nm (24213 cm-1) and 450 nm (22222 cm-1), which are attributed to the transitions from the lowest 5d level to the double 4f ground levels (2F5/2 and 2F7/2) of Ce3+. The energy difference is 1991 cm-1, which is very close to the splitting of 4f ground state of Ce3+ (≈ 2000 cm-1)[31].
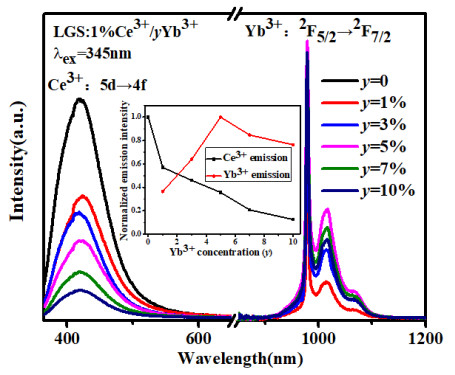
The PL spectrum of LGS: 1%Ce3+/yYb3+ (y = 0, 1%, 3%, 5%, 7%, 10%) under excitation at 345 nm is shown in Fig. 3. With the increase of Yb3+ concentration, the emission in visible region of Ce3+ decreases monotonously, and the NIR emission of Yb3+ occurs, which illustrates the energy transfer from Ce3+ to Yb3+. The inset of Fig. 3 shows integrated PL intensities of visible and NIR emissions versus Yb3+ concentrations. The NIR emission intensity of Yb3+ reaches a maximum value when y = 5%. The intensity starts to decrease when y is higher than 5% due to the concentration dependent fluorescence quenching among Yb3+ ions. Therefore, the optimal Yb3+ concentration is 5%.
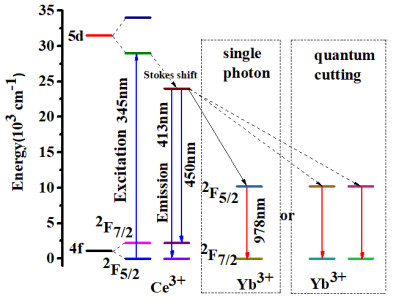
In order to determine the energy transfer mechanism of Ce3+→Yb3+ in LGS, the energy level diagrams with the possible energy transfer processes are shown in Fig. 4. Under ultraviolet excitation at 345 nm, the 4f ground state electron of Ce3+ is excited to higher 5d level, and then relaxes to the lowest 5d level without radiation. The transition from excited 5d level to 4f ground state can emit blue light or transfer its energy to Yb3+ ion. The emission of Ce3+: 5d→4f is located at approximately twice the energy of Yb3+: 2F5/2→2F7/2 emission, and there are no middle resonance energy levels between Ce3+ and Yb3+. Therefore, the energy transfer from Ce3+ to Yb3+ has two possible ways[6, 14], i.e. quantum cutting (QC) and single photon processes. In the former process, one excited Ce3+ ion transfers its energy to two Yb3+ ions nearby simultaneously, resulting in two NIR emitting photons (978 nm) of Yb3+ with a theoretical quantum efficiency up to 200%. While in the latter process, one excited Ce3+ ion only transfers its energy to one neighboring Yb3+ ion, and theoretical quantum efficiency is below 100%[16, 20].
For a single photon process, one Ce3+ ion transfers its energy to only one Yb3+ ion, so the energy transfer rate W should be proportional to Yb3+ concentration and written as Wsingle = Cy[32], where C represents the energy transfer coefficient and y is the concentration of Yb3+. For a quantum cutting process, however, one Ce3+ ion transfers its energy simultaneously to two nearby Yb3+ ions, so the energy transfer rate WQC = C'y2[33]. W can be obtained by[23]
|
|
(1) |
Where τ0 is the fluorescence lifetime of Ce3+ 5d level in Ce3+ singly doped LGS, and τ is that of Ce3+ in LGS: Ce3+/Yb3+. Fig. 5 shows the decay curves of Ce3+: 5d→4f emission at 415 nm in LGS: 1%Ce3+/yYb3+ (y = 0, 1%, 3%, 5%, 7% and 10%). It can be seen that the decay of Ce3+ becomes faster with the increase of Yb3+ concentration, and the lifetimes can be obtained by[6]
|
|
(2) |
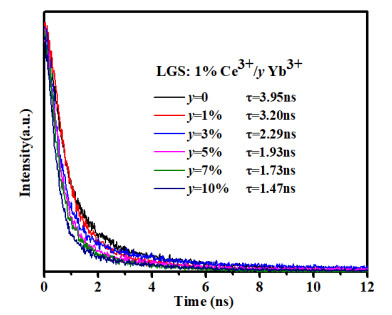
Where I(t) is the luminescence intensity of Ce3+ at time t. The results are shown in Fig. 5. It can be found that the fluorescence lifetime decreases from 3.95 to 1.47 ns with the increase of Yb3+ concentration from 0 to 10%, which also confirms the existence of energy transfer from Ce3+ to Yb3+.
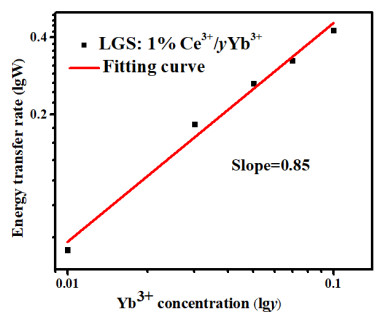
To judge the energy transfer mechanism from Ce3+ to Yb3+, the dependence of energy transfer rate W upon Yb3+ concentration was analyzed. The calculated energy transfer rate as a function of Yb3+ concentration is plotted in a double-logarithmic coordinate in Fig. 6. With the concentration of Yb3+ increasing from 1% to 10%, the slope is fitted to be 0.85 (close to 1), which indicates that the energy transfer from Ce3+ to Yb3+ is dominated by a single photon process rather than a quantum cutting process.
Based on the fluorescence lifetimes, the energy transfer efficiency η from Ce3+ to Yb3+ in LGS can be calculated by[23]
|
|
(3) |
Where τ and τ0 are the fluorescence lifetime of Ce3+ in the presence and absence of Yb3+, respectively. The calculated η values of the samples are exhibited in Table 1. With the increase of Yb3+ concentration from 0 to 10%, the energy transfer efficiency increases from 0 to 63%. At the optimal doping concentration (y = 5%), η reaches 51%. Table 2 shows the energy transfer efficiency of some reported materials under the optimal Ce3+/Yb3+ doping concentration. It can be seen that compared with other Ce3+/Yb3+ phosphors, the LGS has higher η under low Ce3+/Yb3+ doping concentrations. The result shows that LGS: 1%Ce3+/5%Yb3+ may have good application prospect in NIR down-conversion.
 DownLoad:
CSV
DownLoad:
CSV
| Yb3+ concentration (%) | η (%) |
| 0 1 3 5 7 10 |
0 19 42 51 56 63 |
DownLoad:
CSV
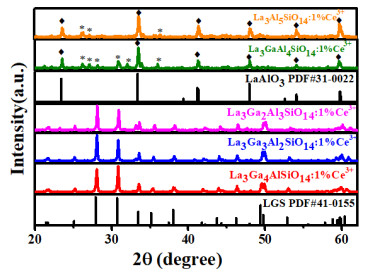
In order to investigate the effect of ion substitution on the luminescence properties of LGS: Ce3+/Yb3+, a series of La3Ga5-zAlzSiO14 (z = 1, 2, 3, 4, 5): 1%Ce3+ and La3Ga5-zAlzSiO14 (z = 1, 2, 3, 4, 5): 1%Ce3+/5%Yb3+ phosphors were synthesized. The XRD patterns of La3Ga5-zAlzSiO14: 1%Ce3+ and La3Ga5-zAlzSiO14: 1%Ce3+/5%Yb3+ are similar, so only those of La3Ga5-zAlzSiO14: 1%Ce3+ are shown in Fig. 7. When z = 1, 2 and 3, all XRD patterns of the samples match well with the standard card of LGS (PDF #41-0155). When z > 3, LaAlO3 phase and little impurities appear, indicating that the solid solubility limit of Al in La3Ga5-zAlzSiO14 (z = 1, 2, 3, 4, 5) is about 3. Since the phases are not pure at z = 4 and 5, they are not considered in the following research.
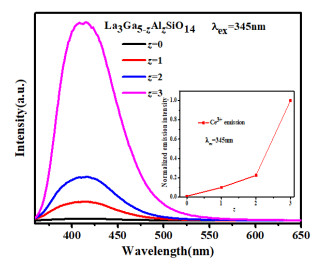
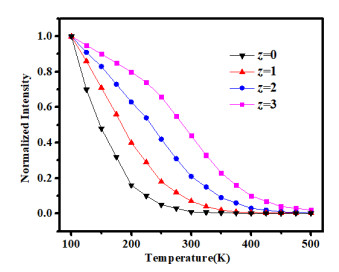
The PL spectra (λex = 345 nm) of La3Ga5-zAlzSiO14 (z = 0, 1, 2, 3): 1%Ce3+ are shown in Fig. 8. And the integral emission intensities for various compositions of Al3+ are compared in the inset. It can be seen that the emission intensity increases with the Al3+ ions in the host. In order to explore the reason for the increase of emission intensity with composition of Al3+ in La3Ga5-zAlzSiO14 (z = 0, 1, 2, 3): 1%Ce3+, their thermal stabilities were studied. The emission intensities versus temperature from 100 to 500 K for all samples (z = 0, 1, 2, 3) are shown in Fig. 9. The emission intensity is normalized by the one at 100 K. It can be seen that the thermal stability of the phosphors is better with higher composition of Al3+ in the host, which indicates that the energy threshold of the thermal nonradiative process increases with the composition of Al3+[34].
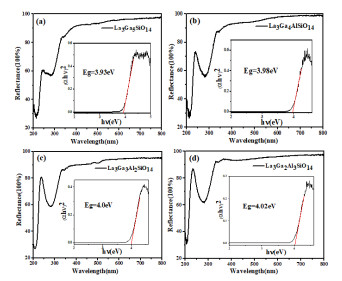
In general, there are two possible mechanisms to explain the thermal quenching of 5d1→4f luminescence in Ce3+ doped materials. The first mechanism is that Ce3+ ion is thermally excited from its 5d1 level to the host conduction band[35-38]. In this case, the relative position of the 5d1 level and the host conduction band are important. Hence the DRS of undoped La3Ga5-zAlzSiO14 (z = 0, 1, 2, 3) is shown in Fig. 10. In La3Ga5-zAlzSiO14 phosphors, the top of the valance band is formed by the O 2p states and the bottom by the La 5d states, and the upper is built up of the Ga 4p and Si 3p states[25]. In Fig. 10, the broad absorption band around 280 nm is attributed to the ligand O2- to La3+, and the absorption band around 210 nm to O2-→Ga3+/Si4+[39]. The band gap Eg can be estimated by[40]
|
|
(4) |
Where α is the absorption coefficient, hυ the incident photon energy (hυ = hc/λ), and A a proportional constant. The value of n depends on the type of inter-band transition: n = 1/2 for an indirect transition and n = 2 for a direct transition (n = 2 for LGS)[25]. The absorption coefficient α can be obtained via the Kubelka-Munk function[41]
|
|
(5) |
Where R is the observed reflectance in DRS. Using the data of DRS to figure out (αhυ)2 and hυ, the graph is drawn in the inset of Fig. 10. The straight part of the graph to the horizontal axis was extrapolated, and the intersection point is Eg[42]. It can be seen that Eg barely changes with the composition of Al3+ ions from z = 0 to z = 3 (3.93 eV for La3Ga5SiO14, 3.98 eV for La3Ga4AlSiO14, 4.0 eV for La3Ga3Al2SiO14 and 4.02 eV for La3Ga2Al3SiO14). Thus, the distance between the 5d1 level and the host conduction band is almost constant, indicating that thermal ionization is unlikely to be the reason for thermal quenching[43].
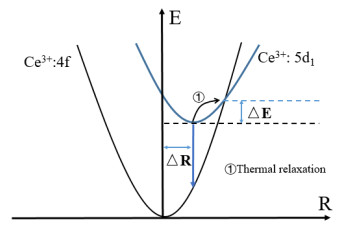
The second and more probably quenching mechanism is thermal relaxation from 5d1 level to the 4f ground level through the crossing point[35, 44], as shown in Fig. 11. ΔE is the energy separation from the bottom of 5d1 to the crossing point, and ΔR is the shift of the excited state potential energy surface occurring along the R axis upon excitation. The larger ΔR is, the smaller ΔE is, and the more easily the thermal quenching occurs[37]. And ΔR is associated with the rigidity of crystal structure. Normally, the more rigid the material is, the smaller ΔR is[45, 46]. In La3Ga5-zAlzSiO14 (z = 0, 1, 2, 3): 1%Ce3+ phosphors, replacing the larger Ga3+ with smaller Al3+ ion will increase the rigidity of the structure, thus reducing ΔR and making ΔE larger[43]. Therefore, the thermal quenching is more difficult to occur with the increase of Al3+ ion, and the emission intensity becomes stronger.
After the reason for the increase of emission from the Ce3+ doped La3Ga5-zAlzSiO14 (z = 0, 1, 2, 3) was clarified, La3Ga5-zAlzSiO14 (z = 0, 1, 2, 3): 1%Ce3+/5%Yb3+ phosphors were synthesized. The SEM morphology and EDS elemental analysis results of La3Ga2Al3SiO14: 1%Ce3+/5%Yb3+ phosphor are shown in Figs. 12 and 13. The SEM morphology in Fig. 12 shows that the sizes of the irregular particles are mainly ranging from 4 to 7 μm. The EDS measurement result in Fig. 13 confirms that the presence of La, Ga, Al, Si, O, Ce and Yb, and there is no other impurity peaks. These results demonstrate that well-crystallized La3Ga2Al3SiO14: 1%Ce3+/5%Yb3+ powders were obtained.
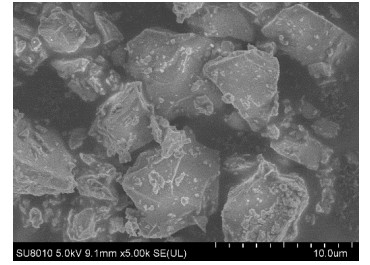
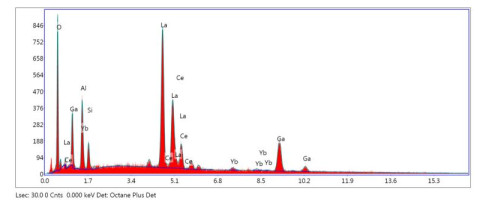
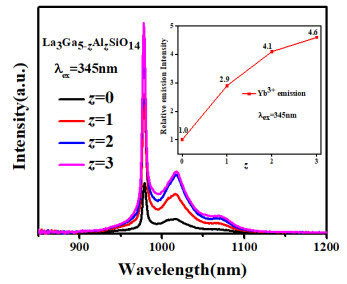
Fig. 14 shows the NIR emission spectra (λex = 345 nm) of Yb3+ in La3Ga5-zAlzSiO14 (z = 0, 1, 2, 3): 1%Ce3+/5%Yb3+. The inset is the integrated emission intensity. With the increase of Al3+ ions, NIR emission is enhanced. The NIR emission intensity of La3Ga2Al3SiO14: 1%Ce3+/5%Yb3+ is 4.6 times that of La3Ga5SiO14: 1%Ce3+/5%Yb3+. Therefore, replacing Ga3+ by Al3+ has a positive effect on the LGS: Ce3+/Yb3+ phosphor applied in solar cells.
A series of down-conversion materials LGS: xCe3+ (x = 0.5%, 0.8%, 1%, 1.5%, 2%), LGS: 1%Ce3+/yYb3+ (y = 1%, 3%, 5%, 7%, 10%), La3Ga5-zAlzSiO14 (z = 0, 1, 2, 3): 1%Ce3+ and La3Ga5-zAlzSiO14 (z = 0, 1, 2, 3): 1%Ce3+/5%Yb3+ have been successfully synthesized. The optimal doping concentrations of Ce3+ and Yb3+ are 1% and 5%, respectively, and the main emission of Yb3+ is around 978 nm, which matches well with the spectral response of c-Si solar cells. The photoluminescence properties and two possible energy transfer mechanisms were investigated. Through analyzing the dependence of energy transfer rate on Yb3+ concentration, the energy transfer from Ce3+ to Yb3+ occurs mainly by a single photon process rather than a quantum cutting. And the energy transfer efficiency reaches 51% in LGS: 1%Ce3+/5%Yb3+. In addition, the NIR emission of LGS: 1%Ce3+/5%Yb3+ was enhanced by replacing Ga3+ by Al3+, and the NIR emission intensity of the La3Ga2Al3SiO14: 1%Ce3+/5%Yb3+ is 4.6 times that of LGS: 1%Ce3+/5%Yb3+. The enhancement of emission can be explained by the thermal relaxation. These results indicate that La3Ga5-zAlzSiO14 (z = 0, 1, 2, 3): 1%Ce3+/5%Yb3+ phosphors are promising down-conversion materials for application in solar cells.
Ho, W. J.; Shen, Y. T.; Deng, Y. J.; Yeh, C. W.; Sue, R. S. Performance enhancement of planar silicon solar cells through utilization of two luminescent down-shifting Eu-doped phosphor species. Thin Solid Films 2016, 618, 141−145. doi: 10.1016/j.tsf.2016.03.063
Yu, D. C.; Rabouw, F. T.; Boon, W. Q.; Kieboom, T.; Ye, S.; Zhang, Q. Y.; Meijerink, A. Insights into the energy transfer mechanism in Ce3+-Yb3+ codoped YAG phosphors. Phys. Rev. B 2014, 90, 165126−7. doi: 10.1103/PhysRevB.90.165126
Aarts, L.; Van der Ende, B. M.; Meijerink, A. Downconversion for solar cells in NaYF4: Er, Yb. J. Appl. Phys. 2009, 106, 023522−6. doi: 10.1063/1.3177257
Strumpel, C.; McCann, M.; Beaucarne, G.; Arkhipov, V.; Slaoui, A.; Svrcek, V.; Del Canizo, C.; Tobias, I. Modifying the solar spectrum to enhance silicon solar cell efficiency-an overview of available materials. Sol. Energ. Mat. Sol. C 2007, 91, 238−249. doi: 10.1016/j.solmat.2006.09.003
Shockley, W.; Queisser, H. J. Detailed balance limit of efficiency of p-n junction solar cells. J. Appl. Phys. 1961, 32, 510−519. doi: 10.1063/1.1736034
Zhao, J.; Guo, C. F.; Li, T. Near-infrared down-conversion and energy transfer mechanism of Ce3+–Yb3+ co-doped Ba2Y(BO3)2Cl phosphors. Ecs. J. Solid State Sci. 2016, 5, R3055−R3058.
Bouajaj, A.; Belmokhtar, S.; Britel, M. R.; Armellini, C.; Boulard, B.; Belluomo, F.; Di Stefano, A.; Polizzi, S.; Lukowiak, A.; Ferrari, M.; Enrichi, F. Tb3+/Yb3+ codoped silica-hafnia glass and glass-ceramic waveguides to improve the efficiency of photovoltaic solar cells. Opt. Mater. 2016, 52, 62−68. doi: 10.1016/j.optmat.2015.12.013
Zhao, F.; Liang, Y.; Lee, J. B.; Hwang, S. J. Applications of rare earth Tb3+–Yb3+ co-doped down-conversion materials for solar cells. Mat. Sci. Eng. B-Adv. 2019, 248, 114404−4. doi: 10.1016/j.mseb.2019.114404
Taniguchi, M. M.; Zanuto, V. S.; Portes, P. N.; Malacarne, L. C.; Astrath, N. G. C.; Marconi, J. D.; Belancon, M. P. Glass engineering to enhance Si solar cells: a case study of Pr3+-Yb3+ codoped tellurite-tungstate as spectral converter. J. Non-Cryst. Solids 2019, 526, 119717−6. doi: 10.1016/j.jnoncrysol.2019.119717
Chang, W. X.; Li, L.; Dou, M. W.; Yan, Y. L.; Jiang, S.; Pan, Y.; Cui, M.; Wu, Z. J.; Zhou, X. J. Dual-mode downconversion luminescence with broad near-ultraviolet and blue light excitation in Tm3+/Yb3+ codoped oxy-fluoride glasses for c-Si solar cells. Mater. Res. Bull. 2019, 112, 109−114. doi: 10.1016/j.materresbull.2018.12.011
Yu, T.; Yu, D. C.; Lin, H. H.; Zhang, Q. Y. Single-band near-infrared quantum cutting of Ho3+–Yb3+ codoped KLu2F7 phosphors by energy clustering. J. Alloy. Compd. 2017, 695, 1154−1159. doi: 10.1016/j.jallcom.2016.10.242
Zhang, Q. H.; Wang, J.; Zhang, G. G.; Su, Q. UV photon harvesting and enhanced near-infrared emission in novel quantum cutting Ca2BO3Cl: Ce3+, Tb3+, Yb3+ phosphor. J. Mater. Chem. 2009, 19, 7088−7092. doi: 10.1039/b906954b
Chen, D. Q.; Wang, Y. S.; Yu, Y. L.; Huang, P.; Weng, F. Y. Quantum cutting downconversion by cooperative energy transfer from Ce3+ to Yb3+ in borate glasses. J. Appl. Phys. 2008, 104, 116105−4. doi: 10.1063/1.3040005
Li, J.; Chen, L.; Hao, Z. D.; Zhang, X.; Zhang, L. G.; Luo, Y. S.; Zhang, J. H. Efficient near-infrared down-conversion and energy transfer mechanism of Ce3+/Yb3+ codoped calcium scandate phosphor. Inorg. Chem. 2015, 54, 4806−4810. doi: 10.1021/acs.inorgchem.5b00280
Liu, Z. J.; Li, J. Y.; Yang, L. Y.; Chen, Q. Q.; Chu, Y. B.; Dai, N. L. Efficient near-infrared quantum cutting in Ce3+–Yb3+ codoped glass for solar photovoltaic. Sol. Energ. Mat. Sol. C 2014, 122, 46−50. doi: 10.1016/j.solmat.2013.10.030
Tai, Y. P.; Li, X. Z.; Du, X. G.; Pan, B. L.; Yuan, G. H. Broadband near-infrared quantum cutting by Ce–Yb codoped YAG transparent glass ceramics for silicon solar cells. RSC Adv. 2018, 8, 23268−23273. doi: 10.1039/C8RA04154G
Ueda, J.; Tanabe, S. Visible to near infrared conversion in Ce3+-Yb3+ Co-doped YAG ceramics. J. Appl. Phys. 2009, 106, 043101−6. doi: 10.1063/1.3194310
Zhao, L.; Han, L. L.; Wang, Y. H. Efficient near-infrared down-conversion in KCaGd(PO4)2: Ce3+, Yb3+. Opt. Mater. Express 2014, 4, 1456−1464. doi: 10.1364/OME.4.001456
Zhou, W. L.; Yang, J.; Wang, J.; Li, Y.; Kuang, X. J.; Tang, J. K.; Liang, H. B. Study on the effects of 5d energy locations of Ce3+ ions on NIR quantum cutting process in Y2SiO5: Ce3+, Yb3+. Opt. Express 2012, 20, A510−A518. doi: 10.1364/OE.20.00A510
Zhang, Q. H.; Ni, H. Y.; Lin, L. T.; Ding, J. M.; Ding, J. H.; Li, X. B. Communication-an intense broadband sensitized near-infrared emitting GdAl3(BO3)4: Ce3+, Yb3+ phosphor. ECS J. Solid State Sci. 2019, 8, R47−R49.
Wei, H. W.; Shao, L. M.; Jiao, H.; Jing, X. P. Ultraviolet and near-infrared luminescence of LaBO3: Ce3+, Yb3+. Opt. Mater. 2018, 75, 442−447. doi: 10.1016/j.optmat.2017.10.011
Chen, J. D.; Guo, H.; Li, Z. Q.; Zhang, H.; Zhuang, Y. X. Near-infrared quantum cutting in Ce3+, Yb3+ co-doped YBO3 phosphors by cooperative energy transfer. Opt. Mater. 2010, 32, 998−1001. doi: 10.1016/j.optmat.2010.01.040
Karunakaran, S. K.; Lou, C. G.; Arumugam, G. M.; Cao, H. H.; Pribat, D. Efficiency improvement of Si solar cells by down-shifting Ce3+ doped and down-conversion Ce3+–Yb3+ co-doped YAG phosphors. Sol. Energy 2019, 188, 45−50. doi: 10.1016/j.solener.2019.05.076
Takeda, H.; Kato, T.; Chani, V. I.; Morikoshi, H.; Shimamura, K.; Fukuda, T. Effect of (Sr, Ba) substitution in La3Ga5SiO14 and La3M0.5Ga5.5O14 (M = Nb5+, Ta5+) crystals on their synthesis, structure and piezoelectricity. J. Alloy. Compd. 1999, 290, 79−84. doi: 10.1016/S0925-8388(99)00203-0
Reinhardt, A.; Zych, A.; Kohler, I.; Albert, B. Disordered langasites La3Ga5MO14: Eu3+ (M = Si, Ge, Ti) as red-emitting LED phosphors. Dalton. T. 2018, 47, 5703−5713. doi: 10.1039/C8DT00671G
Uda, S.; Wang, S. Q.; Konishi, N.; Inaba, H.; Harada, J. Growth technology of piezoelectric langasite single crystal. J. Cryst. Growth 2005, 275, 251−258. doi: 10.1016/j.jcrysgro.2004.10.099
Wang, Q. G.; Su, L. B.; Li, H. J.; Zheng, L. H.; Xu, X. D.; Tang, H. L.; Jiang, D. P.; Wu, F; Xu, J. Spectroscopic properties of Er/Ce-codoped La3Ga5SiO14. Chin. Phys. B 2012, 21, 386−392.
Marimuthu, N.; Parasurman, R.; Rathnakumari, M.; Kumar, P.; Upadhyay, R. Synthesis and transport properties of Al substituted langasite ceramics. J. Mater. Sci. -Mater. E 2018, 29, 1280−1288. doi: 10.1007/s10854-017-8033-9
Takeda, H.; Kumatoriya, M.; Shiosaki, T. Effect of aluminum substitution in La3Ga5SiO14 crystals on their structure and piezoelectricity. Appl. Phys. Lett. 2001, 79, 4201−4203. doi: 10.1063/1.1426274
Kumatoriya, M.; Sato, H.; Nakanishi, J.; Fujii, T.; Kadota, M.; Sakabe, Y. Crystal growth and electromechanical properties of Al substituted langasite (La3Ga5-xAlxSiO14). J. Cryst. Growth 2001, 229, 289−293. doi: 10.1016/S0022-0248(01)01152-6
Zhao, J. X.; Liang, Y. N.; Guan, L.; Wang, G. Q.; Ma, J. X.; Dong, G. Y.; Wang, F. H.; Wang, D. W.; Li, X. From blue to cyan emission: Ce3+ and Tb3+ co-doped silicon phosphate phosphors with high thermal stability. Phys. Chem. Chem. Phys. 2020, 22, 9405−9414. doi: 10.1039/D0CP00059K
Xiang, G. T.; Zhang, J. H.; Hao, Z. D.; Zhang, X.; Pan, G. H.; Luo, Y. S.; Lu, S. Z.; Zhao, H. F. The energy transfer mechanism in Pr3+ and Yb3+ codoped β-NaLuF4 nanocrystals. Phys. Chem. Chem. Phys. 2014, 16, 9289−9293. doi: 10.1039/C4CP01184H
Wu, D.; Dong, X. L.; Xiao, W. G.; Hao, Z. D.; Zhang, J. H. Efficient visible-to-NIR spectral conversion for polycrystalline Si solar cells and revisiting the energy transfer mechanism from Ce3+ to Yb3+ in Lu3Al5O12 host. Inorg. Chem. 2019, 58, 234−242. doi: 10.1021/acs.inorgchem.8b02304
Ogieglo, J. M.; Katelnikovas, A.; Zych, A.; Juestel, T.; Meijerink, A.; Ronda, C. R. Luminescence and luminescence quenching in Gd3(Ga, Al)5O12 scintillators doped with Ce3+. J. Phys. Chem. A 2013, 117, 2479−2484. doi: 10.1021/jp309572p
Zhu, S. Q.; Zhang, X. Y.; Li, W. Y.; Liu, M. Y.; Cheng, L. Q.; Mi, X. Y.; Lu, P. Y. Phase transformation and luminescence properties of Y2.94Al5-xGaxO12: 0.06Ce3+ phosphors. Ceram. Int. 2019, 45, 4964−4971. doi: 10.1016/j.ceramint.2018.11.196
Ueda, J.; Tanabe, S.; Nakanishi, T. Analysis of Ce3+ luminescence quenching in solid solutions between Y3Al5O12 and Y3Ga5O12 by temperature dependence of photoconductivity measurement. J. Appl. Phys. 2011, 110, 053102−7. doi: 10.1063/1.3632069
Zhou, Y. N.; Zhuang, W.; Hu, Y. S.; Liu, R.; Xu, H. B.; Chen, M. Y.; Liu, Y. H.; Li, Y. F.; Zheng, Y. L.; Chen, G. T. Cyan-green phosphor (Lu2M)(Al4Si)O12: Ce3+ for high-quality led lamp: tunable photoluminescence properties and enhanced thermal stability. Inorg. Chem. 2019, 58, 1492−1500. doi: 10.1021/acs.inorgchem.8b03017
Denault, K. A.; Brgoch, J.; Gaultois, M. W.; Mikhailovsky, A.; Petry, R.; Winkler, H.; DenBaars, S. P.; Seshadri, R. Consequences of optimal bond valence on structural rigidity and improved luminescence properties in SrxBa2-xSiO4: Eu2+ orthosilicate phosphors. Chem. Mater. 2014, 26, 2275−2282. doi: 10.1021/cm500116u
Itoh, M.; Takagi, S.; Kitaura, M.; Fujita, M.; Endo, N. Luminescence properties of piezoelectric single crystals with langasite structure. J. Lumin. 2007, 122, 205−207.
Cao, G.; Rabenberg, L. K.; Nunn, C. M.; Mallouk, T. E. Formation of quantum-size semiconductor particles in a layered metal phosphonate host lattice. Chem. Mater. 1991, 3, 149−156. doi: 10.1021/cm00013a032
Zeng, W.; Wang, Y. H.; Han, S. C.; Chen, W. B.; Li, G.; Wang, Y. Z.; Wen, Y. Design, synthesis and characterization of a novel yellow long-persistent phosphor: Ca2BO3Cl: Eu2+, Dy3+. J. Mater. Chem. C 2013, 1, 3004−3011. doi: 10.1039/c3tc30182f
Geng, W. Y.; Zhou, X. F.; Ding, J. Y.; Li, J.; Wang, Y. H. K7Ca9(Si2O7)4F: Ce3+: a novel blue-emitting phosphor with good thermal stability for ultraviolet-excited light emitting diodes. J. Mater. Chem. C 2017, 5, 11605−11613. doi: 10.1039/C7TC02561K
Hermus, M.; Phan, P. C.; Duke, A. C.; Brgoch, J. Tunable optical properties and increased thermal quenching in the blue-emitting phosphor series: Ba2(Y1-xLux)5B5O17: Ce3+ (x = 0~1). Chem. Mater. 2017, 29, 5267−5275. doi: 10.1021/acs.chemmater.7b01416
Ueda, J.; Aishima, K.; Tanabe, S. Temperature and compositional dependence of optical and optoelectronic properties in Ce3+-doped Y3Sc2Al3-xGaxO12 (x = 0, 1, 2, 3). Opt. Mater. 2013, 35, 1952−1957. doi: 10.1016/j.optmat.2012.11.016
Setlur, A. A.; Shiang, J. J.; Hannah, M. E.; Happek, U. Phosphor quenching in LED packages: measurements, mechanisms, and paths forward. Proc. SPIE 2009, 7422, 74220E−74228E. doi: 10.1117/12.829136
Tian, Y. Development of phosphors with high thermal stability and efficiency for phosphor-converted LEDs. J. Sol. State Light. 2014, 1, 1−15. doi: 10.1186/2196-1107-1-1

Figure 1 (a) XRD patterns of Ce3+/Yb3+ doped LGS; (b) Main peaks of Ce3+/Yb3+ doped LGS in the range of 27.5°~32°

Figure 2 (a) PL spectra of LGS: xCe3+ (x = 0.5%, 0.8%, 1%, 1.5%, 2%); (b) PLE and PL spectra of LGS: 1%Ce3+

Figure 3 Visible and NIR emission spectra of LGS: 1%Ce3+/yYb3+ (y = 0, 1%, 3%, 5%, 7%, 10%) under excitation at 345 nm

Figure 5 Decay curves of Ce3+: 5d level in LGS: 1%Ce3+/yYb3+ (y = 0, 1%, 3%, 5%, 7%, 10%)

Figure 6 Fitting line (log-log) of the energy transfer rate versus the Yb3+ concentration in LGS: 1%Ce3+/yYb3+ (y = 1%, 3%, 5%, 7%, 10%)

Figure 9 Normalized temperature-dependent integrated emission intensity of La3Ga5-zAlzSiO14 (z = 0, 1, 2, 3): 1%Ce3+ between 100 and 500 K (λex = 345 nm)

Figure 10 Diffuse reflectance spectra (DRS) of (a) La3Ga5SiO14; (b) La3Ga4AlSiO14; (c) La3Ga3Al2SiO14; (d) La3Ga2Al3SiO14
Table 1. Energy Transfer Efficiency (η) of LGS: 1%Ce3+/yYb3+ (y = 0, 1%, 3%, 5%, 7%, 10%)
| Yb3+ concentration (%) | η (%) |
| 0 1 3 5 7 10 |
0 19 42 51 56 63 |
 下载: 导出CSV

 扫一扫看文章

扫一扫关注我们


 下载:
下载: