Figure 1.
Structural formulas for (a) H5DCOTBC, (b) phen, and (c) H4DCODBC

Syntheses, structures, fluorescence properties, and applications of two Cd-based metal-organic framework materials based on polycarboxylic acids
Jiaojiao CHEN , Gaiyan GUO , Hua YANG , Shuo LIU , Lulu DONG , Xiaoli CHEN , Huali CUI , Jijiang WANG


With the rapid development of industrial production, nitroaromatic explosives, antibacterial agents, and agricultural chemicals have rapidly entered our daily lives. These compounds greatly facilitate our lives, but due to the large use and emission of these compounds, they also cause great environmental pollution[1].
As versatile industrial feedstocks, nitroaromatic compounds find extensive application in the manufacture of dyestuffs, flavor additives, agrochemicals, and pharmaceutical products[2]. However, the structure of these compounds is stable, not easy to degrade, and their random emissions have brought serious environmental pollution and safety concerns[3-5]. For example, 4-nitrophenol is an isomer produced by hydrolyzing insecticides and is carcinogenic at concentrations as low as 20 μg·kg-1. As important components of bioactive molecules and chromophores, 2,4,6-trinitrophenol congeners display acute cellular toxicity with IC50 values approximating 1 mg·L-1[6]. The United States Environmental Protection Agency (USEPA) specifies a maximum allowable contaminant threshold of 0.1 mg·L-1 for industrial effluent discharges. Therefore, it is necessary to realize the trace detection of the compound.
Agricultural intensification has greatly increased crop yields and alleviated the problem of food shortages related to population expansion. However, the excessive use of pesticides has increased the pollution risk of the ecosystem. For example, nitrogen-organic pesticides act as plant growth regulators and as fruit and vegetable herbicides, and are absorbed through plant tissues[7]. But when there are low levels of exposure, it can also lead to decreased immunity, allergic reactions, kidney failure, central nervous system toxicity, and cancer. It is more harmful to pregnant women and can lead to fetal malformations and genetic mutations.
Antibiotics are drugs derived from microorganisms that can eradicate or control the pathogenesis of bacteria from the symptoms[8]. Antibiotic therapeutics have revolutionized modern medicine, preventing millions of fatalities from bacterial pathogens including Mycobacterium tuberculosis, Pneumococcal infections, Meningococcal disease, and other lethal disorders. Thereby, establishing these compounds as indispensable weapons against life-threatening illnesses[9]. However, the excessive use of antibacterial drugs has triggered environmental and public health crises, such as ecological degradation and the gradual increase of bacterial resistance.
In environmental and drug analysis, the main separation and detection methods for nitro-aromatic pollutants, pesticide pollutants and antibiotic residues include HPLC, GC-MS and supercritical fluid chromatography (SFC) systems[10]. Compared with other methods, these techniques offer sub-ppb detection limits with quantitative accuracy, and facilitate the simultaneous determination of multiple analytes in complex systems. However, chromatography also has the disadvantage of being costly and complex to operate. These limitations have hindered the wide application of chromatography technology in on-site rapid monitoring applications. Therefore, research and development of analytical detection techniques for environmental contaminants is a very important and urgent task.
Metal-organic framework (MOF) materials are crystalline porous materials self-assembled by metal ions or metal clusters and organic ligands through coordination bonds, featuring a periodic network structure. They have been widely used in separation[11], catalysis[12], sensing[13-15], biomedicine[16-17], and other fields due to their large specific surface area[18], excellent thermal stability, adjustable structure, and abundant active sites[19]. But the structural and functional properties of MOFs are influenced by multiple factors, such as the selection of metal centers, the choice of organic ligands, and synthetic conditions (pH, temperature, solvent selection)[20].
The Cd2+ ions with the d10 configuration enhance the stability of the coordination structure and the luminescence behavior. Aromatic polycarboxylic acids serve as ideal MOF building blocks due to their multidentate binding capacity, tunable coordination flexibility, and ability to generate topological variety. Based on this, we selected 4-[(3,4-dicarboxyphenyl)oxy]benzene-1,2,3-tricarboxylic acid (H5DCOTBC) (Fig. 1a) as the main ligand, 1,10-phenanthroline (phen) as the auxiliary ligand (Fig. 1b), and Cd(Ⅱ) as the central metal to prepare MOFs. Two new MOFs, {[Cd2(DCODBC)(phen)2]·3H2O}n (1) (H4DCODBC=4,4′-oxydibenzene-1,2-dicarboxylic acid) and {[Cd5(DCOTBC)5(H2O)8]·2H2O}n (2), were successfully synthesized under solvent thermal conditions. Among them, 1 represents a 2D planar configuration, and 2 represents a 3D grid configuration. The structure and thermal stability were characterized by IR, powder X-ray diffraction (PXRD), thermogravimetric analysis (TG), single-crystal X-ray diffraction, and elemental analysis. It is worth noting that H5DCOTBC is decarboxylated during the synthesis of 1, which is denoted as H4DCODBC (Fig. 1c). To assess potential sensing applications, luminescent characteristics of materials 1 and 2 were comprehensively evaluated. Photoluminescence analysis indicated that 1 and 2 have good fluorescence properties and can be used to detect nitrobenzene (NB) and 2,4,6-trinitrophenol (TNP), respectively. In addition, both 1 and 2 could be used to detect tetracycline (TC) and fluazinam (FLU) at the mmol·L-1 level. To evaluate the applicability of the real sample, using 1 and 2 as the fluorescent probes, the residual amount of FLU in the apple peel matrix was quantitatively determined by the labeling recovery method. Finally, the detection mechanisms of the fluorescent probes for 1 and 2 were discussed.
Reagents, instruments, and details of synthesis and characterization can be found in the Supporting information.
The crystals of 1 and 2 with regular shapes, transparent colors, and appropriate sizes were selected and placed in a single-crystal diffractometer. Diffraction data were collected at room temperature using a Bruker Smart APAPEX Ⅱ CCD diffractometer with Cu Kα radiation (λ=0.154 18 nm) or Mo Kα radiation (λ=0.071 073 nm). After the data were initially restored by the instrument′s accompanying software, the SADABS program was used for empirical absorption correction. The crystal structure was analyzed by the direct method and refined by the full matrix least squares method based on F2 using the SHELXTL 2014/2016 package. Non-hydrogen atoms were refined using anisotropic displacement parameters, while hydrogen atoms on organic ligands were treated by geometric hydrogenation. The detailed crystallographic data are listed in Table 1, and the selected bond lengths and angles are listed in Table 2 and 3.

 下载:
导出CSV
下载:
导出CSV
| Parameter | 1 | 2 |
| Empirical formula | C40H52Cd2N4O24 | C34H30Cd5O32 |
| Formula weight | 1 197.65 | 1 512.58 |
| Temperature / K | 296(2) | 296.15 |
| Crystal system | Monoclinic | Monoclinic |
| Space group | P2/c | C2/c |
| a / nm | 1.023 4(5) | 2.373 7(16) |
| b / nm | 1.245 9(6) | 1.012 9(7) |
| c / nm | 1.713 7(8) | 1.987 5(13) |
| β / (°) | 98.986(9) | 113.742(9) |
| Volume / nm3 | 2.158 2(18) | 4.374(5) |
| Z | 2 | 4 |
| Dc / (g·cm-3) | 1.843 | 2.297 |
| μ / mm-1 | 1.085 | 2.501 |
| F(000) | 913.16 | 2 920 |
| 2θ range / (°) | 1.634-25.500 | 2.309-24.997 |
| Reflection collected | 10 879 | 9 404 |
| Data, Nres, Npara | 3 996, 0, 270 | 3 654, 0, 321 |
| Index ranges | -9 ≤ h ≤ 12, -14 ≤ k ≤ 14, -20 ≤ l ≤ 18 | -15 ≤ h ≤ 28, -12 ≤ k ≤ 12, -23 ≤ l ≤ 22 |
| Final R indexes [I≥2σ(I)]b | R1=0.054 7, wR2=0.144 1 | R1=0.037 3, wR2=0.088 7 |
| Final R indexes (all data) | R1=0.089 6, wR2=0.159 1 | R1=0.050 5, wR2=0.096 7 |
| GOF | 0.949 | 1.097 |
| a Nres=number of restraints, Npar=number of parameters; b R1=∑||Fo|-|Fc||/∑|Fo|, wR2={∑[w(|Fo|2-|Fc|2)2]/∑[w(|Fo|2)2]}1/2. | ||
下载:
导出CSV
| Cd1—O4A | 0.221 7(5) | Cd1—O3B | 0.227 3(4) | Cd1—N1 | 0.229 6(6) |
| Cd1—N2 | 0.231 7(6) | Cd1—O2 | 0.235 2(5) | Cd1—O1 | 0.241 9(5) |
| O3—Cd1B | 0.227 3(4) | O4—Cd1C | 0.221 7(5) | ||
| O4A—Cd1—N1 | 175.62(19) | O4A—Cd1—O3B | 91.60(2) | O4A—Cd1—N2 | 109.10(2) |
| O3B—Cd1—N1 | 84.40(2) | N1—Cd1—N2 | 71.80(2) | O3B—Cd1—N2 | 119.71(18) |
| O3B—Cd1—O2 | 95.96(16) | O4A—Cd1—O2 | 89.38(19) | N2—Cd1—O2 | 138.24(17) |
| N1—Cd1—O2 | 92.62(19) | O3B—Cd1—O1 | 151.01(17) | O4A—Cd1—O1 | 88.47(18) |
| N2—Cd1—O1 | 87.41(17) | N1—Cd1—O1 | 95.87(19) | O2—Cd1—O1 | 55.05(16) |
| Symmetry codes: A: x, -y, z+1/2; B: -x+2, -y, -z+1; C: x, -y, z-1/2; D: -x+1, y, -z+1/2. | |||||
下载:
导出CSV
| Cd1—O1A | 0.230 8(4) | Cd1—O1 | 0.230 8(4) | Cd1—O8B | 0.233 2(4) |
| Cd1—O8C | 0.233 2(4) | Cd1—O15A | 0.229 8(5) | Cd1—O15 | 0.229 8(5) |
| Cd2—O4D | 0.228 5(5) | Cd2—O5 | 0.221 1(4) | Cd2—O6 | 0.239 2(6) |
| Cd2—O7 | 0.232 6(5) | Cd2—O11E | 0.234 6(4) | Cd2—O12E | 0.237 2(4) |
| O1A—Cd1—O1 | 172.90(2) | O1A—Cd1—O8B | 75.00(14) | O1A—Cd1—O8C | 99.53(14) |
| O1—Cd1—O8B | 99.53(14) | O1—Cd1—O8C | 75.00(14) | O8C—Cd1—O8B | 81.70(2) |
| O15A—Cd1—O1 | 99.52(17) | O15—Cd1—O1A | 99.53(17) | O15A—Cd1—O1A | 84.24(18) |
| O15—Cd1—O1 | 84.24(18) | O15—Cd1—O8B | 84.70(2) | O15A—Cd1—O8C | 84.70(2) |
| O15—Cd1—O8C | 152.86(18) | O15A—Cd1—O8B | 152.87(18) | O15A—Cd1—O15 | 116.30(3) |
| O4D—Cd2—O6 | 75.20(2) | O4D—Cd2—O7 | 84.30(2) | O4D—Cd2—O11E | 122.72(16) |
| O4D—Cd2—O12E | 108.06(16) | ||||
| Symmetry codes: A: -x+1, y, -z+1/2; B: x-1/2, -y+3/2, z-1/2; C: -x+3/2, -y+3/2, -z+1; D: -x+3/2, y-1/2, -z+3/2; E: x, -y+1, z+1/2. | |||||
Single-crystal X-ray diffraction analysis reveals that compound 1 crystallizes in the monoclinic system with space group P2/c. The asymmetric unit consists of one completely independent Cd2+ ion, a DCODBC4- ligand, two phen molecules, and three free water molecules.
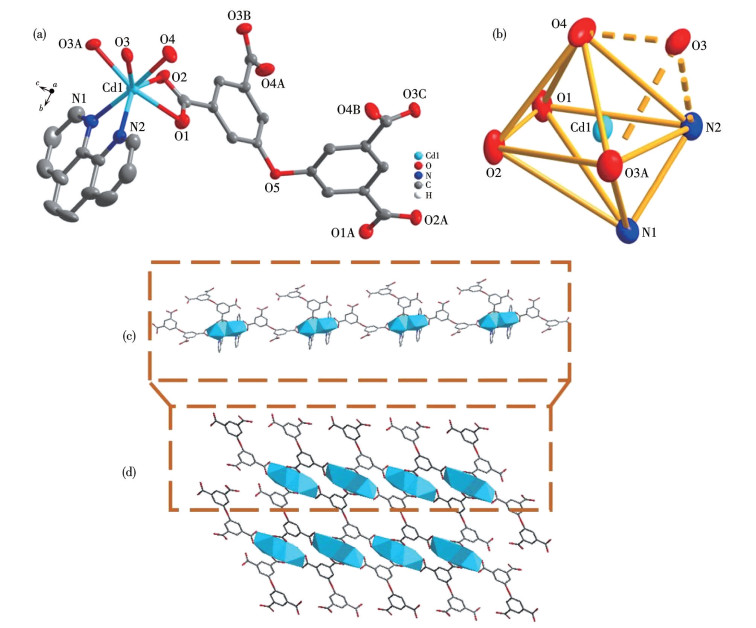
Cd1 coordinates with five oxygen atoms (O1, O2, O3, O4, O3A) from three DCODBC4- ligands and two nitrogen atoms (N1, N2) from phen ligands to form capped octahedron (Fig. 2a). Among them, O4 and N1 are located longitudinally on the octahedron, O1, O2, O3A and N2 are located on the equatorial plane of the octahedron, and O3 forms a hat (Fig. 2b). The bond length of the Cd—O bond ranges from 0.221 7(56)-0.241 8(48) nm, and the bond length of the Cd—N bond ranges from 0.229 6(63)-0.231 7(63) nm, which are consistent with that reported in the literature[21]. In 1, the H4DCODBC ligand is completely deprotonated, showing the μ6-κ2∶κ2∶κ2∶κ2∶κ1∶κ1 coordination pattern (Fig.S1).
The ellipsoidal probability is 30%; Symmetry codes: A: x, -y, z+1/2; B: -x+2, -y, -z+1; C: x, -y, z-1/2.
In 1, the two Cd atoms form a small unit that acts as the building block, each of which is connected by carboxyl oxygen atoms (O1, O2) on DCODBC4- to form a chain structure, as shown in Fig. 2c. The Cd atom units on one chain are connected to the Cd atom units on the other chain by O3, and O4 on the DCODBC4- ligand, forming a 2D plane (Fig. 2d).
The X-ray diffraction results of single crystals show that 2 belongs to the monoclinic crystal system, the space group is C2/c, and each asymmetric unit contains three crystal-independent Cd2+, two DCOTBC5- ligands, eight coordinated water molecules, and two free water molecules.
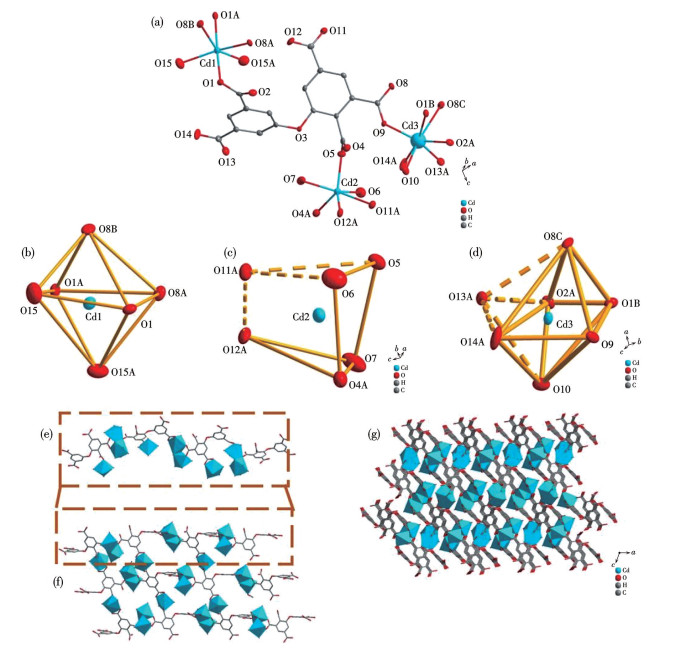
Cd1 coordinates with four oxygen atoms (O1, O1A, O8A, O8B) from three DCOTBC5- and oxygen atoms (O15, O15A) from two water to form a distortion octahedral configuration (Fig. 3a), where O8B, O15A are located in the octahedral longitudinal direction and O1, O1A, O8A, O15 are located in the octahedral plane (Fig. 3b). Cd2 coordinates with four oxygen atoms (O4A, O5, O11A, O12A) from three DCOTBC5- ligands and oxygen atoms (O6, O7) from two coordination water molecules to form a triangular prismatic configuration (Fig. 3a), where O4A, O5, O6, O7 form the sides of the triangular prism, O11A, O5, O6 form the upper surface of the triangular prism, and O12A, O4A, O7 form the lower bottom surface of the triangular prism (Fig. 3c). Cd3 coordinates with seven oxygen atoms (O1B, O2A, O8C, O9, O10, O13A, O14A) from three DCOTBC5- ligands to form a cap octahedral configuration, where O8C, O10 are located in the octahedral longitudinal direction, O1B, O2A, O14A, O9 are located in the octahedral plane, and O13A forms a cap shape (Fig. 3d). The bond lengths of Cd—O bonds range from 0.221 1(51) to 0.254 9(44) nm, which are consistent with the reported value[22]. In 2, the DCOTBC5- ligand is completely deprotonated, exhibiting a μ9-κ2∶κ2∶κ1∶ κ1∶κ1∶κ1∶κ1∶κ1∶κ1 coordination pattern (Fig.S2).
The ellipsoidal probability is 30%; Symmetry codes: A: -x+1, y, -z+1/2, B: x-1/2, -y+3/2, z-1/2, C: -x+3/2, -y+3/2, -z+1, D: -x+3/2, y-1/2, -z+3/2.
In 2, the Cd1, Cd2, and Cd3 atoms form a small unit, which serves as a core. Each building unit is connected by carboxyl oxygen atoms (O8, O9) from the DCOTBC5- ligand, forming a chain-like structure (Fig. 3e). Between chains, the Cd2 atoms chelate with the carboxyl oxygen atoms (O11, O12) on the DCOTBC5- ligand resulting in a 2D plane (Fig. 3f). Cd3 atoms on one 2D plane are further connected to Cd3 atoms on the other plane by DCOTBC5- ligand as a linker, and finally a 3D network structure is constructed (Fig. 3g). In 2, a large number of hydrogen bonds are formed between the carboxyl group in DCOTBC5- ligands and the coordinated water molecules (O3—H7A…O7, O15—H16A…O16) (Table S1). The hydrogen bond length is consistent with that reported in the literature[23].
Infrared spectral data for 1 and 2 are presented in Fig.S3. Infrared spectroscopy analysis further confirmed the crystal structure. Both 1 and 2 exhibited wide absorption bands at approximately 3 440 cm-1, which can be attributed to O—H stretching vibrations, indicating the presence of lattice water in the structure. In the carboxylate characteristic region of 1, absorption bands belonging to the asymmetric stretching vibration (νas) and symmetric stretching vibration (νs) of —COO- were observed at 1 579 and 1 373 cm-1, respectively. The corresponding vibration peaks of 2 were located at 1 572 and 1 377 cm-1. The calculated Δν values (Δν=νas-νs) for 1 and 2 were 206 and 195 cm-1, respectively. These two Δν values indicate that the carboxylate group is very likely to bind to the metal center in a bidentate coordination mode[24], which is highly consistent with the structure determined by single-crystal X-ray diffraction.
The structural integrity and phase purity of 1 and 2 were verified by room-temperature PXRD characterization. PXRD shows that all the main diffraction peaks in the experimental patterns precisely correspond to the simulated patterns, confirming the purity of the crystal material (Fig.S4).
The thermal stability of 1 and 2 was studied. The TG experiment of 1 indicates (Fig.S5) that 1 maintained thermal integrity below 197 ℃, with the minimum weight loss (5.5%) corresponding to the release of lattice water (Calcd. 5.74%). Then, at 330-800 ℃, the weight loss rate was 67.78%, which was due to the decomposition of the ligand DCODBC4- and phen (Calcd. 64.02%), and the remaining 21.6% may be due to metal oxide CdO (Calcd. 24.8 %). For 2, below 200 ℃, the structure remained intact with a weight loss of only 10.15%, which might be due to the loss of coordinated H2O with a calculated value of 11.9%. When the temperature rose within the range of 372-450 ℃, the weight loss of 2 was approximately 38.43%, which was due to the decomposition of the DCOTBC5- ligand (Calcd. 39.6%).
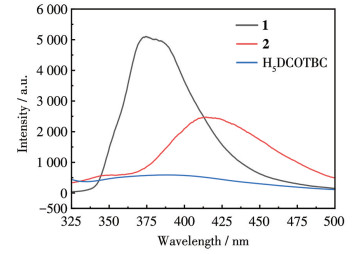
Solid-state emission characteristics of MOFs 1-2 and the H5DCOTBC ligand were systematically investigated. As shown in Fig. 4, the H5DCOTBC ligand exhibited a dominant emission peak at 437.6 nm (λex=350 nm). For 1, a strong emission band was observed at λem=374.4 nm upon excitation at 300 nm. Upon excitation at 320 nm, a strong emission band was observed at λem=434.6 nm for 2. The emission peak of 2 mainly comes from the emission of the ligand. Compared with the ligand, the emission peak of 1 has a partial blue-shift. This might be due to the electron cloud redistribution caused by the ligand and metal ions[25]. The emission peaks of 1 and 2 were significantly higher than those of the ligand. The main reason is that the ligand forms a complex with the metal, effectively increasing the rigidity of the ligand and reducing the energy loss of non-radiative decay[26].
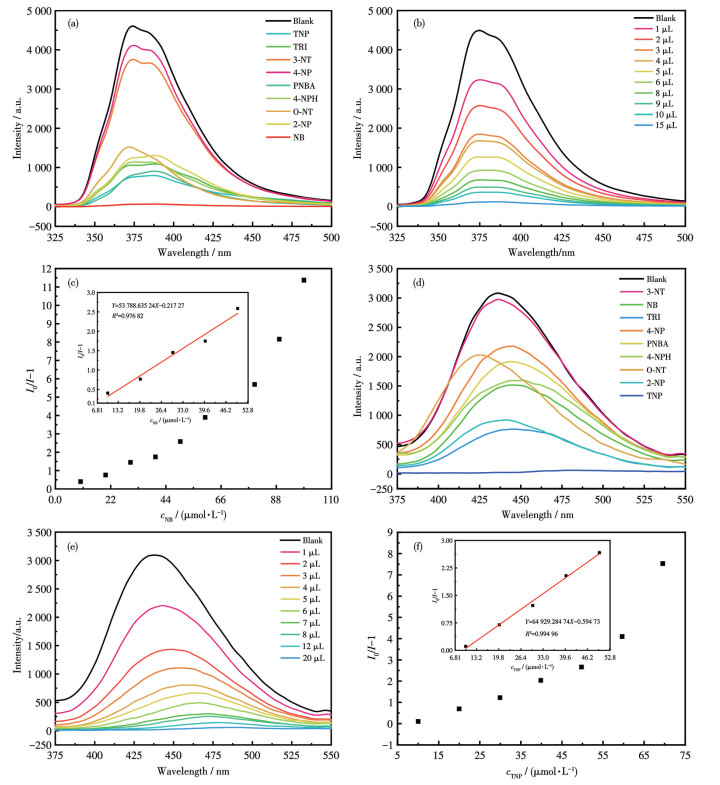
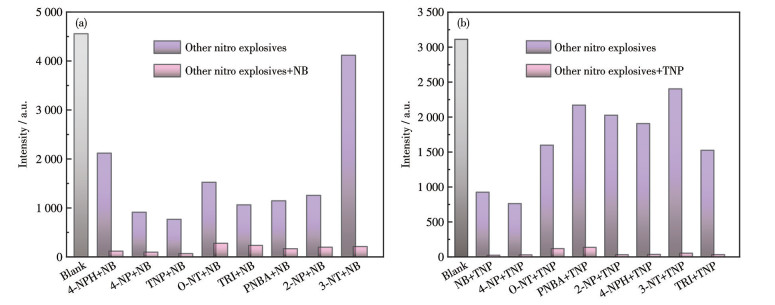
We selected nine common nitro explosives for testing. As shown in Fig. 5a and 5d, the fluorescence of 1 and 2 was almost completely quenched in the presence of NB and TNP, respectively, but the fluorescence intensities of 1 and 2 were only slightly affected in the presence of other explosives.
TRI=2,4,6-trinitrophenylhydrazine, 3-NT=3-nitroaniline, 4-NP=4-nitrophenol, PNBA=p-nitrobenzoic acid, 4-NPH=4-nitrophenylhydrazine, O-NT=o-nitroaniline, 2-NP=2-nitrophenol.
To further investigate the quenching mechanism and determine the detection limits (LODs), concentration titration experiments were conducted. The results showed that with the increase of NB and TNP concentrations, the fluorescence intensities of compounds 1 and 2 gradually decreased. Upon addition of NB and TNP up to volumes of 15 and 20 μL (1 mmol·L-1 each), respectively, the fluorescence emissions of compounds 1 and 2 were almost completely quenched (Fig. 5b and 5e). Concentration titration experiments were subsequently performed using the Stern-Volmer (S-V) equation: I0/I=KSVcQ+1. Here, I0 and I denote the fluorescence intensities of the probes in the absence and presence of the quencher (NB or TNP), respectively, and KSV represents the quenching constant; cQ represents the concentration of the analyte. 1 exhibited a linear fluorescence response to NB concentrations from 0.99 to 5.0 μmol·L-1 (Fig. 5c), with a correlation coefficient (R2) of 0.976 8. The S-V quenching constant (KSV) was determined to be 5.38×10⁴ L·mol-1. Based on the 3σ criterion, the LOD for NB was calculated as 0.043 8 μmol·L-1. A linear correlation was observed between the emission intensity of 2 and TNP concentration within the range of 2.0-4.0 μmol·L-1 (Fig. 5f), characterized by a correlation coefficient (R2) of 0.995 0. The associated KSV was calculated as 6.50×10⁴ L·mol-1. Based on the 3σ criterion, the LOD for TNP was determined to be 0.257 μmol·L-1. The results showed that the LODs of 1 and 2 for nitro explosives were better than those reported in the literature (Table 4 and 5).
下载:
导出CSV
下载:
导出CSV
Furthermore, the anti-interference experiments of 1 and 2 were carried out, and it was found that the fluorescence of 1 and 2 was still quenched to a large extent after adding NB and TNP in the presence of other nitro explosives, respectively (Fig. 6). It was shown that 1 and 2 had a good anti-interference effect as fluorescent probes for NB and TNP detection. Subsequently, the response times of 1 (Fig.S6a) and 2 (Fig.S6c) were tested. It was found that when 1 and 2 were used as fluorescent probes to detect NB and TNP, the fluorescence was almost completely quenched at 20 s and remained stable afterwards. Finally, in the cyclic experiments, 1 and 2 were respectively immersed in the NB and TNP solutions to be tested for several minutes and then rinsed with water several times. It was found that within the four cycles, the fluorescence intensities of 1 (Fig.S6b) and 2 (Fig.S6d) changed only slightly.
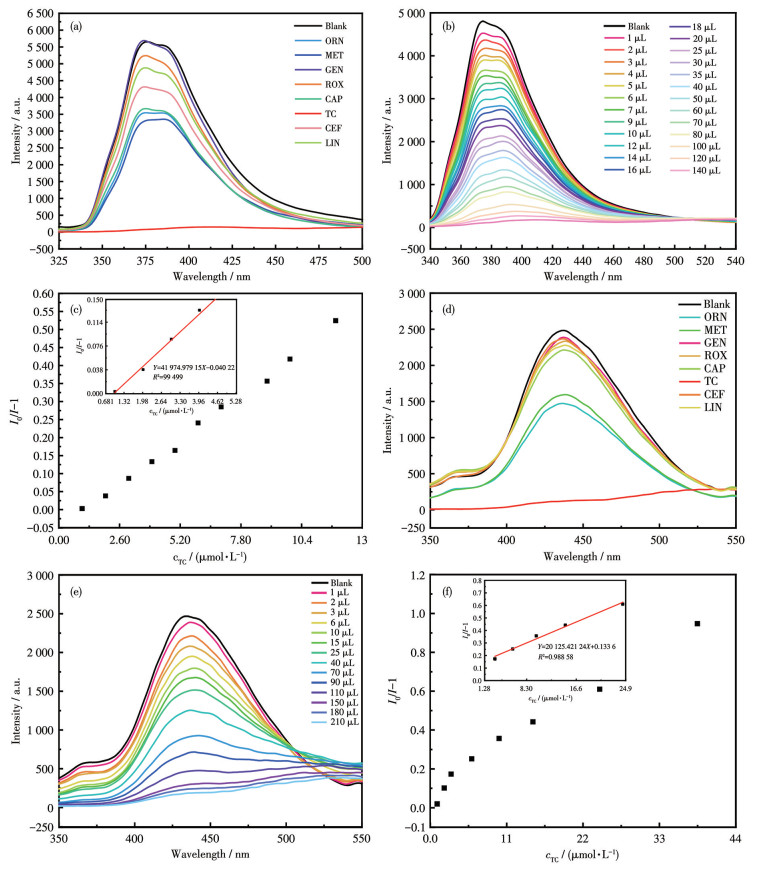
Based on the good fluorescence properties of 1 and 2, we experimented with their fluorescence sensing of antibiotics. The fluorescence characteristics of probes 1 and 2 in eight different antibiotic environments indicated that the fluorescence of probes 1 and 2 was almost completely quenched (Fig. 7a and 7d) when TC was present. Conversely, both probes exhibited minimal emission variation in other tested antibiotics, confirming their selective recognition capability for TC. To evaluate the fluorescence sensing ability of 1 and 2 for TC, concentration-dependent fluorescence quenching assays were performed. As shown in Fig. 7b and 7e, with the increase of TC volume, the fluorescence intensities of 1 and 2 gradually decreased. The fluorescence intensities of 1 and 2 were completely quenched when the volume of TC (1 mmol·L-1) reached 140 and 210 μL, respectively. The results of titration were further analyzed by SV equation (Fig. 7c and 7f), and it was found that the fluorescence intensity of TC showed a good linear relationship with a certain concentration range of 1 and 2, respectively, where the concentration ranges of 1 and 2 were 1.0-4.0 μmol·L-1 (R2=0.995 0) and 4.0-8.0 μmol·L-1 (R2=0.988 6), the values of KSV were 4.20×10⁴ and 2.01×10⁴ L·mol-1, and the LODs of 1 and 2 were 0.247 and 1.06 μmol·L-1 (at 3σ level), respectively. As summarized in Table 6, both probes exhibited superior LODs compared to literature values. In further, probe 1 showed higher sensitivity compared to probe 2, and the LOD of 1 was lower than the LODs of most reported fluorescent probes.
ORN=ornidazole, MET=metronidazole, GEN=gentamicin sulfate, ROX=roxithromycin, CAP=chloramphenicol, CEF=cefixime, LIN=lincomycin hydrochloride.
下载:
导出CSV
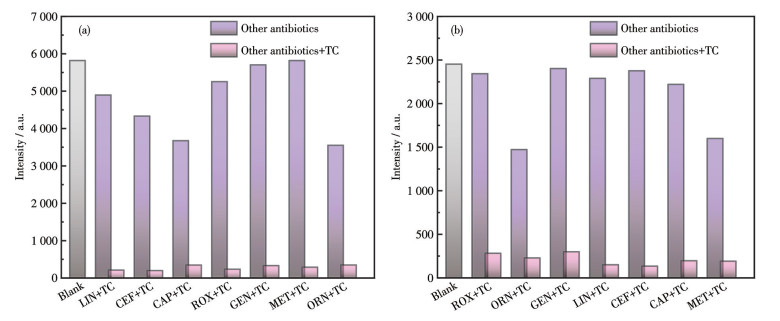
Selective evaluation of probes 1 and 2 was conducted using anti-interference experiments (Fig. 8a and 8b). The results indicated that when other antibiotics were present simultaneously, 1 and 2 still had significant fluorescence quenching of TC, confirming their specific recognition ability. The response time test and cycling experiment for 1 and 2 were conducted using the method described in the above text (Fig.S7). The results show that 1 and 2 have short response times and high reusability for the detection of TC.
We tested fluorescent sensing experiments of 1 and 2 for common pesticides. As shown in Fig. 9a and 9d, the fluorescence properties of 1 and 2 in eight different pesticides were completely different, and we found that the fluorescence quenching efficiencies of 1 and 2 were more than 99% after the addition of FLU. To further investigate the quenching process, we performed a concentration titration experiment and found that the fluorescence of 1 and 2 was completely quenched when the addition of FLU (10 mmol·L-1) reached 22 and 37 μL, respectively (Fig. 9b and 9e). The results of the titration were further analyzed by the SV equation (Fig. 9c and 9f). It was found that the fluorescence intensity of FLU had a good linear relationship with the concentration of 1 (4.0-8.0 μmol·L-1, R2=0.996 3, KSV=4.92×10⁴ L·mol-1) and 2 (4.97-8.91 μmol·L-1, R2=0.997 4, KSV=1.29×10⁴ L·mol-1), respectively. By fitting the linear slope and standard deviation of the blank value, the LODs of 1 and 2 were 0.158 and 0.836 μmol·L-1, respectively.
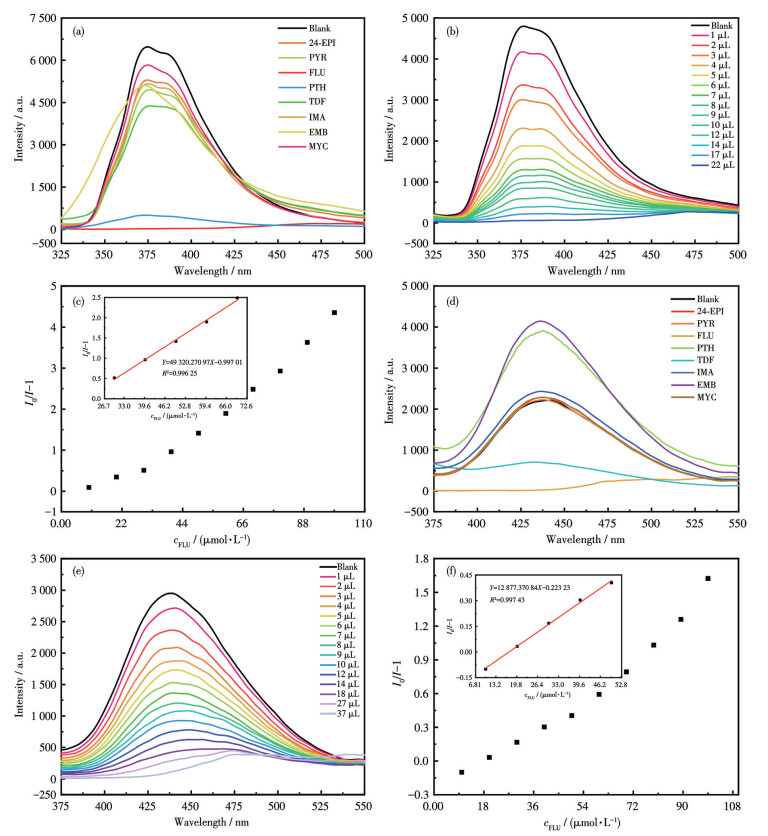
24-EPI=24-epibrassinolide, PYR=pyraclostronbin, PTH=pyrimethanil, TDI=triadimefon, IMA=imazalil, EMB=emamectin benzoate, MYC=zhongshengmycin.
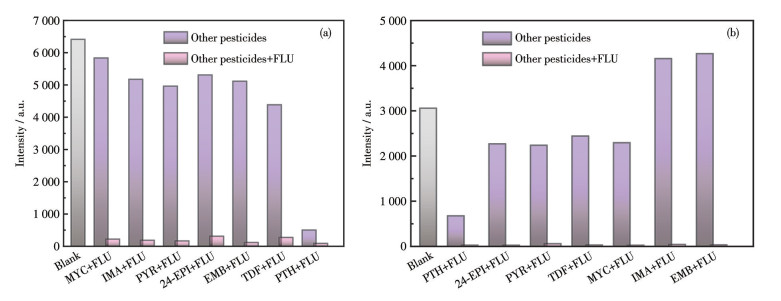
The selectivity of 1 and 2 to FLU was studied by anti-interference experiments (Fig. 10a and 10b). The results showed that 1 and 2 still had a higher quenching effect on FLU in the presence of other pesticides with the same concentration. In summary, when 1 and 2 are used as fluorescent probes to detect FLU, they have the advantages of high sensitivity, high selectivity, and anti-interference performance. The response time test and cycling experiment for 1 and 2 were conducted using the method in the above text (Fig.S8). The results show that 1 and 2 have short response times and high reusability for the detection of FLU.
To evaluate the detection ability of 1 and 2 for FLU in actual samples, the standard addition method was used to analyze the apple peel samples. Analysis of water-extracted fruit peels showed that no FLU was detected. Subsequently, FLU with concentrations of 25, 45, and 65 μmol·L-1 was added to the samples, and the determination was repeated three times. The recovery rates of three sample additions for 1 were 98.78% to 99.75% (Table S2), and for 2, they were 98.76% to 99.27% (Table S3), verifying the reliability of this method in the detection of complex samples.
To further understand the high selectivity and sensitivity of 1 and 2 as fluorescent probes for the detection of NB, TNP, TC, and FLU. Possible fluorescence quenching mechanisms were systematically evaluated based on established literature[42-44]. These encompass: (Ⅰ) competitive absorption, (Ⅱ) resonance energy transfer, (Ⅲ) photoinduced electron transfer, (Ⅳ) crystalline structural modifications, and (Ⅴ) central metal ion exchange processes. Since the detected substance is an organic molecule, there is no exchange of metal ions during the quenching process. To verify whether the quenching mechanism is crystal structure collapse, PXRD measurements of 1 and 2 were performed after fluorescence sensing experiments. The PXRD pattern matched well with the simulated pattern (Fig.S9). Therefore, the collapse of the structures of 1 and 2 is not the cause of fluorescence quenching.
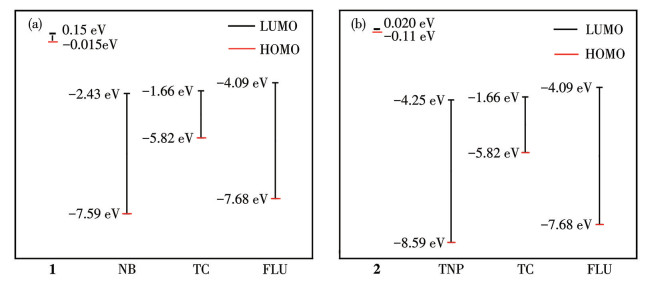
The energy levels of NB, TNP, TC, FLU, and orbitals 1 and 2 were calculated. We found that the LUMO and HOMO energy levels of 1 are 0.15 and -0.015 eV, respectively (Fig. 11a), and those of 2 are 0.020 and -0.11 eV (Fig. 11b), respectively. When the LUMO energy level of the donor is higher than that of the acceptor, photoelectrons may transfer from the excited-state donor to the ground-state acceptor instead of relaxing back to the ground state, leading to fluorescence quenching. Therefore, photoelectrons may transfer from the excited states of 1 and 2 to the ground state of the analyte, causing fluorescence quenching of 1 and 2. This result indicates that the transfer of photoelectrons may also occur during the detection process.
The ultraviolet absorption spectra of all analytes were also further measured, and they were compared with the emission spectra and excitation spectra of 1 and 2. The results show that the excitation spectrum of 1 overlaps with the UV spectra of NB, TC, and FLU (Fig.S10a-S10c), while the excitation spectrum of 2 overlaps with those of TC and FLU (Fig.S10e and S10f). This indicates that during the excitation processes of 1 and 2, the analyte molecules competitively absorb the light of the excitation wavelength, resulting in the fluorescence quenching of 1 and 2. Interestingly, when 2 is used to detect TNP, the emission of 2 overlaps with the ultraviolet of TNP (Fig.S10d). This indicates that resonance energy transfer might be the main reason for fluorescence quenching during the TNP detection process. In other words, when the energy returns to the ground state, it can allow the energy to transfer from the MOF to the analyte molecule, thereby further causing fluorescence quenching of the MOF material.
Two cadmium-based MOFs were solvothermally synthesized. The structures were characterized employing single-crystal X-ray diffraction, FTIR, PXRD, and TGA. MOF 1 adopts a 2D layered architecture, and MOF 2 exhibits a 3D network structure. Both 1 and 2 exhibited distinct luminescent emissions and served as effective fluorescence detection sensors for nitro explosives [LOD (1 for NB)=0.043 8 μmol·L-1, LOD (2 for TNP)=0.257 μmol·L-1], antibiotic residues [LOD (1 for TC)=0.247 μmol·L-1, LOD (2 for TC)=1.06 μmol·L-1], and pesticide contaminants [LOD (1 for FLU)=0.158 μmol·L-1, LOD (2 for FLU)=0.836 μmol·L-1]. The FLU in apple peels was detected by the spiked recovery method, verifying the practicability of 1 and 2. The mechanisms of 1 and 2 as fluorescent probes for detection were further discussed. In conclusion, this research provides new ideas for the design of multifunctional fluorescence sensing probes.
GRENNI P, ANCONA V, CARACCIOLO A B. Ecological effects of antibiotics on natural ecosystems: A review[J]. Microchem. J., 2018, 136: 25-39 doi: 10.1016/j.microc.2017.02.006
LV X J, QI L, GAO X Y, WANG H, HUO Y, ZHANG Z Q. Selective detection of 2,4,6-trinitrophenol based on a fluorescent nanoscale bis(8-hydroxyquinoline) metal complex[J]. Talanta, 2016, 150: 319-323 doi: 10.1016/j.talanta.2015.12.053
SHEN Y X, HONG R, HE X, WANG C, WANG X Y, LI S T, ZHU X D, GUI D X. Utilizing excited-state proton transfer fluorescence quenching mechanism, layered rare earth hydroxides enable ultra-sensitive detection of nitroaromatic[J]. J. Colloid Interface Sci., 2024, 673: 564-573 doi: 10.1016/j.jcis.2024.06.075
PRAMANIK S, ZHENG C, ZHANG X, EMGE T J, LI J. New microporous metal organic framework demonstrating unique selectivity for detection of high explosives and aromatic compounds[J]. J. Am. Chem. Soc., 2011, 133: 4153-4155 doi: 10.1021/ja106851d
DAS P, MANDAL S K. Strategic design and functionalization of an amine-decorated luminescent metal organic framework for selective gas/vapor sorption and nanomolar sensing of 2,4,6-trinitrophenol in water[J]. ACS Appl. Mater. Interfaces, 2018, 10: 25360-25371 doi: 10.1021/acsami.8b06339
WANG Y F, GAO K, LI J J, WANG L P, WU J. Synthesis and characterization of a Cd compound for selectively sensing of nitro-explosives[J]. Inorg. Chem. Commun., 2018, 96: 189-193 doi: 10.1016/j.inoche.2018.07.039
SILVA V, MOL H G J, ZOMER P, TIENSTRA M, RITSEMA C J, GEISSEN V. Pesticide residues in European agricultural soils‒A hidden reality unfolded[J]. Sci. Total Environ., 2019, 653: 1532-1545 doi: 10.1016/j.scitotenv.2018.10.441
LI J Y, DIAO X H, MUHAMMAD Y, CHEN C, WANG H, LI W, LI J X, QI C S. A europium(Ⅲ) metal-organic framework as effective fluorescence sensor for detection of ofloxacin antibiotic[J]. Polyhedron, 2024, 258: 117048 doi: 10.1016/j.poly.2024.117048
LI G, WANG T, ZHOU S H, WANG J, LV H, HAN M L, SINGH D P, KUMAR A, JIN J C. New highly luminescent 3D Tb(Ⅲ)-MOF as selective sensor for antibiotics[J]. Inorg. Chem. Commun., 2021, 130: 108756 doi: 10.1016/j.inoche.2021.108756
VANDANA T U, TRIPATHY B K, MISHRA R K, SHARMA A, MOHANTY K. A review on waste biomass-derived biochar: Production, characterisation, and advanced analytical techniques for pollutants assessment in water and wastewater[J]. Process Saf. Environ. Protect., 2025, 201: 107505 doi: 10.1016/j.psep.2025.107505
NUGENT P, BELMABKHOUT Y, BURD S D, CAIRNS A J, LUEBKE R, FORREST K, PHAM T, MA S, SPACE B, WOJTAS L, EDDAOUDI M, ZAWOROTKO M J. Porous materials with optimal adsorption thermodynamics and kinetics for CO2 separation[J]. Nature, 2013, 495: 80-84 doi: 10.1038/nature11893
YANG Q, XU Q, JIANG H L. Metal-organic frameworks meet metal nanoparticles: Synergistic effect for enhanced catalysis[J]. Chem. Soc. Rev., 2017, 46: 4774-4808 doi: 10.1039/C6CS00724D
CHI Z M, CHU S Q, WANG B Q, ZHANG Z, LIU G C, WANG X L. Advances in metal complex-based colorimetric sensors[J]. Talanta, 2026, 297: 128591 doi: 10.1016/j.talanta.2025.128591
LI R, CHEN T T, PAN X L. Metal-organic-framework-based materials for antimicrobial applications[J]. ACS Nano, 2021, 15: 3808-3848 doi: 10.1021/acsnano.0c09617
ZHAO J J, WANG Y J, WU Y P, XIA W, CHANG X W, WU X Q, LI S, LI D S. Chiral Ni-MOFs as bifunctional electrochemical platform for efficient alcohol oxidation and highly sensitive non-enzymatic glucose detection[J]. Nano Res., 2025, 18: 94907930 doi: 10.26599/NR.2025.94907930
HORCAJADA P, SERRE C, REGÍ M V, SEBBAN M, TAULELLE F, FEREY G. Metal-organic frameworks as efficient materials for drug delivery[J]. Angew. Chem.‒Int. Edit., 2006, 45: 5974-5978 doi: 10.1002/anie.200601878
HOWARTH A J, LIU Y, LI P, LI Z, WANG T C, HUPP J T, FARHA O K. Chemical, thermal and mechanical stabilities of metal-organic frameworks[J]. Nat. Rev. Mater., 2016, 1: 15018 doi: 10.1038/natrevmats.2015.18
WANG X Y, YAN X X, WU Y P, WU X Q, YIN Y M, LI S, ZHANG Q C, LIU B, LI D S. Nonenzymatic electrochemical sensing platform based on 2D isomorphic Co/Ni-metal-organic frameworks for glucose detection[J]. Inorg. Chem., 2023, 62: 10256-10262 doi: 10.1021/acs.inorgchem.3c01058
WANG X, LI B, WU Y P, TSAMIS A, YU H G, LIU S, ZHAO J, LI Y S, LI D S. Investigation on the component evolution of a tetranuclear nickel-cluster-based metal-organic framework in an electrochemical oxidation reaction[J]. Inorg. Chem., 2020, 59: 4764-4771 doi: 10.1021/acs.inorgchem.0c00024
SHAO L X, LI S J, FENG L, PEI X L, YU X J. Layer-by-layer growth of ferrocene decorated metal-organic framework thin films and studies of their electrochemical properties[J]. Appl. Surf. Sci., 2022, 596: 153525 doi: 10.1016/j.apsusc.2022.153525
SPEK A L. Single-crystal structure validation with the program PLATON[J]. J. Appl. Cryst., 2003, 36: 7-13 doi: 10.1107/S0021889802022112
WANG K, HU X L, LI X, SU Z M, ZHOU E L. Solvent-induced two Cd-MOFs as luminescent sensors for picric acid, Fe3+ and Cr2O72-[J]. J. Solid State Chem., 2021, 298: 122128 doi: 10.1016/j.jssc.2021.122128
SHARMA A, KIM D, PARK J H, RAKSHIT S, SEONG J, JEONG J H, KWON O H, LAH M S. Mechanistic insight into the sensing of nitroaromatic compounds by metal-organic frameworks[J]. Comm. Chem., 2019, 2: 39 doi: 10.1038/s42004-019-0135-2
MO J T, WANG Z, ZHU C Y, ZHANG Y, PAN M. Switching from oxygen quenching resistance to linear response by smart luminescent iridium(Ⅲ)-based metal-organic frameworks[J]. ACS Appl. Mater. Interfaces, 2022, 14: 41208-41214 doi: 10.1021/acsami.2c12511
YUE M L, JIANG Y F, ZHANG L, YU C Y, ZOU K Y, LI Z X. Solvent-induced cadmium(Ⅱ) metal-organic frameworks with adjustable guest-evacuated porosity: Application in the controllable assembly of MOF-derived porous carbon materials for supercapacitors[J]. Chem.‒Eur. J., 2017, 23: 15680-1569 doi: 10.1002/chem.201702694
LI Z X, ZHANG X, LIU Y C, ZOU K Y, YUE M L. Controlling the BET surface area of porous carbon by using the Cd/C ratio of a Cd-MOF precursor and enhancing the capacitance by activation with KOH[J]. Chem.‒Eur. J., 2016, 22: 17734-17747 doi: 10.1002/chem.201603072
YANG L, LIU Y L, LIU C G, YE F, FU Y. A luminescent sensor based on a new Cd-MOF for nitro explosives and organophosphorus pesticides detection[J]. Inorg. Chem. Commun., 2020, 122
FU Y P, YANG H, DONG L L, WANG F, CHEN X L, WANG J J. A highly sensitive and selective Cd-MOF fluorescent probe for the detection of His, NB, TC and PTH and its applications in real samples[J]. Spectroc. Acta Pt. A‒Molec. Biomolec. Spectr., 2024, 307: 123619 doi: 10.1016/j.saa.2023.123619
CHEN F Y, WANG Z X, YANG Y Q, WANG Y Z, LUO Y H. Assembly of three new triphenylamine functionalized MOFs for the fluorescent sensing of nitrobenzene[J]. J. Solid State Chem., 2024, 331: 124509 doi: 10.1016/j.jssc.2023.124509
ZHANG T W, QIN J L, LI Y G, HUANG K R, CUI L S. Synthesis, structure and fluorescent probes for sensitive detection for nitrobenzene of a Cd-MOF[J]. J. Inorg. Organomet. Polym. Mater, 2022, 32: 2763-2770 doi: 10.1007/s10904-022-02297-x
MICHENZI C, PROIETTI A, ROSSI M, ESPRO C, BRESSI V, VETICA F, SIMONIS B, CHIAROTTO I. Carbon nanodots from orange peel waste as fluorescent probes for detecting nitrobenzene[J]. RSC Sustain., 2024, 2: 933-942 doi: 10.1039/D3SU00469D
DU J Y, LIU J P, REN Y F, WANG C, BAI F B, HAO H X. Rapid detection of TNP based on a commercial fluorescent probe[J]. Spectroc. Acta Pt. A‒Molec. Biomolec. Spectr., 2019, 211: 287-290 doi: 10.1016/j.saa.2018.12.014
MA Y H, ZHAO L, LI Y, LIU J Y, YANG Y Q, CHU T S. Investigation on sensing mechanism of a fluorescent probe for TNP detection in aqueous solution[J]. Tetrahedron, 2018, 7: 2684-2691
SHI J L, LIU Y Z, XIN X P, ZHAO Y, LI S L, PAN H X, CHEN J, CAO D L, ZHAO L X. Isophorone-based fluorescent probe for selective detection of explosives TNP/PYX with multi-scenario applications[J]. Microchem. J., 2025, 218: 115113 doi: 10.1016/j.microc.2025.115113
KAUR M, MEHTA S K, KANSAL S K. A fluorescent probe based on nitrogen doped graphene quantum dots for turn off sensing of explosive and detrimental water pollutant, TNP in aqueous medium[J]. Spectroc. Acta Pt. A‒Molec. Biomolec. Spectr., 2017, 180: 37-43 doi: 10.1016/j.saa.2017.02.035
DESAI V, MODI K, PANJWANI F, SETH B K, VORA M, PARIKH J, JAIN V K. Design and synthesis of an efficient fluorescent probe based on oxacalix[4]arene for the selective detection of trinitrophenol (TNP) explosives in aqueous system[J]. J. Fluoresc., 2024, 34: 1219-1228 doi: 10.1007/s10895-023-03352-7
LIN M, ZOU H Y, YANG T, LIU Z X, LIU H, HUANG C Z. An inner filter effect based sensor of tetracycline hydrochloride as developed by loading photoluminescent carbon nanodots in the electrospun nanofibers[J]. Nanoscale, 2016, 8: 2999-3007 doi: 10.1039/C5NR08177G
CUI L S, ZHU B, HUANG K R, GAN Y L, LI Y C, LONG J Q. Synthese, structure of three Zn-MOFs and potential sensor material for tetracycline antibiotic in water: {[Zn(bdc)(4,4′-bidpe)]·H2O}n[J]. J. Solid State Chem., 2020, 29: 121526
GUO J Q, XIN J H, WANG J, LI Z, YANG J L, YU X, YAN M X, MO J Y. A high-efficiency and selective fluorescent assay for the detection of tetracyclines[J]. Sci. Rep., 2024, 14: 22918 doi: 10.1038/s41598-024-74411-7
LIU J, WANG T F, WANG Z L, ZOU X, WANG W J, ZHANG S L, GONG Z J. Ratiometric fluorescent probe for tetracycline detection based on waste printing paper[J]. Luminescence, 2021, 36: 1553-1560 doi: 10.1002/bio.4100
CAO Y Y, WANG X R, BAI H J, JIA P, ZHAO Y J, LIU Y N, WANG L, ZHUANG Y T, YUE T L. Fluorescent detection of tetracycline in foods based on carbon dots derived from natural red beet pigment[J]. LWT-Food Sci. Technol., 2022, 157: 113100 doi: 10.1016/j.lwt.2022.113100
HU Z, LUSTIG W P, ZHANG J, ZHENG C, WANG H, TEAT S J, GONG Q, RUDD N D, LI J. Effective detection of mycotoxins by a highly luminescent metal-organic framework[J]. J. Am. Chem. Soc., 2015, 137: 16209-1621 doi: 10.1021/jacs.5b10308
YIN H Q, WANG X Y, YIN X B. Rotation restricted emission and antenna effect in single metal-organic frameworks[J]. J. Am. Chem. Soc., 2019, 141: 15166-15173 doi: 10.1021/jacs.9b06755
NAGARKAR S, JOARDER B, CHAUDHARI A, MUKHERJEE S, GHOSH S. Highly selective detection of nitro explosives by a luminescent metal-organic framework[J]. Angew. Chem.‒Int. Edit., 2013, 125: 2953-2957 doi: 10.1002/ange.201208885

Figure 2 (a) Coordination environment of Cd2+ in MOF 1; (b) Capped octahedral configuration of Cd1 in 1; (c) Chain structure of 1; (d) 2D network of 1
The ellipsoidal probability is 30%; Symmetry codes: A: x, -y, z+1/2; B: -x+2, -y, -z+1; C: x, -y, z-1/2.

Figure 3 (a) Coordination environment of Cd2+ in MOF 2; (b) Triangular bipyramidal configuration of Cd1; (c) Double-capped trigonal configuration of Cd2; (d) Single-cap octahedral configuration of Cd3; (e) Chain structure of 2; (f) 2D network of 2; (g) 3D framework of 2
The ellipsoidal probability is 30%; Symmetry codes: A: -x+1, y, -z+1/2, B: x-1/2, -y+3/2, z-1/2, C: -x+3/2, -y+3/2, -z+1, D: -x+3/2, y-1/2, -z+3/2.

Figure 5 Fluorescence spectra of MOFs (a) 1 and (d) 2 in the presence of various nitro explosives (10 mmol·L-1); (b) Fluorescence spectra of 1 upon the addition of NB (10 mmol·L-1); (c) Relationship of I0/I-1 of 1 with NB concentration (inset: linear fit); (e) Fluorescence spectra of 2 upon the addition of TNP (10 mmol·L-1); (f) Relationship of I0/I-1 of 2 with TNP concentration (inset: linear fit)
TRI=2,4,6-trinitrophenylhydrazine, 3-NT=3-nitroaniline, 4-NP=4-nitrophenol, PNBA=p-nitrobenzoic acid, 4-NPH=4-nitrophenylhydrazine, O-NT=o-nitroaniline, 2-NP=2-nitrophenol.

Figure 6 (a) Fluorescence response of MOF 1 to NB in the presence of other nitro explosives; (b) Fluorescence response of MOF 2 to TNP in the presence of other nitro explosives

Figure 7 Fluorescence spectra of MOFs (a) 1 and (d) 2 in the presence of various antibiotics (1 mmol·L-1); Fluorescence spectra of (b) 1 and (e) 2 upon the addition of TC (1 mmol·L-1); Relationships of I0/I-1 with TC concentration for (c) 1 and (f) 2 (inset: linear fit)
ORN=ornidazole, MET=metronidazole, GEN=gentamicin sulfate, ROX=roxithromycin, CAP=chloramphenicol, CEF=cefixime, LIN=lincomycin hydrochloride.

Figure 8 Fluorescence responses of MOFs (a) 1 and (b) 2 to TC in the presence of other antibiotics

Figure 9 Fluorescence spectra of MOFs (a) 1 and (d) 2 in the presence of various pesticides (10 mmol·L-1); Fluorescence spectra of (b) 1 and (e) 2 upon the addition of FLU (10 mmol·L-1); Relationships of I0/I-1 with FLU concentration for (c) 1 and (f) 2 (inset: linear fit)
24-EPI=24-epibrassinolide, PYR=pyraclostronbin, PTH=pyrimethanil, TDI=triadimefon, IMA=imazalil, EMB=emamectin benzoate, MYC=zhongshengmycin.

Figure 10 Fluorescence responses of MOFs (a) 1 and (b) 2 to FLU in the presence of other pesticides

Figure 11 (a) Orbital energy levels of MOF 1 and compounds NB, TC, and FLU; (b) Orbital energy levels of MOF 2 and compounds TNP, TC, and FLU
Table 1. Crystal data and structural refinement parameters for MOFs 1 and 2
| Parameter | 1 | 2 |
| Empirical formula | C40H52Cd2N4O24 | C34H30Cd5O32 |
| Formula weight | 1 197.65 | 1 512.58 |
| Temperature / K | 296(2) | 296.15 |
| Crystal system | Monoclinic | Monoclinic |
| Space group | P2/c | C2/c |
| a / nm | 1.023 4(5) | 2.373 7(16) |
| b / nm | 1.245 9(6) | 1.012 9(7) |
| c / nm | 1.713 7(8) | 1.987 5(13) |
| β / (°) | 98.986(9) | 113.742(9) |
| Volume / nm3 | 2.158 2(18) | 4.374(5) |
| Z | 2 | 4 |
| Dc / (g·cm-3) | 1.843 | 2.297 |
| μ / mm-1 | 1.085 | 2.501 |
| F(000) | 913.16 | 2 920 |
| 2θ range / (°) | 1.634-25.500 | 2.309-24.997 |
| Reflection collected | 10 879 | 9 404 |
| Data, Nres, Npara | 3 996, 0, 270 | 3 654, 0, 321 |
| Index ranges | -9 ≤ h ≤ 12, -14 ≤ k ≤ 14, -20 ≤ l ≤ 18 | -15 ≤ h ≤ 28, -12 ≤ k ≤ 12, -23 ≤ l ≤ 22 |
| Final R indexes [I≥2σ(I)]b | R1=0.054 7, wR2=0.144 1 | R1=0.037 3, wR2=0.088 7 |
| Final R indexes (all data) | R1=0.089 6, wR2=0.159 1 | R1=0.050 5, wR2=0.096 7 |
| GOF | 0.949 | 1.097 |
| a Nres=number of restraints, Npar=number of parameters; b R1=∑||Fo|-|Fc||/∑|Fo|, wR2={∑[w(|Fo|2-|Fc|2)2]/∑[w(|Fo|2)2]}1/2. | ||
 下载: 导出CSV
Table 2. Main bond lengths (nm) and bond angles (°) of MOF 1
| Cd1—O4A | 0.221 7(5) | Cd1—O3B | 0.227 3(4) | Cd1—N1 | 0.229 6(6) |
| Cd1—N2 | 0.231 7(6) | Cd1—O2 | 0.235 2(5) | Cd1—O1 | 0.241 9(5) |
| O3—Cd1B | 0.227 3(4) | O4—Cd1C | 0.221 7(5) | ||
| O4A—Cd1—N1 | 175.62(19) | O4A—Cd1—O3B | 91.60(2) | O4A—Cd1—N2 | 109.10(2) |
| O3B—Cd1—N1 | 84.40(2) | N1—Cd1—N2 | 71.80(2) | O3B—Cd1—N2 | 119.71(18) |
| O3B—Cd1—O2 | 95.96(16) | O4A—Cd1—O2 | 89.38(19) | N2—Cd1—O2 | 138.24(17) |
| N1—Cd1—O2 | 92.62(19) | O3B—Cd1—O1 | 151.01(17) | O4A—Cd1—O1 | 88.47(18) |
| N2—Cd1—O1 | 87.41(17) | N1—Cd1—O1 | 95.87(19) | O2—Cd1—O1 | 55.05(16) |
| Symmetry codes: A: x, -y, z+1/2; B: -x+2, -y, -z+1; C: x, -y, z-1/2; D: -x+1, y, -z+1/2. | |||||
下载: 导出CSV
Table 3. Main bond lengths (nm) and bond angles (°) of MOF 2
| Cd1—O1A | 0.230 8(4) | Cd1—O1 | 0.230 8(4) | Cd1—O8B | 0.233 2(4) |
| Cd1—O8C | 0.233 2(4) | Cd1—O15A | 0.229 8(5) | Cd1—O15 | 0.229 8(5) |
| Cd2—O4D | 0.228 5(5) | Cd2—O5 | 0.221 1(4) | Cd2—O6 | 0.239 2(6) |
| Cd2—O7 | 0.232 6(5) | Cd2—O11E | 0.234 6(4) | Cd2—O12E | 0.237 2(4) |
| O1A—Cd1—O1 | 172.90(2) | O1A—Cd1—O8B | 75.00(14) | O1A—Cd1—O8C | 99.53(14) |
| O1—Cd1—O8B | 99.53(14) | O1—Cd1—O8C | 75.00(14) | O8C—Cd1—O8B | 81.70(2) |
| O15A—Cd1—O1 | 99.52(17) | O15—Cd1—O1A | 99.53(17) | O15A—Cd1—O1A | 84.24(18) |
| O15—Cd1—O1 | 84.24(18) | O15—Cd1—O8B | 84.70(2) | O15A—Cd1—O8C | 84.70(2) |
| O15—Cd1—O8C | 152.86(18) | O15A—Cd1—O8B | 152.87(18) | O15A—Cd1—O15 | 116.30(3) |
| O4D—Cd2—O6 | 75.20(2) | O4D—Cd2—O7 | 84.30(2) | O4D—Cd2—O11E | 122.72(16) |
| O4D—Cd2—O12E | 108.06(16) | ||||
| Symmetry codes: A: -x+1, y, -z+1/2; B: x-1/2, -y+3/2, z-1/2; C: -x+3/2, -y+3/2, -z+1; D: -x+3/2, y-1/2, -z+3/2; E: x, -y+1, z+1/2. | |||||
下载: 导出CSV

 扫一扫看文章


扫一扫关注我们