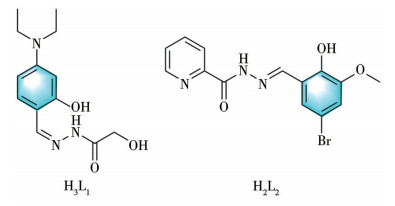
Scheme 1.
Structures of two Schiff-base ligands
Crystal structure and antibacterial activity of two Gd2 complexes based on polydentate Schiff-base ligands
Yingyue ZHANG , Liuqing KANG , Yating YANG , Xiaofen GUAN , Wenmin WANG

Metal-organic frameworks (MOFs) are coordination polymers self-assembled from polydentate organic ligands (mostly aromatic polyacids and polybases) and metal ions. Compared with other porous materials, MOFs have broader application prospects in various fields[1-2], including bacteriostasis[3], gas storage[4], catalysis[5], optical materials[6-7], and biomedicine[8-9]. In recent years, the interaction between MOFs and DNA has become an important issue in life sciences[10]. The combination of MOFs and DNA can provide a basis for the early diagnosis and treatment of diseases by detecting gene mutations, expression levels, and so on[11-12]. In addition, the low toxicity and easy functionalization of MOFs have expanded their application scope to the antibacterial field[13-14]. MOFs constructed by rare-earth metal ions and Schiff bases can inhibit the proliferation of bacteria. Therefore, research on polydentate Schiff-base ligands and their complexes is expected to promote the development of the life sciences field[15-17].
Bacteria, as the most abundant organisms, threatened human lives until the advent of antibiotics. However, with the widespread use of antibiotics[18] over a long period of time, bacteria′s tolerance to antibiotics has gradually increased, further intensifying the threats to human and environmental safety. Therefore, various types of new antibacterial agents have been developed[19-20]. Among them, MOFs seem to be playing an increasingly important role[21]. The unique properties of MOFs make them a suitable multifunctional platform. By selecting appropriate metastable coordination bonds, MOFs can act as reservoirs to release antibacterial rare-earth metal ions or organic linkers[22]. Importantly, when combined with other materials, MOFs can serve as a platform to kill bacteria effectively through the synergistic effect of multiple mechanisms. Therefore, MOFs have significant implications for research on antibacterial agents [23-24].
Research has shown that Schiff-base ligands containing heteroatoms such as N, O, P, and S exhibit strong coordination abilities, enabling them to form stable metal complexes with rare-earth metal ions and bind to DNA with ease[25]. Based on previous efforts to synthesize lanthanide rare-earth metal ions complexes, we used two Schiff-base ligands [Scheme 1 and S1 (Supporting information)] to construct two new binuclear gadolinium (Gd2) complexes. Their general formula are [Gd2(dbm)2(HL1)2(CH3OH)2]·4CH3OH (1) and [Gd2(dbm)2(L2)2(CH3OH)2]·2CH3OH (2), where Hdbm=dibenzoylmethane. The results of subsequent investigations demonstrated that the two Gd2 complexes interact with calf thymus DNA (CT-DNA) via an intercalation mechanism. Meanwhile, the complexes exhibited good inhibitory activity against four types of bacteria [Bacillus subtilis (B. subtilis), Escherichia coli (E. coli), Staphylococcus aureus (S. aureus), Candida albicans (C. albicans)].
Gd(dbm)3·6H2O (AR, Energy Chemical), Hdbm (AR, Aladdin), hydroxyacetohydrazide (AR, Energy Chemical), 4-(diethylamino)salicylaldehyde (AR, Energy Chemical), nicotinohydrazide (AR, Energy Chemical), 5-bromo-2-hydroxy-3-methoxybenzaldehyde (AR, Energy Chemical), CH3OH (AR, Kermel), CH3CN (AR, Kermel), DMF (AR, Kermel), and CHCl3 (AR, Kermel) were used. Deionized water (DI water) was produced by the Milli-Q water purification system. All chemicals and solvents were utilized as received without further purification. CT-DNA was obtained from Shanghai Institute of Materia Medica. The details of the synthesis of the ligands H3L1 and H2L2 and physical measurements are in the Supporting information.
Gd(dbm)3·6H2O (0.025 mmol), H3L1 (0.025 mmol) [or H2L2 (0.025 mmol)], CH3OH (8 mL), CH3CN (2 mL), DMF (0.5 mL), and CHCl3 (2 mL) were enclosed in a 15 mL vial by stirring for 5-10 min. The vial was sealed and heated to 70 ℃ for 10 h, then cooled to room temperature at a rate of about 5 ℃·h-1. Yellow block crystals of the products were collected. The synthetic routes of complexes 1 and 2 are shown in Scheme S2.
Complex 1. Yield based on Gd: 48%. Anal. Calcd. for C62H80Gd2N6O16(%): C, 50.32; H, 5.41; N, 5.68. Found(%): C, 50.41; H, 5.36; N, 5.63.
[Gd2(dbm)2(L2)2(CH3OH)2]·2CH3OH (2). Yield based on Gd: 52%. Anal. Calcd. for C62H58Br2Gd2N6O14(%): C, 46.96; H, 3.66; N, 5.30. Found(%): C, 49.95; H, 5.39; N, 5.61.
A computer-controlled Rigaku Saturn CCD area detector diffractometer equipped with confocal monochromatized Mo Kα radiation (λ=0.071 073 nm) was utilized to get single-crystal X-ray diffraction data of complexes 1 and 2 using the ω-φ scan technique. Through SHELXS-2016 and SHELXL-2016 programs with a full-matrix least-squares technique based on F 2, the structures were solved and refined. All non-hydrogen atoms obtained anisotropic thermal parameters. The crystals were measured at the moment when they were isolated from the solution, so certain disordered solvent molecules were present. Table 1 covers crystal parameters, data collection, and refinement details for complexes 1 and 2.
 下载:
导出CSV
下载:
导出CSV
| Parameter | 1 | 2 |
| Formula | C62H80Gd2N6O16 | C62H58Br2Gd2N6O14 |
| Formula weight | 1 479.82 | 1 585.46 |
| T / K | 150.0 | 150.0 |
| Crystal system | Monoclinic | Monoclinic |
| Space group | P21/c | P21/n |
| a / nm | 1.515 72(5) | 1.348 16(4) |
| b / nm | 1.212 11(5) | 1.329 75(3) |
| c / nm | 1.887 29(7) | 1.763 92(5) |
| β / (°) | 112.730 7(12) | 105.093(1) |
| V / nm3 | 3.198 1(2) | 3.053 12(14) |
| Z | 2 | 2 |
| Dc / (g·cm-3) | 1.537 | 1.725 |
| μ / mm-1 | 2.126 | 3.532 |
| θ range / (°) | 2.047-26.394 | 1.943-26.400 |
| F(000) | 1 500 | 1 564 |
| Reflection collected | 36 429 | 57 467 |
| Unique reflection | 6 525 | 6 232 |
| Rint | 0.056 5 | 0.052 5 |
| GOF (F 2) | 1.004 | 1.025 |
| R1, wR2 [I > 2σ(I)] | 0.036 1, 0.096 3 | 0.039 9, 0.099 1 |
| R1, wR2 (all data) | 0.049 6, 0.111 4 | 0.047 1, 0.109 7 |
The CT-DNA mother liquor (3 mL, 2 μg·mL-1) was used to determine the absorbance at 260 and 280 nm by a UV spectrophotometer. Tris-HCl/NaCl buffer solution (500 mL, 5 mmol·L-1, pH=7.25) was obtained by mixing Tris (0.302 5 g), HCl (6 mol·L-1, 0.55 mL), NaCl (0.146 3 g), and distilled water. Complex 1 (complex 2, H3L1, and H2L2) was dissolved in Tris-HCl/NaCl buffer solution to give a final concentration of 1.7×10⁻² mmol·L-1.
At room temperature, the concentration of complex 1 (complex 2, H3L1, and H2L2) was maintained at a constant level. Meanwhile, the absorbance of CT-DNA was measured within the wavelength range of 190-450 nm and determined via ultraviolet spectrophotometric analysis, taking Tris-HCl/NaCl buffer solution as the reference solution and CT-DNA solution as the control liquid. Subsequently, a consistent volume of CT-DNA solution (10 μL) was incrementally added, and the mixture was tested after 30 min of reaction.
In fluorescence quenching research, a solution consisting of 0.06 mg·mL-1 of ethidium bromide (EB) and 2 μg·mL-1 of CT-DNA was prepared in advance and stored in the dark for 12 h before utilization. The specific test process was as follows: 3 mL of the mixed solution of EB-DNA was added to the sample pool, and the fluorescence emission spectrum in the range of 550-700 nm was measured at the excitation wavelength of 270 nm. Subsequently, the same volume of complex 1 (complex 2, H3L1, and H2L2) solution (1.7×10⁻² mmol·L-1, 10 μL) was added to the EB-DNA system in turn. After each addition of the mixed solution, the reaction mixture was shaken well at room temperature for 5 min, and then the emission spectrum was determined.
In the cyclic voltammetric measurement, the three-electrode system was used. The glassy carbon electrode was used as the working electrode, the saturated calomel electrode was used as the reference electrode, and the platinum wire electrode was used as the counter electrode. The scanning potential range was set between -0.15 and 0.8 V. The scanning rate was 0.1 V·s-1, the sample interval was 0.001 V, and the settling time was 2 s. The experimental procedures were carried out using 1.7×10⁻² mmol·L-1 of complex 1 (complex 2, H3L1, and H2L2) together with 2 μg·mL-1 of DNA.
An appropriate amount of complex 1 (complex 2, H3L1, and H2L2) was taken, and solutions were prepared with DMSO as the solvent. Then, the punched inhibition zone method was used to determine the antibacterial activities of the complexes against four kinds of bacteria (B. subtilis, C. albicans, E. coli, and S. aureus). The activated bacterial liquid was diluted to different concentrations. 100 μL of the diluted bacterial liquid was taken and evenly spread on the LB solid medium. Then it was placed in a biochemical incubator and incubated at 37 ℃ for about 10 h. Finally, the appropriate concentration of the bacterial liquid was determined as 8×10⁴ CFU·mL-1. The inhibition zone test was conducted at this concentration. 4 mL stainless steel tubes were used for disinfection and sterilization to punch holes in the plate. 60 μL of antibacterial agent was injected into the holes, pre-diffusion was carried out at 4 ℃ for 2 h, and then it was incubated in a biochemical incubator at 37 ℃ for about 10 h. Vernier calipers were used to measure the diameter of the inhibition zone.
Complex 1 crystallizes in the monoclinic system and P21/c space group with Z=2. As shown in Fig.1, the molecular structure of complex 1 consists of two Gd3+ ions, two Schiff-base ligands (HL12-), two dbm- ions, two coordinated CH3OH molecules, and four free CH3OH molecules. Moving on to the specific structural features, as shown in Fig.S1a, two Gd3+ ions are bridged by two μ2-O atoms (O2 and O2a) from two HL12- ligands, respectively, to form a dinuclear structure. As shown in Fig.S1b, further examination of the coordination environment around each Gd3+ ion reveals that it is coordinated by one nitrogen atom (N2) from one HL12- ligand, and the Gd1—N2 distance is 0.246 8(4) nm. It is also coordinated by seven oxygen atoms (O1a, O2, O2a, O3, O4, O5, O6), with the Gd—O distances ranging from 0.223 5(3) to 0.245 1(3) nm. Therefore, the Gd3+ ion is eight-coordinated. The coordination mode of HL12- ligand is shown in Fig.S2a, one HL12- ligand connects two Gd3+ ions [Gd1—O1 0.245 1(3) nm, Gd1—O3 0.223 5(3) nm, Gd1—O2—Gd1 114.64(11)°]. It clearly defines how the HL12- ligand coordinates with the Gd3+ ions. The coordination mode of dbm- ion is shown in Fig.S2b, one dbm- ion is connected to one Gd3+ ion [Gd1—O4 0.237 3(3) nm, Gd1—O5 0.237 5(3) nm, O4—Gd1—O5 71.14(10)°]. The data of bond lengths and bond angles for complex 1 are presented in Table S1.
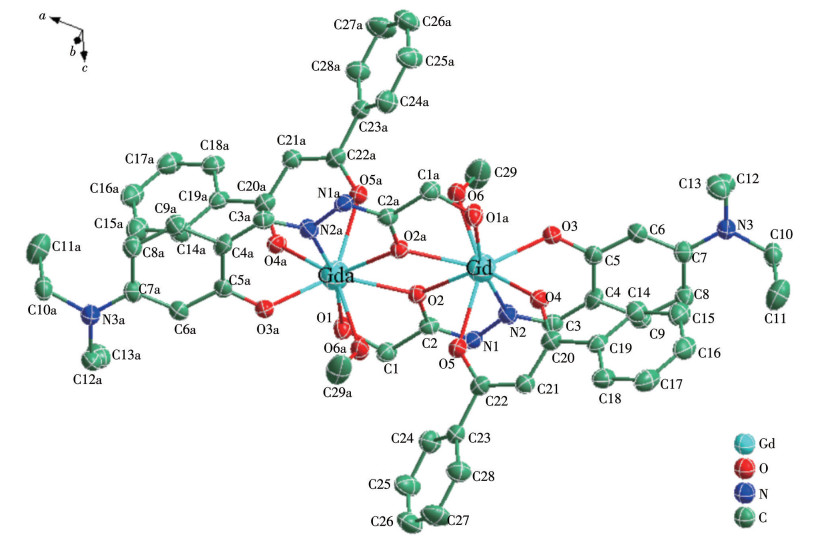
Hydrogen atoms have been omitted; Symmetry code: a: -x+1, -y+2, -z+1; Ellipsoids are drawn at a 30% probability level.
Complex 2 crystallizes in the P21/n space group with Z=2 of the monoclinic system. As shown in Fig.2, complex 2 consists of two Gd3+ ions, two L22- ligands, two dbm- ions, two coordinated CH3OH molecules, and two free CH3OH molecules. Turning to the structural particulars, as shown in Fig.S3a, the structure of complex 2 is similar to complex 1. In complex 2, two Gd3+ ions are respectively bridged by two oxygen atoms (O2 and O2a) from two L22- ligands, thereby forming a dinuclear structure. Fig.S3b further reveals the coordination environment around each central Gd3+ ion. Each central Gd3+ ion adopts an eight-coordinated mode by one nitrogen atom (N1) from one L22- ligand, and seven oxygen atoms (O1a, O2a, O2, O3, O4, O5, O6). The coordination mode of the L22- ligand is shown in Fig.S4a. One L22- ligand connects two Gd3+ ions [Gd1—O3 0.225 3(3) nm, Gd1—O1 0.252 7(3) nm, Gd1—O2—Gd1 105.02(11)°]. Similarly, the coordination mode of dbm- ion is shown in Fig.S4b. One dbm- ion is connected to one Gd3+ ion [Gd1—O5 0.229 2(3) nm, Gd1—O4 0.230 2(3) nm, O4—Gd—O5 72.56(10)°]. These bond lengths and bond angles of complexes 1 and 2 are comparable to those of the reported Ln2 complexes[26-29]. The data of bond lengths and bond angles for complex 2 are presented in Table S2.
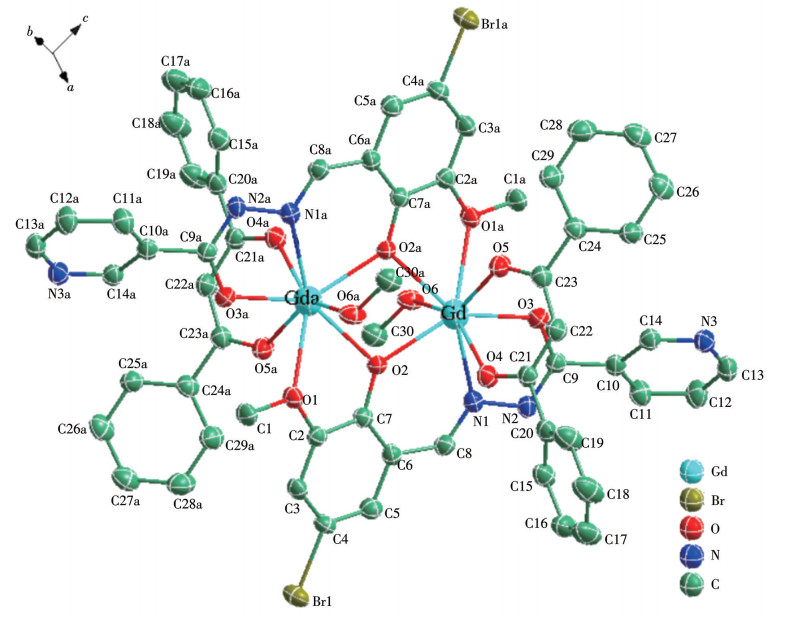
Hydrogen atoms have been omitted; Symmetry code: a: -x+1, -y+1, -z+1; Ellipsoids are drawn at a 30% probability level.
To ascertain the phase purity of complexes 1 and 2, the single crystal specimens of both complexes underwent powder X-ray diffraction (PXRD) analysis at room temperature. As shown in Fig.S5, the PXRD data from the experimental trials were carefully compared with the theoretical values calculated from the simulation of the single-crystal structure. The analysis revealed that the position and morphology of the primary peaks within the experimental dataset were essentially coincident with those of the simulated PXRD pattern, signifying that the crystalline samples of the assayed complexes 1 and 2 exhibited a high degree of phase purity.
The thermal stability analysis of complexes 1 and 2 within the temperature range from 30 to 800 ℃ is shown in Fig.S6. When the temperature of complex 1 ranged from 30 to 150 ℃, a weight loss of 2.06% (compared with the calculated value of 2.17%) was observed, indicating the loss of one CH3OH molecule. As the temperature increased, its molecular structure was gradually broken down, and the remainder was Gd2O3 (Found 32.06%, Calcd. 24.51%). For complex 2, within the temperature range from 30 to 80 ℃, a weight loss of 2.83% was observed (compared with the calculated value of 2.02%), suggesting the loss of one CH3OH molecule as well. Subsequently, its molecular structure was also gradually broken down with the rise in temperature.
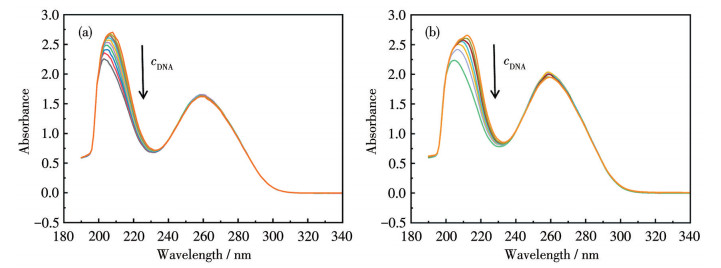
As a direct method for exploring the interaction between complexes and DNA[30-31], UV-Vis spectroscopy is used to exploit the binding of complexes with DNA, which causes absorption band broadening, absorption peak red shift, and hypochromic effect at ambient temperature. The absorption spectra were recorded within the wavelength range of 190-450 nm. The concentrations of H3L1, H2L2, complexes 1 and 2 were kept constant while the CT-DNA concentration was systematically varied. As shown in Fig.3, complexes 1 and 2 showed different levels of hypochromic effect at the absorption peak around 209 nm. The absorption peak of complex 1 showed a red shift of 5 nm, and complex 2 had a red shift of 7 nm. In contrast, for H3L1 and H2L2, as shown in Fig.S7, the absorption peaks at around 205 nm exhibited a relatively smaller hypochromic effect compared to the complexes, along with a relatively small red shift. The red shift and hypochromic effect might result from the accumulation of π electrons between the complex and the DNA base pair after the complex inserts into DNA. The coupling between the ligand′s π* empty orbital and the DNA base pair′s π orbital reduces energy levels. Subsequently, the π* orbital gets partially filled with electrons, decreasing the probability of π-π* transitions and leading to the hypochromic effect. The results indicate that complexes 1, 2, H3L1, and H2L2 can bind to CT-DNA by intercalation. As the intercalation strength increases, the discoloration effect becomes progressively more pronounced.
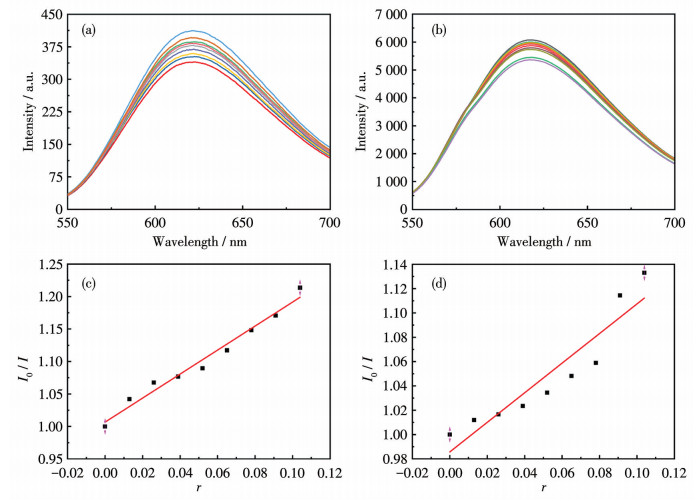
The fluorescence of the EB molecule is inherently weak due to its conjugated planar structure. However, when it inserts specifically parallel between the base pairs within the DNA double helix or triple helix, forming an EB-DNA complex, its fluorescence intensity is significantly enhanced[32]. The Stern-Volmer equation, expressed as I0/I=1+Ksvr, describes the relationship between the fluorescence intensities of the EB-DNA complex. Here, I0 represents the initial fluorescence intensity of the EB-DNA complex without any additional compound, and I is the fluorescence intensity measured after introducing various concentrations of the compound. The variable r denotes the concentration ratio of the compound to DNA. The constant Ksv, known as the linear Stern-Volmer quenching constant, can be determined from the slope of the linear plot of I0/I against r. This data provides a measure of the compound′s ability to bind to DNA, with a higher Ksv indicating stronger binding affinity.
Based on the above theoretical analysis, we conducted EB-DNA fluorescence experiments to explore the binding ability of complex 1 (complex 2, H3L1, and H2L2) with DNA. The experimental results are shown in Fig.4 as well as Fig.S8. As shown in Fig.4a and 4b, the top line indicates the fluorescence generated by the EB-DNA complex when complexes 1 and 2 were absent. As the concentrations of complexes 1 and 2 gradually increased, the fluorescence intensities decreased. Similarly, as shown in Fig.S8, the top line indicates the fluorescence generated by the EB-DNA complex when H3L1 and H2L2 were absent. With the gradual addition of H3L1 and H2L2, the fluorescence intensities also decreased. The above results indicate that complex 1 (complex 2, H3L1, and H2L2) replaces EB, which intercalates between DNA base pairs, generating a new system composed of CT-DNA and the compound. In other words, these compounds inserted themselves into CT-DNA. Furthermore, by analyzing the data in Fig.4c and 4d, we can obtain the respective Ksv values for complexes 1 and 2, which were 1.847 9 and 1.216 6. From Fig.S8c and S8d, the Ksv values for H3L1 and H2L2 were determined to be 1.178 0 and 0.656 8. These numerical values demonstrated that the bond strength follows the order of 1 > 2 > H3L1 > H2L2. This order implies that complex 1 has a relatively stronger binding affinity with CT-DNA compared to complex 2, H3L1, and H2L2. Moreover, the interaction strength between the complex and DNA is higher than the corresponding ligand. This result was consistent with the ultraviolet titration result, indicating that after the rare-earth metal salt forms a complex with the ligand, a synergistic effect occurs between them. Compared with some Ln2 complexes reported in the literature[33-37], the Ksv values of 1 and 2 are larger than those of some Ln2 complexes (Table S3).
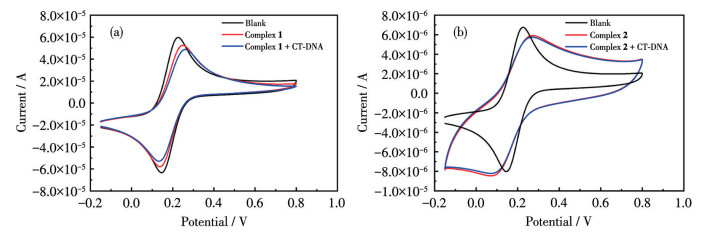
The mode of interaction between the complex and DNA can be judged according to the changes in the electrochemical properties of the complex before and after adding DNA[38]. As shown in Fig.5, the anodic peak potential (Epa) and the cathodic peak potential (Epc) of complex 1 (2) were 0.249 0 V (0.271 0 V) and 0.138 0 V (0.071 0 V), respectively. Correspondingly, the equation potential of complex 1 (2) was 0.193 5 V (0.171 0 V). After adding DNA, the Epa and the Epc of complex 1 (2) were 0.260 0 V (0.271 0 V) and 0.133 0 V (0.073 0 V), respectively. Equation potential of complex 1 (2) was 0.196 5 V (0.172 0 V). The equation potential of complexes 1 and 2 demonstrated a positive movement, suggesting that complexes 1 and 2 interact with the DNA molecule through an intercalative binding mode. As shown in Fig.S9, the Epa and the Epc of H3L1 (H2L2) were 0.149 8 V (0.268 0 V) and 0.256 1 V (0.076 0 V), respectively. Equation potential of H3L1 (H2L2) was 0.203 0 V (0.172 0 V). After adding DNA, the Epa and the Epc of H3L1 (H2L2) were 0.276 3 V (0.292 0 V) and 0.130 1 V (0.052 0 V), respectively. Equation potential of H3L1 (H2L2) was 0.203 2 V (0.172 5 V). The equation potential of H3L1 and H2L2 also showed a relatively small positive movement. In summary, the positive movement value of complex 1 was greater than that of H3L1, and the value of complex 2 was also greater than that of H2L2. It demonstrates that the interaction strength between complex 1 (2) and DNA is greater than that between its corresponding ligand H3L1 (H2L2) and DNA. The above results indicate that a synergistic effect has occurred between the rare-earth metal salts and the ligands. Thus, the results of the cyclic voltammetry analysis were consistent with those of the ultraviolet spectrometric analysis and fluorescence spectrometry analysis, and they confirmed each other.
The antimicrobial activities of DMF, Gd(dbm)3·6H2O, ligands H3L1 and H2L2, and complexes 1 and 2 were determined by employing the bacteriostatic zone test and the minimum inhibitory concentration determination method[39]. According to the results shown in Fig.S10, the inhibition zone of DMF against the four kinds of bacteria (B. subtilis, E. coli, S. aureus, and C. albicans) was less than 7 mm, and there was no antibacterial effect. Gd(dbm)3·6H2O, H3L1, and H2L2 showed relatively weak antibacterial activity against these four bacteria, with the inhibition zones ranging between 10 and 20 mm. Complexes 1 and 2 had good antimicrobial activity against these four bacteria. In addition, complex 1 showed strong antibacterial activity against B. subtilis and S. aureus, with an inhibition zone of up to 26 mm. Complex 2 demonstrated strong antibacterial activity against S. aureus, with an inhibition zone reaching 23 mm. By comparison, the antimicrobial activity of the two complexes was stronger than Gd(dbm)3·6H2O, ligands H3L1 and H2L2. This is attributed to the synergistic effect between the metal and ligands within the complex in inhibiting bacterial proliferation.
In short, we synthesized two kinds of rare earth com-plexes, namely [Gd2(dbm)2(HL1)2(CH3OH)2]·4CH3OH (1) and [Gd2(dbm)2(L2)2(CH3OH)2]·2CH3OH (2), where H3L1=(Z)-N′-(4-(diethylamino)-2-hydroxybenzylidene)propionohydrazide, H2L2=(E)-N′-(5-bromo-2-hydroxy-3-methoxybenzylidene)nicotinohydrazide), Hdbm=dibenzoylmethane. X-ray structural analysis indicates that these two complexes are dinuclear, with each Gd3+ ion being eight-coordinated. A systematic study on the structures of the two complexes and their interactions with DNA has been conducted. Subsequent studies strongly indicate that the two Gd2 complexes interact with CT-DNA through an intercalation mechanism. This is a certain reference value in the study of the interaction between the complexes and DNA, and also provides a reference basis for antibacterial activity. The understanding of the interaction between the Gd2 complexes and DNA may be related to their antibacterial mechanism. Additionally, our investigation revealed that two complexes exhibited remarkable antibacterial activity against four types of bacteria, which has certain reference value for the development of new MOFs with antibacterial properties.
LI H Y, KONG X J, HAN S D, PANG J, HE T, WANG G M, BU X H. Metalation of metal-organic frameworks: Fundamentals and applications[J]. Chem. Soc. Rev., 2024, 53: 5626-5627 doi: 10.1039/D3CS00873H
GUPTA D K, KUMAR S, WANI M Y. MOF magic: Zirconium-based frameworks in theranostic and bio-imaging applications[J]. J. Mater. Chem. B, 2024, 12: 2691-2710 doi: 10.1039/D3TB02562D
ZHANG J, KE X, HUANG M, PEI X Y, GAO S, WU D, CHEN J Y, WENG Y J. NO released via both a Cu-MOF-based donor and surface-catalyzed generation enhances anticoagulation and antibacterial surface effects[J]. Biomater. Sci., 2023, 11(1): 322-338 doi: 10.1039/D2BM01515C
LIANG F, LIANG J Q, GAO D, KONG L H, HUANG S, GUO Y Y, LIU C K, DING T. Two In-MOFs with gas adsorption and separation capability based on different pyridinyl carboxylate linkers[J]. CrystEngComm, 2024, 26: 1032-1038 doi: 10.1039/D3CE01034A
XU Y P, WANG Z Q, TAN H Z, JING K Q, XU Z N, GUO G C. Lewis acid sites in MOFs supports promoting the catalytic activity and selectivity for CO esterification to dimethyl carbonate[J]. Catal. Sci. Technol., 2020, 10(6): 1699-1707 doi: 10.1039/C9CY02330E
DHAKSHINAMOORTHY A, LI Z H, YANG S, GARCIA H. Metal-organic framework heterojunctions for photocatalysis[J]. Chem. Soc. Rev., 2024, 53: 3002-3035 doi: 10.1039/D3CS00205E
CUI Y, ZHANG J, HE H, QIAN G. Photonic functional metal-organic frameworks[J]. Chem. Soc. Rev., 2018, 47(15): 5740-5785 doi: 10.1039/C7CS00879A
XING F, XU J, ZHOU Y X, YU P Y, ZHE M, XIANG Z, DUAN X, RITZ U. Recent advances in metal-organic frameworks for stimuli- responsive drug delivery[J]. Nanoscale, 2024, 16(9): 4434-4483 doi: 10.1039/D3NR05776C
NGUYEN N T T, NGUYEN T T T, GE S B, LIEW R K, THI D Y, NGUYEN C, TRAN T V. Recent progress and challenges of MOF-based nanocomposites in bioimaging, biosensing and biocarriers for drug delivery[J]. Nanoscale Adv., 2024, 6: 1800-1821 doi: 10.1039/D3NA01075A
DAS A, BEJ S, PANDIT N R, BANERJEE P, BISWAS B. Recent advancements of metal-organic frameworks in sensing platforms: Relevance in the welfare of the environment and the medical sciences with regard to cancer and SARS-CoV-2[J]. J. Mater. Chem. A, 2023, 11(12): 6090-6128 doi: 10.1039/D2TA07938K
MARU K, SINGH A, JANGIR R, JANGIR K K. Amyloid detection in neurodegenerative diseases using MOFs[J]. J. Mater. Chem. B, 2024, 12: 4553-4573 doi: 10.1039/D4TB00373J
WANG X R, GOPALSAMY K, CLAVIER G, MAURIN G, DING B, TISSOT A, SERRE C. Lanthanide MOF-based luminescent sensor arrays for the detection of castration-resistant prostate cancer curing drugs and biomarkers[J]. Chem. Sci., 2024, 15(17): 6488-6499 doi: 10.1039/D3SC06899D
HAMARAWF R F. Antibacterial, antibiofilm, and antioxidant activities of two novel metal-organic frameworks (MOFs) based on 4, 6- diamino-2-pyrimidinethiol with Zn and Co metal ions as coordination polymers[J]. RSC Adv., 2024, 14(13): 9080-9098 doi: 10.1039/D4RA00545G
ELMEHRATH S, AHSAN K, MUMAWAR N, ALZAMIL A L, NGUYEN H, GREISH Y. Antibacterial efficacy of copper-based metal-organic frameworks against Escherichia coli and Lactobacillus[J]. RSC Adv., 2024, 14(22): 15821-15831 doi: 10.1039/D4RA01241K
AN Y W, FANG X K, CHENG J, YANG S Y, CHEN Z G, TONG Y L. Research progress of metal-organic framework nanozymes in bacterial sensing, detection, and treatment[J]. RSC Med. Chem., 2024, 15(2): 380-398 doi: 10.1039/D3MD00581J
CHEN S Q, PANG H K, SUN J N, LI K X. Research advances and applications of ZIF-90 metal-organic framework nanoparticles in the biomedical field[J]. Mater. Chem. Front., 2024, 8(5): 1195-1211 doi: 10.1039/D3QM01020A
LI S W, LIN Y H, MO C Z, BI J M, LIU C X, LU Y, JIA B, XU S M, LIU Z N. Application of metal-organic framework materials in regenerative medicine[J]. J. Mater. Chem. B, 2024, 12(35): 8543-8576 doi: 10.1039/D4TB00226A
POSTEK W, PACOCHA N, GSRSTECKI P. Microfluidics for antibiotic susceptibility testing[J]. Lab Chip, 2022, 22: 3637-3662 doi: 10.1039/D2LC00394E
LUO H, YIN X Q, TAN P F, GU Z P, LIU Z M, TAN L. Polymeric antibacterial materials: Design, platforms and applications[J]. J. Mater. Chem. B, 2021, 9(12): 2802-2815 doi: 10.1039/D1TB00109D
HAN D, LIU X, WU S. Metal organic framework-based antibacterial agents and their underlying mechanisms[J]. Chem. Soc. Rev., 2022, 51(16): 7138-7169 doi: 10.1039/D2CS00460G
LIU Y W, ZHOU L Y, DONG Y, WANG R, PAN Y, ZHUANG S, LIU D, LIU J Q. Recent developments on MOF-based platforms for antibacterial therapy[J]. RSC Med. Chem., 2021, 12: 915-928 doi: 10.1039/D0MD00416B
CHEN P, HE X H, PANG M B, DONG X T, ZHAO S, WEN Z. Iodine capture using Zr-based metal-organic frameworks (Zr-MOFs): Adsorption performance and mechanism[J]. ACS Appl. Mater. Interfaces, 2020, 12(18): 20429-20439 doi: 10.1021/acsami.0c02129
DING A, HE Y P, CHEN F F, YU Y. Antibacterial activity of M-MOF nanomaterials (M=Fe, Co, Ni, Cu, and Zn): Impact of metal centers[J]. ACS Appl. Mater. Interfaces, 2024, 7(21): 24571-24580
LIAO X W, ZHAO X P, TAN Z, WANG C, LIU W Y. Au nanoparticles in 2D bimetallic metal-organic frameworks with enhanced plasmonic nanozyme activity for antibacterial therapy[J]. ACS Appl. Mater. Interfaces, 2022, 5(11): 16145-16153
GHOSH M K, PATHAK S, GHORAI T K. Synthesis of two mononuclear Schiff base metal (M=Fe, Cu) complexes: MOF structure, dye degradation, H2O2 sensing, and DNA binding property[J]. ACS Omega, 2019, 4(14): 16068-16079 doi: 10.1021/acsomega.9b02268
LIN C B, GUO K K, GUO W X, WANG Y H, WANG K, LI Y, ZHANG S H, ZHANG X Q, ZHANG Y Q, LIANG F P. Rationally designing metal-organic frameworks based on [Ln2] magnetic building blocks utilizing 2-hydroxyisophthalate and fine-tuning the magnetic properties of Dy analogues by terminal coordinated solvents[J]. Inorg. Chem., 2020, 59(23): 16924-16935 doi: 10.1021/acs.inorgchem.0c01956
MAVRAGANI N, KITOS A A, MANSIKKMÄKI A, MURUGESU M. New members of radical bridged Ln2 metallocene single-molecule magnets based on the unsubstituted 1, 2, 4, 5-tetrazine ligand[J]. Inorg. Chem. Front., 2023, 10(1): 259-266 doi: 10.1039/D2QI02164A
YUAN F, MA H X, YUAN C M, ZHOU C S, HU H M, KUNAR A, MUDDASSIR M. Syntheses of a series of lanthanide metal-organic frameworks for efficient UV-light-driven dye degradation: Experiment and simulation[J]. CrystEngComm, 2021, 23(12): 2404-2413 doi: 10.1039/D0CE01245A
ZHANG X J, XING Y H, SUN Z, HAN J, ZHANG Y H, GE M F, NIU S Y. A series of two-dimensional metal-organic frameworks based on the assembly of rigid and flexible carboxylate-containing mixed ligands with lanthanide metal salts[J]. Cryst. Growth Des., 2007, 7(10): 2041-2046 doi: 10.1021/cg070511y
SCHAFHEIMER N, WANG Z, SCHEY K, KING J. Tyrosine/cysteine cluster sensitizing human γD-crystallin to ultraviolet radiation-induced photoaggregation in vitro[J]. Biochemistry, 2014, 53(6): 979-990 doi: 10.1021/bi401397g
LIU Z C, WANG B D, LI B, WANG Q, YANG Z Y, LI T R, LI Y. Crystal structures, DNA-binding and cytotoxic activities studies of Cu complexes with 2-oxo-quinoline-3-carbaldehyde Schiff-bases[J]. Eur. J. Med. Chem., 2010, 45(11): 5353-5361 doi: 10.1016/j.ejmech.2010.08.060
闫金龙, 吴伟娜, 王元. 一例简单的席夫碱探针对次氯酸根的荧光开启识别及生物成像应用[J]. 无机化学学报, 2024, 40(9): 1653-1660YAN J L, WU W N, WANG Y. Simple Schiff base probe for the fluorescent turn-on detection of hypochlorite and its biological imaging application[J]. Chinese J. Inorg. Chem., 2024, 40(9): 1653-1660
GUAN X F, ZHAO C Y, ZHANG Y X, WANG Y W, WANG Y Y, SHI X H, SHI Y, WANG W M. Crystal structure, fluorescence, magnetic properties and DNA binding of four novel binuclear Ln2Ⅲ complexes with Schiff ligand[J]. J. Mol. Struct., 2023, 1282: 135207
辛晓艳, 陈凤姣, 李文钰, 王捷, 杨晨, 李敏, 石瑛, 王文敏. 基于席夫碱配体构筑的LnⅢ2配合物的结构、荧光性质及生物活性[J]. 无机化学学报, 2023, 39(1): 1-12XIN X Y, CHEN F J, LI W Y, WANG J, YANG C, LI M, SHI Y, WANG W M. Crystal structure, fluorescence properties, and biological activity of Ln2Ⅲ complexes based on Schiff base ligand[J]. Chinese J. Inorg. Chem., 2023, 39(1): 1-12
马鑫, 孙娅, 孙楠, 康倩, 张佳佳, 朱瑞涛, 高晓丽. 一例由多齿席夫碱构筑的Tb2配合物的结构、荧光性质及生物活性[J]. 无机化学学报, 2024, 40(7): 1347-1356MA X, SUN Y, SUN N, KANG Q, ZHANG J J, ZHU R T, GAO X L. A Tb2 complex based on polydentate Schiff base: Crystal structure, fluorescence properties, and biological activity[J]. Chinese J. Inorg. Chem., 2024, 40(7): 1347-1356
季甲, 郭朝阳, 雷文妮, 郑佳苇, 秦浩容, 闫嘉红, 侯银玲, 辛晓艳, 王文敏. 两例基于多齿二酰腙配体构筑的双核Gd配合物的晶体结构、磁热效应及生物活性[J]. 无机化学学报, 2025, 41(4): 761-772JI J, GUO Z Y, LEI W N, ZHENG J W, QIN H R, YAN J H, HOU Y L, XIN X Y, WANG W M. Two dinuclear Gd(Ⅲ)-based complexes constructed by a multidentate diacylhydrazone ligand: Crystal structure, magnetocaloric effect, and biological activity[J]. Chinese J. Inorg. Chem., 2025, 41(4): 761-772
XIN X Y, QIAO N, CAO C S, CHEN F J, LI W Y, LING Y N, WANG W M. Crystal structure, fluorescence properties and biological activity of three μ2-O bridged Ln2 (Ln=Sm, Eu and Tb) compounds[J]. Inorg. Chim. Acta, 2022, 541: 121092 doi: 10.1016/j.ica.2022.121092
李红, 计亮年, 李伟善, 徐政和. 脱氧核糖核酸电化学研究进展[J]. 无机化学学报, 2003, 19(3): 225-232LI H, JI L N, LI W S, XU Z H. Progress in electrochemical studies of deoxyribonucleic acid[J]. Chinese J. Inorg. Chem., 2003, 19(3): 225-232
侯银玲, 季甲, 左瑶, 陆胜桃, 王欣超, 胡晓蒙, 黄晓强. 一例四核Gd(Ⅲ)簇的结构、磁性、抑菌活性及大的磁热效应[J]. 无机化学学报, 2022, 38(11): 2267-2274HOU Y L, JI J, ZUO Y, LU S T, WANG X C, HU X M, HUANG X Q. Structure, magnetic property, bacteriostatic activity, and large magnetocaloric effect of a tetranuclear Gd(Ⅲ)-based cluster[J]. Chinese J. Inorg. Chem., 2022, 38(11): 2267-2274

Figure 1 Molecular structure for complex 1
Hydrogen atoms have been omitted; Symmetry code: a: -x+1, -y+2, -z+1; Ellipsoids are drawn at a 30% probability level.

Figure 2 Molecular structure for complex 2
Hydrogen atoms have been omitted; Symmetry code: a: -x+1, -y+1, -z+1; Ellipsoids are drawn at a 30% probability level.

Figure 3 UV-Vis spectra for the interaction between complex 1 (a)/2 (b) (1.7×10⁻² mmol·L-1) and CT-DNA

Figure 4 Fluorescence spectra of EB-DNA (cDNA=4.2 μmol·L-1) complex in the presence of complexes 1 (a) and 2 (b) with different concentrations and corresponding Stern-Volmer plots [c (1), d (2)]

Figure 5 Cyclic voltammetry curves for the interaction between complexes 1 (a)/2 (b) (1.7×10⁻² mmol·L-1) and CT-DNA
Table 1. Crystallographic data and structure refinements for complexes 1 and 2
| Parameter | 1 | 2 |
| Formula | C62H80Gd2N6O16 | C62H58Br2Gd2N6O14 |
| Formula weight | 1 479.82 | 1 585.46 |
| T / K | 150.0 | 150.0 |
| Crystal system | Monoclinic | Monoclinic |
| Space group | P21/c | P21/n |
| a / nm | 1.515 72(5) | 1.348 16(4) |
| b / nm | 1.212 11(5) | 1.329 75(3) |
| c / nm | 1.887 29(7) | 1.763 92(5) |
| β / (°) | 112.730 7(12) | 105.093(1) |
| V / nm3 | 3.198 1(2) | 3.053 12(14) |
| Z | 2 | 2 |
| Dc / (g·cm-3) | 1.537 | 1.725 |
| μ / mm-1 | 2.126 | 3.532 |
| θ range / (°) | 2.047-26.394 | 1.943-26.400 |
| F(000) | 1 500 | 1 564 |
| Reflection collected | 36 429 | 57 467 |
| Unique reflection | 6 525 | 6 232 |
| Rint | 0.056 5 | 0.052 5 |
| GOF (F 2) | 1.004 | 1.025 |
| R1, wR2 [I > 2σ(I)] | 0.036 1, 0.096 3 | 0.039 9, 0.099 1 |
| R1, wR2 (all data) | 0.049 6, 0.111 4 | 0.047 1, 0.109 7 |
 下载: 导出CSV

 扫一扫看文章

扫一扫关注我们

 下载:
下载: