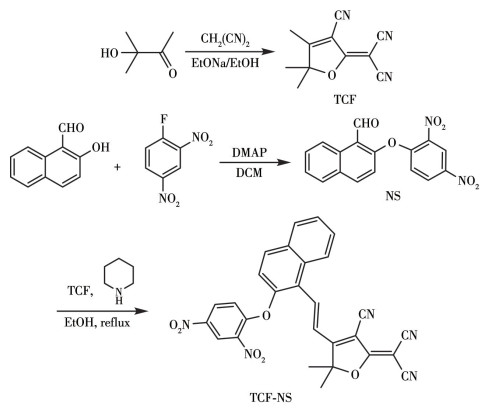
Scheme 1.
Synthesis of probe TCF-NS

Hydrogen sulfide (H2S) is an inflammable colorless gas with a distinctive odor of rotten eggs. The H2S release level can be recognized as a marker of food spoilage in terms of foodstuffs and raw foods[1]. The production of endogenous H2S and the exogenous administration of H2S have been verified to exert protective effects in many pathologies, such as relaxing vascular smooth muscle, inducing vasodilation of isolated blood vessels, and reducing blood pressure[2-3]. Meanwhile, H2S was found to be a signaling property in disorders including angiogenesis and atherosclerosis[4]. Therefore, quantitative detection of H2S is of great significance. A number of techniques have been successfully developed for H2S detection in various samples in the past years, such as electrochemical analysis[5], colorimetric method[6], and fluorescence spectroscopy[7-8]. Among these reported detection methods, the fluorescence technique, as a non-destructive method, is highly attractive in this regard due to its simplicity, high sensitivity, and real-time detection ability[9-11]. In particular, fluorescent sensors with near-infrared (NIR) emission are highly desirable due to their reduced photodamage to biological samples, deep tissue penetration, and minimum auto-fluorescence interference from complicated living systems[12-16]. 2-dicyanomethylene-3-cyano-4, 5, 5-trimethyl-2, 5-dihydrofuran (TCF) is a good chromophore that contains several excellent features, such as red emission, marked photostability, high brightness, and good biocompatibility[17-20]. As shown in Scheme 1, based on the above considerations, the probe TCF-NS (NS=2-(2, 4-dinitrophenoxy)-1-naphthaldehyde) was rationally constructed with a TCF group as the fluorophore and 2, 4-dinitrophenyl ether as the recognized site for H2S detection. Due to the excellent intramolecular charge transfer (ICT) effect of the 2, 4-dinitrophenyl ether group as a fluorophore quenching group and an H2S recognition group[21], it is often used to construct fluorescence "turn-on" fluorescent probes. In the presence of H2S, the sensor exhibits a dramatic fluorescence increase with excellent selectivity and high sensitivity. Moreover, benefiting from these advantages, the long emission wavelength sensor TCF-NS was successfully utilized for imaging of H2S in living cells and zebrafish.
Unless specifically indicated, all reagents and solvents for the experiments were purchased from commercial suppliers and used without further purification. The stock solution of TCF-NS (1 mmol·L-1) was prepared in DMSO. The water used herein was the double-distilled water treated by ion exchange columns and then by a Milli-Q water purification system. Thin-layer chromatography (TLC) involved silica GF254 plates and column chromatography involved silica gel (200-300 mesh, Haiyang Chemical Co., Ltd., Qingdao, China).
The absorption spectra were obtained on a Shimadzu UV-2600 spectrophotometer. The fluorescence spectra were obtained on a Hitachi F4600 spectrophotometer. The pH value was evaluated with a Rex laboratory pH meter (PHS-3E). 1H NMR and 13C NMR spectra were recorded on a 400 MHz NMR spectrometer (Bruker Avance). Electrospray ionization high-resolution mass spectra (ESI-HRMS) were measured using a Q Exactive mass spectrometer (Thermo Fisher, Germany). Fluorescence images were generated using an Olympus IX71 inverted fluorescence microscope equipped with a DP72 color CCD.
NaOEt (0.391 g, 5.75 mmol) was added to a solution of 3-hydroxy-3-methyl-2-butanone (4 mL, 38 mmol) and malonitrile (4.9 g, 74 mmol) in EtOH (10 mL) and stirred for 1.5 h. The reaction mixture was then refluxed for 1 h, which was then cooled to RT. The mixture was cooled and the solid precipitate was filtered to afford the title compound TCF as a pale grey solid (4.92 g, 24.70 mmol, 65%). 1H NMR (400 MHz, CDCl3): δ 2.37 (s, 3 H), 1.64 (s, 6 H). 13C NMR (101 MHz, CDCl3): δ 182.6, 175.2, 111.1, 110.4, 109.0, 104.8, 99.8, 58.5, 24.4, 14.2. ESI-HRMS (positive ion mode): m/z Calcd. for C11H9N3O: 200.082 9 (M+H+), 222.071 2 (M+Na+), 421.142 1 (2M+Na+) (Fig. S1-S3, Supporting information)
2-Hydroxy-1-naphthaldehyde (172 mg, 1.0 mmol) and K2CO3 (278 mg, 2.0 mmol) were added in DMF (3 mL) and the reaction mixture was stirred for 5 min at room temperature. Then 1-fluoro-2, 4-dinitrobenzene (186 mg, 1.0 mmol) was added and the reaction mixture was stirred at room temperature. After TLC showed the completion of the reaction, the mixture was diluted with ethyl acetate and washed with brine. The organic phase was dried over anhydrous Na2SO4. After the removal of the solvent, the residue was purified by silica gel flash column chromatography using DCM as the eluent. Compound NS was obtained as a light-yellow solid (190 mg, 56%). 1H NMR (400 MHz, CDCl3): δ 10.84 (s, 1H), 9.26 (d, J=8.7 Hz, 1H), 8.96 (d, J=2.7 Hz, 1H), 8.39 (dd, J=9.2, 2.7 Hz, 1H), 8.22 (d, J=8.9 Hz, 1H), 7.96 (d, J=8.1 Hz, 1H), 7.80 (ddd, J=8.5, 7.0, 1.3 Hz, 1H), 7.72-7.61 (m, 1H), 7.22 (d, J=8.9 Hz, 1H), 7.10 (d, J=9.2 Hz, 1H). 13C NMR (101 MHz, CDCl3): δ 189.84, 156.88, 155.23, 142.35, 139.88, 137.93, 131.78, 131.27, 130.55, 129.06, 128.63, 127.30, 125.46, 122.31, 121.61, 119.18, 118.65. ESI-HRMS (positive ion mode): [M+Na]+ 361.043 8, 393.072 3 (M+ MeOH+Na]+) (Fig.S4 and S5).
TCF (199 mg, 1 mmol), NS (338 mg, 1 mmol), and a catalytic amount of piperidine were added into 10 mL EtOH. The mixture solution was refluxed at 80 ℃ for 2 h. Then the solvent was removed with a rotary evaporator to obtain a dry mixed product. The crude product was then separated by silica gel column chromatography with CH2Cl2/ethyl acetate (20∶1, V/V) to give probe TCF-NS (red powder, 375 mg, 73.7%). 1H NMR (400 MHz, DMSO-d6): δ 8.94 (d, J=2.7 Hz, 1H), 8.56-8.08 (m, 5H), 7.79 (t, J=7.5 Hz, 1H), 7.71 (t, J=7.5 Hz, 1H), 7.57 (d, J=9.0 Hz, 1H), 7.29-7.07 (m, 2H), 1.72 (s, 6H). 13C NMR (101 MHz, DMSO-d6): δ 177.26, 174.89, 154.53, 150.13, 142.17, 139.48, 138.95, 134.31, 132.18, 131.95, 130.20, 129.60, 129.13, 127.30, 124.62, 123.29, 123.22, 122.58, 120.58, 119.38, 112.83, 112.02, 111.10, 101.59, 99.89, 55.91, 25.23. ESI-HRMS (positive ion mode): 542.107 8 (M+Na+), 1 061.227 5 (2M+Na+) (Fig.S6-S8).
Milli-Q water and spectroscopic grade DMSO were used for spectroscopic studies. Unless otherwise stated, all the fluorescence measurements were carried out in 10 mmol·L-1 phosphate-buffered saline (PBS) containing 40% DMSO as a co-solvent (pH 7.4), according to the following procedure. In a stoppered fluorescence cuvette, 5.0 mL of 20 μmol·L-1 TCF-NS in 40% DMSO-PBS solution, followed by the addition of an appropriate volume of stock solution of NaHS (H2S donor, and in this work, we used NaHS to instead of H2S for relevant experiments). The final volume of liquid in the cuvette was adjusted to 10.0 mL with PBS to obtain a 10 μmol·L-1 TCF-NS in 20% DMSO-PBS solution. After incubation at room temperature for 10 min, the solution was transferred to a quartz cell of 1 cm optical length to measure the absorbance or fluorescence. At the same time, a blank solution without NaHS was prepared and measured under the same conditions for contrast. Fluorescence spectral parameters were set as λex=530 nm, slit width: 5 nm for excitation, and 10 nm for emission.
The cytotoxicity of TCF-NS was evaluated with a CCK-8 assay. A sterilized 96-well plate was used and 100 μL RAW 264.7 cells suspension was added to each well (5×10³ cells per well). The cell culture flask was placed in the CO2 incubator for 24 h (37 ℃, CO2 with a volume fraction of 5%). 10 μL test solution of TCF-NS with different concentrations was added to the culture plate, and the culture was continued in the incubator for 24 h. Under the condition of avoiding light, 10 μL CCK-8 solution was added to each well. After 2 h, the absorbance of the probe at 450 nm was measured using a Tecan microplate reader. It is important to note that each concentration was tested in triplicate and the experiment was conducted independently three times to ensure accuracy and reproducibility. The following equation for relative cell viability was used: Rcv=(ODtreated/ODcontrol)×100%, where ODcontrol and ODtreated are the optical densities obtained in the absence and presence of TCF-NS.
RAW 264.7 cells were cultured in Dulbecco's modified Eagle's medium (DMEM) containing 10% fetal bovine serum (FBS) and 1% antibiotic (penicillin-streptomycin) at 37 ℃, 5% (volume fraction, the same below) CO2, and 95% air with a CO2 incubator (ESCO). One day before imaging, RAW 264.7 cells were passed, placed in a 12-well plate, and cultured to 50%-70% confluence. Afterward, the cells were washed with DMEM and incubated in DMEM medium containing probe TCF-NS (final concentration: 10 μmol·L-1) at 37 ℃ under 5% CO2 for 1.5 h, then were continued to be maintained for 30 min in the presence 50 μmol·L-1 of NaHS, and further treated with DAPI for another 30 min. After that, the culture medium was removed, and the cells were washed with 0.1 mol·L-1 PBS three times. Finally, fluorescence images were acquired by confocal laser scanning microscopy (Fluoview 1000, Olympus, Japan) with a 60× oil immersion objective lens, and the diode laser was used as a light source.
To determine probe TCF-NS uptake by the cells quantitatively, RAW 264.7 cells were seeded in a 24-well plate at a density of 2×10⁶ cells per milliliter before the cells were pulsed with TCF-NS at different concentrations (0, 10, and 20 μmol·L-1). After 24 h of incubation, the macrophages were dissociated using PBS followed by centrifugation for 15 min at 1 000 r·min-1 and resuspended with ice PBS for detection. Flow cytometry analysis was performed on a BD Accuri. Data were processed using the FlowJo software package.
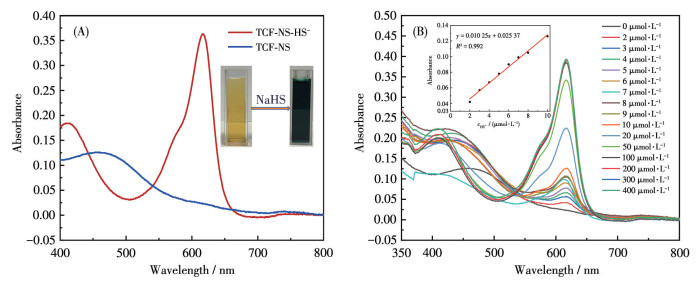
The spectral properties and sensing behaviors of TCF-NS toward NaHS (herein using NaHS as an H2S donor) in PBS (containing 20% DMSO, pH=7.4) were first investigated. As illustrated in Fig. 1A, TCF-NS (10 μmol·L-1) exhibited a maximum absorption wavelength of 458 nm. Upon the addition of NaHS, the absorption peak blue shifted from 458 to 411 nm, and at the same time, a new absorption peak appeared at 617 nm, leading to the solution color changing from pale yellow to blue under natural light (Fig. 1A, Inset). Moreover, the isosbestic point was found at about 535 nm, suggesting the generation of a new species. (Fig. 1B) A linear relationship was obtained between the absorbance at 617 nm and the concentration of HS- with a correlation coefficient of R2=0.992. (Fig. 1B, Inset). The detection limits were calculated to be 4.95 μmol·L-1. Thus, probe TCF-NS has the potential for efficient colorimetric detection of H2S in the environment without any expensive instruments.
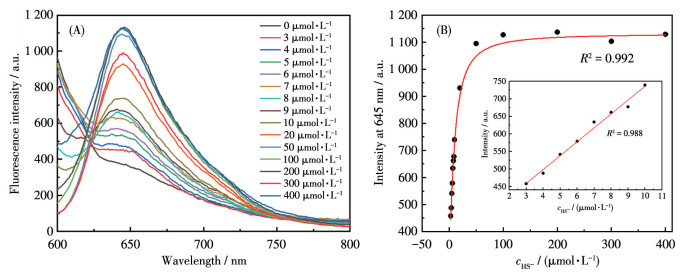
To ensure the imaging capability of the fluorophore TCF-NS in a cellular environment, we also investigated the photophysical properties of fluorophore TCF-NS before cell imaging experiments. As shown in Fig. 2A, the fluorescence intensity at 645 nm gradually enhanced when HS- (0-50 μmol·L-1) was added into the TCF-NS solution (10 μmol·L-1, in 20% DMSO-H2O). With the increasing concentration of HS, the fluorescence intensity tended to remain constant. A linear relationship was obtained between the fluorescence signal and concentration of HS- with a correlation coefficient of R2 =0.998 (Fig. 2B). The detection limits were calculated to be 0.15 μmol·L-1. Due to a photoinduced electron transfer (PET) process with the 2, 4-dinitrobenzene moiety acting as the electron acceptor, probe TCF-NS was essentially non-fluorescent. Upon addition of 10 equiv. of NaHS (a standard source for H2S), probe TCF-NS showed a strong fluorescent emission, indicating that probe TCF-NS can be used as a dual colorimetric and fluorescent sensor for H2S.
Inset: linear relationship with the addition of NaHS (0.3-1.0 equiv.).
Selectivity is one of the important factors to be considered when judging the performance of fluorescent probes. To study the selectivity of the sensor TCF-NS toward HS-, we compared its fluorescent response in the presence of HS- or other anions. It can be seen from Fig. 3A and Fig.S9 that the sensor was inert to other species, such as ClO-, CO32-, HPO42-, HCO3-, HSO3-, NO2-, S2O32-, Al3+, Ca2+, Co2+, Cu2+, Fe2+, Fe3+, Li+, Mg2+, Mn2+, Ni2+, Zn2+, Cys, GSH, and Hcy. In comparison, only HS- elicited a dramatic increase in fluorescence intensity at 653 nm, suggesting the outstanding selectivity of the sensor. Furthermore, the coexistence of other potentially interfering species in sensor solutions had negligible interfering effects on the detection of HS- (Fig. 3B and Fig.S10). The excellent selectivity for HS- over other analytes shows the sensor's potential applications for HS- detection in complex biological environments.
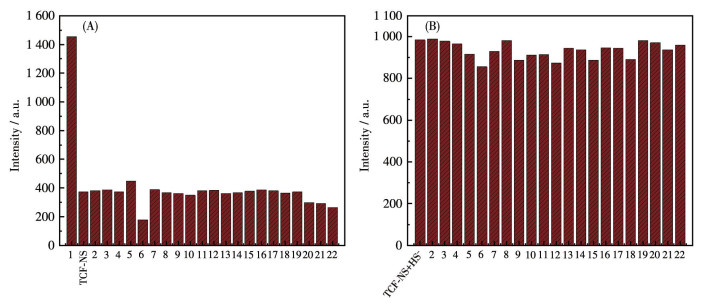
1: HS-, 2: ClO-, 3: CO32-, 4: HPO42-, 5: HCO3-, 6: HSO3-, 7: NO2-, 8: S2O32-, 9: Al3+, 10: Ca2+, 11: Co2+, 12: Cu2+, 13: Fe2+, 14: Fe3+, 15: Li+, 16: Mg2+, 17: Mn2+, 18: Ni2+, 19: Zn2+, 20: Cys, 21: GSH, 22: Hcy.
Reaction time is an important factor for reaction-based probes, and then the time required for the reaction of TCF-NS with H2S at room temperature was investigated. As shown in Fig. 4, the fluorescence intensity increased with the reaction time and then almost leveled off at a reaction time greater than about 100 s. Thus, an assay time of 10 min was selected for the quantification of H2S. The results showed that the TCF-NS would provide a rapid analytical method for the detection of H2S.

To evaluate the practical applications of the probe TCF-NS under physiological conditions, we examined the fluorescence response of the probe TCF-NS at different pH conditions (with and without NaHS) (Fig. 5). The results suggested that when the pH ranged from 4.0 to 9.0, the fluorescence intensity of only the probe TCF-NS had almost no change. However, for the TCF-NS+NaHS system, we observed changes in fluorescence intensity that were negligible in the two pH intervals (pH 4.0-6.0 and pH 7.5-9.0). In the range of pH 6.5-7.5, the fluorescence intensity of the TCF-NS+ NaHS system changed, and the maximum fluorescence intensity was observed around pH 7.5. This pH value just belongs to the physiological level of the human body. The above results indicate that TCF-NS can be used for the monitoring of NaHS under physiological conditions.

Usually, HS- is used as the source of H2S for imaging of H2S in living cells. Favorable fluorescence properties of the as-synthesized TCF-NS for HS- prompted us to establish its utility for the determination of H2S in living cells. Before being applied in intracellular imaging, the cytotoxicity of probe TCF-NS was assessed with RAW264.7 cells by the CCK-8 method. As shown in Fig.S11, it displayed that the sensor possessed certain cell viability (> 85%) even though the concentration of the sensor was added up to 40 μmol·L-1. These results indicated that the sensor is favorable for fluorescence recognition of HS- (a kind of exogenous H2S source) in live cells. Then RAW264.7 cells were chosen for cellular imaging of exogenous H2S. The cells were pre-incubated with 20 μmol·L-1 of HS- for 2 h and then treated with 10 μmol·L-1 of TCF-NS for another 40 min at 37 ℃. As could be observed in Fig. 6, the cells exhibited weak red fluorescence only upon being treated with the TCF-NS, but showed strong red fluorescence when treated with the TCF-NS+ HS-. These results are a clear indication that our TCF-NS can be adapted to monitor H2S level change inside live cells.
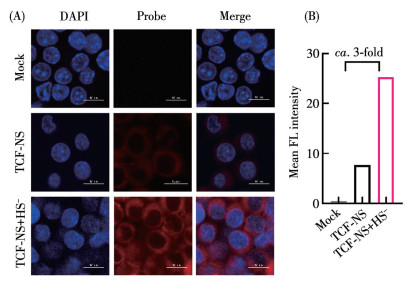
The scale bar is 20 μm.
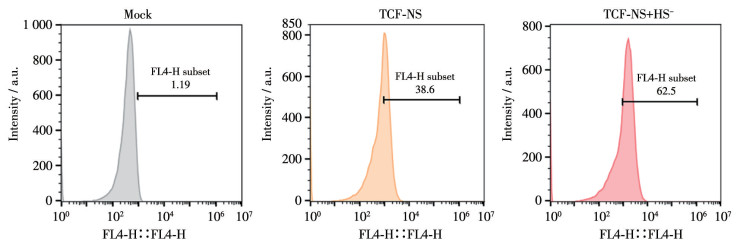
To quantize the difference in fluorescence intensity in cells and get a more precise result of the imaging for H2S, the flow cytometry study was performed. As illustrated in Fig. 7, the fluorescence intensities were enhanced with the addition of NaHS in TCF-NS co-incubation RAW264.6 cells, which was consistent well with those from fluorescence imaging of the cells. These overall results reveal that TCF-NS works as a powerful molecular tool for the visualization and quantitative detection of H2S levels in living cells.
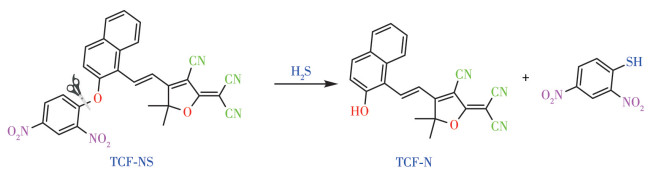
Previous studies have reported that the 2, 4-dinitrobenzene ether can be thiol hydrolyzed to generate a phenolic hydroxyl group[23]. So, we can speculate that the response mechanism of the probe TCF-NS to H2S (Scheme 2).
To confirm this inference, the reaction of TCF-NS with H2S was carried out by ESI-MS analysis. As shown in Fig. S12, The ESI-MS spectrum of the reaction product displayed a main peak at m/z 199 and 352 (negative ion mode), which could be assigned to 2, 4-dinitrobenzenethiol and compound TCF-N. These results supported our hypothesis that the thiol hydrolysis 2, 4-dinitrobenzene ether.
A novel TCF-based fluorescent probe TCF-NS was synthesized for specifical detection of H2S by nucleophilic substitution reaction to release the TCF fluorophore, showing a turn-on response. The TCF-NS exhibited excellent selectivity, sensitivity (detection limits of 4.95 and 0.15 μmol·L-1 for UV-Vis and fluorescence spectrum, respectively), and fast response (within 2 min) for detection H2S. Significantly, the imaging experiment of H2S in cells demonstrated that TCF-NS could be used for the detection of H2S in vitro and in vivo. Thus, we believe that TCF-NS could be used as a valuable molecular tool for H2S-related disease visualization diagnosis in the future.
Supporting information is available at
WANG L Y, ZHANG C F, TANG H, CAO D R. A novel chromophore reaction-based pyrrolopyrrole aza-BODIPY fluorescent probe for H2S detection and its application in food spoilage[J]. Food Chem., 2023, 427: 136591. doi: 10.1016/j.foodchem.2023.136591
GONG S Y, ZHENG Z P, GUAN X G, FENG S, FENG X G, FENG S M, FENG G Q. Near-infrared mitochondria-targetable fluorescent probe for high-contrast bioimaging of H2S[J]. Anal. Chem., 2021, 93(14): 5700-5708. doi: 10.1021/acs.analchem.0c04639
RAJALAKSHMI K, MUTHUSAMY S, LEE H J, KANNAN P, ZHU D W, SONG J W, NAM Y S, HEO D N, KWON I, LUO Z B, XU Y G. Dual-channel fluorescent probe for discriminative detection of H2S and N2H4: Exploring sensing mechanism and real-time applications[J]. J. Hazard. Mater., 2024, 465: 133036. doi: 10.1016/j.jhazmat.2023.133036
CHEN S T, LIU T, YUAN X M, ZHOU L Y. Construction of an effective near-infrared fluorescence "turn-on" probe for hydrogen sulfide detection and imaging in living inflammatory cell and zebrafish models[J]. Spectroc. Acta Pt. A-Molec. Biomolec. Spectr., 2024, 323: 124863. doi: 10.1016/j.saa.2024.124863
SHANG H Y, DONG X, ZHANG X F, ZHANG A P, DU J W. Electrocatalytic-induced electrochemical sensor based on the heterojunction Cu-Ni/Ni(OH)2 for the detection of hydrogen sulfide[J]. ACS Appl. Nano Mater., 2023, 6(24): 23576-23584. doi: 10.1021/acsanm.3c05075
ZHANG H L, LI S Y, ZHENG H P, HAN Z Z, LIN B, WANG Y Y, GUO X J, ZHOU T G, ZHANG H B, WU J J, ZHANG H, TANG J L. A visual color response test paper for the detection of hydrogen sulfide gas in the air[J]. Molecules, 2023, 28(13): 5044. doi: 10.3390/molecules28135044
XIAO X, SHEN Y Z, ZHOU X, SUN B G, WANG Y, CAO J X. Innovative nanotechnology-driven fluorescence assays for reporting hydrogen sulfide in food-related matrices[J]. Coord. Chem. Rev., 2023, 480: 215012. doi: 10.1016/j.ccr.2023.215012
BU D D, WANG Y Y, WU N, FENG W, WEI D H, LI Z X, YU M M. A mitochondrial-targeted ratiometric probe for detecting intracellular H2S with high photostability[J]. Chin. Chem. Lett., 2021, 32(5): 1799-1802. doi: 10.1016/j.cclet.2020.12.044
HUANG J J, ZOU X R, LIU X E, RAN H Y, PANG M L, ZHAO L L, WANG P, CHEN J, CHEN M Z, PENG Y B. Construction of a highly specific fluorescence "turn-on" probe for H2S detection and imaging in drug-induced live cells, zebrafish and mice arthritis models[J]. Spectroc. Acta Pt. A-Molec. Biomolec. Spectr., 2024, 323: 124928. doi: 10.1016/j.saa.2024.124928
CAI W J, XIN T, TU Y Y, SUN L L, LIAO G M, LIU G, FAN C B. A near-infrared turn-on fluorescent probe for the detection of hydrogen sulfide in water samples and food spoilage[J]. Anal. Chim. Acta, 2024, 1320: 342992. doi: 10.1016/j.aca.2024.342992
YANG Y X, CHEN L, HU X L, ZHONG K L, LI S D, YAN X M, ZHANG J L, TANG L J. Synthesis of a turn-on fluorescent probe for hydrogen sulfide and its application in red wine and living cells[J]. Chin. J. Org. Chem., 2023, 43(1): 308-312. doi: 10.6023/cjoc202207011
ZHAO X J, JIANG Y R, LI Y T, YANG B Q, LIU C, LIU Z H. A novel "turn-on" mitochondria-targeting near-infrared fluorescent probe for determination and bioimaging cellular hydrogen sulfide[J]. Spectroc. Acta Pt. A-Molec. Biomolec. Spectr., 2019, 212: 71-77. doi: 10.1016/j.saa.2018.12.046
MAO Y Y, LI Y B, WANG H J, SUN Y X, YU S L, NIU H Y, YE T Q, GUO L H, LI L, WANG J B. Near-infrared fluorescent probe based on the regulatory dye pKa for imaging of H2S in rice roots and living cells[J]. Spectroc. Acta Pt. A-Molec. Biomolec. Spectr., 2024, 321: 124762. doi: 10.1016/j.saa.2024.124762
FANG W L, HE S, GUO X F, WANG H. A novel near infrared probe with large Stokes shift for detection of H2S in living cells[J]. Sens. Actuator B-Chem., 2023, 375: 132961. doi: 10.1016/j.snb.2022.132961
SONG J T, YUAN Y H, ZHU Y J, WANG Y Z, TIAN M Z, FENG F. Research progress of near-infrared fluorescent probes for hydrogen sulfide[J]. Spectrosc. Spectr. Anal., 2022, 42(11): 3321-3329.
ZHONG K L, CHEN L, PAN Y X, YAN X M, HOU S H, TANG Y W, GAO X, LI J R, TANG L J. A colorimetric and near-infrared fluorescent probe for detection of hydrogen sulfide and its real multiple applications[J]. Spectroc. Acta Pt. A-Molec. Biomolec. Spectr., 2019, 221: 117135. doi: 10.1016/j.saa.2019.117135
LI X H, YAN J L, WU W N, ZHAO X L, WANG Y, FAN Y C, XU Z H. A dual-response fluorescent probe for SO2 and viscosity and imaging application in lysosomes and zebrafish[J]. Microchem. J., 2022, 181: 107653. doi: 10.1016/j.microc.2022.107653
LINGHU Y N, LIU M, WANG M, LUO Y, LAN W S, WANG J Y. A near-infrared hepatocyte-targeting probe based on tricyanofuran to detect cysteine in vivo: Design, synthesis and evaluation[J]. Spectroc. Acta Pt. A-Molec. Biomolec. Spectr., 2024, 322: 124802. doi: 10.1016/j.saa.2024.124802
YAN K C, GARDINER J E, SEDGWICK A C, THET N, HEYLEN R A, JAMES T D, JENKINS A T A, HE X P. A TCF-based fluorescent probe to determine nitroreductase (NTR) activity for a broad spectrum of bacterial species[J]. Chem. Commun., 2023, 59(53): 8278-8281. doi: 10.1039/D3CC00462G
LI D P, HAN X J, YAN Z Q, CUI Y, MIAO J Y, ZHAO B X. A farred ratiometric fluorescent probe for SO2 derivatives based on the ESIPT enhanced FRET platform with improved performance[J]. Dyes Pigments., 2018, 151: 95-101. doi: 10.1016/j.dyepig.2017.12.056
WANG R, YU F B, CHEN L X, CHEN H, WANG L J, ZHANG W W. A highly selective turn-on near-infrared fluorescent probe for hydrogen sulfide detection and imaging in living cells[J]. Chem. Commun., 2012, 48(96): 11757-11759. doi: 10.1039/c2cc36088h
WANG X Y, MIN J, WANG W J, WANG Y, YIN G, WANG R Y. A novel porphyrin-based near-infrared fluorescent probe for hypochlorite detection and its application in vitro and in vivo[J]. Analyst, 2018, 143(11): 2641-2647. doi: 10.1039/C8AN00586A
FOSNACHT K G, PLUTH M D. Activity-based fluorescent probes for hydrogen sulfide and related reactive sulfur species[J]. Chem. Rev., 2024, 124(7): 4124-4257. doi: 10.1021/acs.chemrev.3c00683

Figure 1 UV-Vis spectra of the samples: (A) 10 μmol·L-1 TCF-NS and 10 μmol·L-1 TCF-NS+50 μmol·L-1 NaHS (Inset: photos of 10 μmol·L-1 TCF-NS without and with the presence of 40.0 equiv. HS-; (B) 10 μmol·L-1 TCF-NS in 20% DMSO-PBS (pH=7.4) upon gradual addition of NaHS (0-40.0 equiv.) at room temperature (Inset: linear relationship with the addition of 0-1.0 equiv. NaHS)

Figure 2 (A) Fluorescence emission spectra of 10 μmol·L-1 TCF-NS upon gradual addition of HS- (0-40.0 equiv.) in 20% DMSO-PBS (pH=7.4); (B) Plot of fluorescence intensity at 645 nm for TCF-NS (10 μmol·L-1) vs concentration of HS- (0-40.0 equiv.)
Inset: linear relationship with the addition of NaHS (0.3-1.0 equiv.).

Figure 3 (A) Fluorescence intensity of TCF-NS at 645 nm upon addition of different analytes in 20% DMSO-PBS solution (λex=530 nm); (B) Fluorescence intensity of TCF-NS+HS- at 645 nm upon addition of different analytes in 20% DMSO-PBS solution (λex=530 nm)
1: HS-, 2: ClO-, 3: CO32-, 4: HPO42-, 5: HCO3-, 6: HSO3-, 7: NO2-, 8: S2O32-, 9: Al3+, 10: Ca2+, 11: Co2+, 12: Cu2+, 13: Fe2+, 14: Fe3+, 15: Li+, 16: Mg2+, 17: Mn2+, 18: Ni2+, 19: Zn2+, 20: Cys, 21: GSH, 22: Hcy.

Figure 4 Time-dependent plot of fluorescence intensity at 645 nm vs time for 10 μmol·L-1 of the TCF-NS in 20% DMSO-PBS (pH=7.4) solution upon addition of 40 μmol·L-1 HS- with λex=530 nm

Figure 5 Effect of pH upon the fluorescence intensity of the sensor (10 μmol·L-1) in the absence (black curve) and presence (red curve) of HS- (5.0 μmol·L-1) after 300 s in different 20% DMSO-PBS solutions (10 mmol·L-1, pH=4-9) with λex=530 nm

Figure 6 (A) Fluorescence images of the living RAW264.7 cells for mock, TCF-NS, and TCF-NS+HS- groups; (B) Relative fluorescence intensity of testing groups (TCF-NS and TCF-NS+HS-)
The scale bar is 20 μm.

Figure 7 Flow cytometry study of TCF-NS in RAW264.7 cells treated without and with NaHS

 扫一扫看文章

扫一扫关注我们
 下载:
下载:

 下载:
下载:

 下载:
下载: