Figure 1.
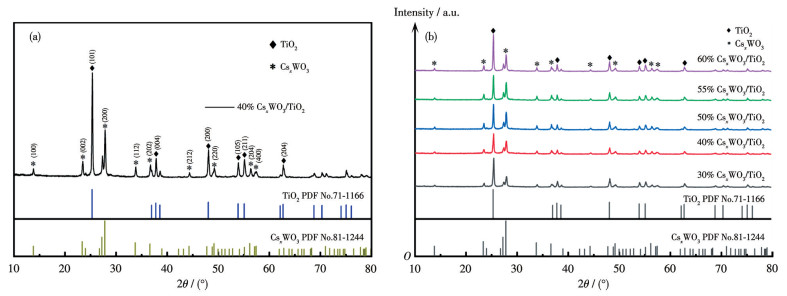
XRD patterns of (a) 40% CsxWO3/TiO2 and (b) a series of CsxWO3/TiO2 composites
Preparation and photocatalytic performance of CsxWO3/TiO2 based on full spectral response
Zhangyong LIU , Lihui XU , Yue YANG , Liming WANG , Hong PAN , Xinzhe HUANG , Xueqiang FU , Yingxiu ZHANG , Meiran DOU , Meng WANG , Yi TENG

As global environmental and energy issues become more and more prominent, photocatalytic treatment of pollutants is receiving more and more attention[1-2]. Currently, photocatalyst studies have focused on ultraviolet (UV)‐driven TiO2[3-4] and ZnO[5-6] as well as visible (Vis)‐responsive C3N4[7-8] and Bi2WO6[9-10]. However, sunlight reaching the Earth′s surface is 52%‐55% of near‐infrared (NIR) (> 790 nm), 42%‐43% of Vis (400‐700 nm), and 3%‐5% of UV (< 400 nm) in terms of energy[11]. These photocatalysts are only a single response to limited wavelengths, such as UV and Vis light. The efficiency of solar energy utilization is greatly reduced. Researchers are trying to maximize the use of solar energy. In particular, many efforts have been made for the application of NIR light in photodegradation[12-13], water decomposition[14-15], CO2 reduction[16-17], and NOx removal[18-19].
In recent years, some researchers have found that, unlike the single response of currently available photocatalysts, CsxWO3 exhibits a good photocatalytic response in the UV, Vis, and NIR[20-22]. For CsxWO3, Cs+ can be inserted into the lattice. A mixed chemical valence of W6+ and W5+ is formed. It exhibits strong localized surface plasmon resonance (LSPR) absorption in the NIR range. Meanwhile, due to the abundant WO6-x[23] units in CsxWO3, CsxWO3 exhibits reversible photochromic activity. Because of the excellent properties of CsxWO3, many researchers have investigated the preparation methods and photocatalytic properties of CsxWO3‐based composites. Li et al.[24] synthesized g‐C3N4@CsxWO3 solvothermally by solvent‐thermal synthesis. Irradiation with full‐spectrum light was used for 240 min. Its degradation of toluene gas was about 413 g·m-3. Li et al.[25] used melamine resin as a template to prepare composite materials with an adsorption/autothermal photothermal catalytic synergistic effect of BiOBr/CsxWO3@SiO2 composite aerogel. The adsorption/autothermal photothermal catalyzed degradation of tetracycline was close to 100% after adsorption in the dark room for 30 min and light irradiation under a xenon lamp for 60 min. Ye et al.[26] used hydrothermal synthesis of CsxWO3/TiO2 with Vis light irradiation for 120 min. The maximum degradation rate of rhodamine B (RhB) was 79.7%. Huang et al.[27] experimented with photocatalytic nitrogen fixation by studying different atmospheres. They skillfully designed photocatalysts for dynamic structure repair, elucidated the aerobic photocatalytic nitrogen reduction reaction (pNRR) mechanism, and provided new ideas for photocatalytic experiments.
In this work, CsxWO3/TiO2 composites with good morphology and uniform size were synthesized by the one‐step solvothermal method using self‐made CsxWO3 and TiO2 as raw materials. By adjusting the ratio between CsxWO3 and TiO2 in the composite, the adsorption and degradation effects of the composite on methylene blue (MB) solution were investigated. The cyclic stability test and the photocatalytic mechanism were also carried out. The CsxWO3/TiO2 composite synthesized in this paper has excellent full‑spectrum response properties. Its photocatalytic effect is greatly improved over that of the single raw material. Excellent photocatalytic stability was demonstrated in cyclic stability tests.
All chemical reagents in this study were of analytical grade and could be employed without further purification. Tungsten hexachloride (WCl6), cesium hydroxide monohydrate (CsOH·H2O), glacial acetic acid, polyvinylpyrrolidone (PVP, Mw=50 000), tetrabutyl titanate (TBOT), and hydrochloric acid (AR) were purchased from Sinopharm Chemical Reagent Co., Ltd. Anhydrous ethanol and isopropanol were obtained from Shanghai Titan Scientific Co., Ltd. Deionized water was prepared in‐house using laboratory purification systems.
First, 0.396 6 g (1 mmol) of WCl6 was dissolved in 40 mL of anhydrous ethanol under magnetic stirring. Subsequently, 0.085 2 g (0.5 mmol) of CsOH·H2O was introduced into the homogeneous mixture. After achieving a slightly yellow clarified solution through continuous stirring, 10 mL of glacial acetic acid and a predetermined quantity of PVP were sequentially added, followed by vigorous stirring for 30 min to ensure complete homogenization. The resultant solution was transferred into a PTFE‐lined stainless steel autoclave and subjected to hydrothermal treatment at 220 ℃ for 12 h. Upon completion of the reaction cycle, the system was passively cooled to ambient temperature. The precipitate underwent three sequential washing cycles using deionized water and anhydrous ethanol through centrifugation. Ultimately, the purified product was desiccated in a vacuum oven at 60 ℃ for 12 h, yielding dark blue nanoscale CsxWO3 particles.
Initially, 10 mL of TBOT was slowly added to 100 mL of anhydrous ethanol under continuous stirring for 30 min. Subsequently, 1 mL of deionized water was introduced dropwise to the mixture. After stirring for an additional 1 h, the solution was allowed to stand undisturbed for 1 h. The resulting suspension was centrifuged and sequentially washed with deionized water and ethanol. The collected precursor was dried at 80 ℃ for 12 h to yield a white intermediate powder. Finally, the precursor was calcined in a muffle furnace under static air atmosphere by heating to 550 ℃ at a rate of 5 ℃·min-1 and maintained at this temperature for 5 h, resulting in TiO2 powder.
A predetermined quantity of TiO2 was dispersed in 100 mL of isopropanol. Ultrasonication and magnetic stirring were alternately performed until a homogeneous suspension was formed. Subsequently, a controlled amount of CsxWO3 combined with PVP was introduced into the mixture, and the pH was adjusted to be less than or equal to 2. After continuous magnetic stirring for 2 h, the homogeneous solution was transferred to a PTFE‑lined reactor and maintained at 200 ℃ for 6 h. Upon reaction completion, the product was cooled to ambient temperature, followed by three sequential washing cycles with deionized water and anhydrous ethanol. The final material was dried in a vacuum oven at 60 ℃ for 12 h. By systematically varying the mass fraction of CsxWO3 in the CsxWO3/TiO2 composites (30%, 40%, 50%, 55%, 60%), a series of samples were synthesized and designated as 30% CsxWO3/TiO2, 40% CsxWO3/TiO2, 50% CsxWO3/TiO2, 55% CsxWO3/TiO2, 60% CsxWO3/TiO2, respectively.
The sample morphology of the CsxWO3/TiO2 composites was observed using a VEGE 3 SBH‐EasyProbe type scanning electron microscope (SEM, operating voltage: 20 kV). The microstructure of CsxWO3/TiO2 composites was observed using a JEOL JEM‐F200 transmission electron microscope (TEM, operating voltage: 200 kV). The crystal structure of CsxWO3/TiO2 composites was analyzed using a Philips X′ Pert MPD Pro type rotary‐target X‐ray diffractometer (XRD, Cu Kα radiation, λ=0.154 nm, the working voltage was 40 kV, the current was 40 mA, 2θ=10°‐80°). Diffuse reflectance spectra (DRS) were obtained using a Japan Shimadzu UV‐3600 for light absorption and band gap calculations. UV‐Vis and UV‐Vis‐NIR tests were performed using the Japan Shimadzu UV‐3600, with different wavelengths for the two tests, 200‐800 nm for UV‐Vis and 200‐2 500 nm for UV‐Vis‐NIR. The surface elemental composition and valence states in CsxWO3/TiO2 composites were tested using a Thermo Scientific K‐Alpha X‐ray photoelectron spectrometer (XPS). Brunner‐Emmet‐Teller (BET) surface area analysis was performed using an automated surface area and pore size analyzer (AUTOSORBIQ, Quantachrome, USA).
The instrument used was an XPA‐7 photochemical reactor. Then, 10 mg of photocatalyst was added to 100 mL of MB solution (20 mg·L-1). Stirring in a dark environment for 60 min, 5 mL of supernatant was taken every 10 min, centrifuged, and tested for its absorbance. Then the photocatalytic reaction lamp was turned on, and 5 mL of the supernatant was taken at certain intervals (UV: 10 min, Vis: 20 min, NIR: 1 h), centrifuged, and tested for its absorbance. The degradation rate (η) was calculated according to the following equation:
|
|
where ρ was the mass concentration of MB solution at time t and ρ0 was the initial mass concentration (concentration before dark adsorption, 20 mg·L-1) of MB solution.
According to the Lambert‐Beer law, A was proportional to ρ. Therefore, the degradation rate can be calculated by the following equation:
|
|
where A was the absorbance of the MB solution at time t, and A0 was the initial absorbance of the MB solution.
This experiment tested the photocatalytic cycling performance of the prepared 40% CsxWO3/TiO2 nanocomposite. At the end of each photocatalytic experiment, the remaining photocatalyst in the MB solution was filtered. The experiment was repeated five times to simulate the cycling process. Each photocatalytic cycling process was performed under the same conditions using 100 mL of MB (20 mg·L-1) solution. Samples were taken every 20 min at the end of dark adsorption. The photocatalysts were filtered by centrifugation, and the photocatalytic performance of the photocatalysts was assessed spectrophotometrically by the change in methyl bromide concentration.
The crystal structure of the samples was tested and analyzed using XRD. The results are shown in Fig. 1.
Fig. 1a shows the XRD patterns of 40% CsxWO3/TiO2 composites compared with CsxWO3 (PDF No.81‐1244) as well as standard cards of anatase TiO2 (PDF No.71‐1166). As can be seen in Fig. 1a, the diffraction peaks at 13.66°, 23.40°, 27.68°, 33.86°, 36.54°, 44.48°, and 49.21° correspond to the standard characteristic peaks of the (100), (002), (200), (112), (202), (212), and (220) crystal planes of CsxWO3, respectively[28]. It is demonstrated that CsxWO3 is successfully prepared using the solvothermal method, and the introduction of TiO2 into the solvothermal reaction does not alter the structural features of CsxWO3. The diffraction peaks at 25.28°, 37.79°, 48.04°, 53.88°, 55.07°, and 62.69° correspond to the standard characteristic peaks at (101), (004), (200), (105), (211), and (204) crystal planes of anatase TiO2, respectively[29]. It is shown that anatase TiO2 is successfully prepared by hydrolysis. The solvothermal reaction does not change the structural features of TiO2. For CsxWO3/TiO2 composites, all peaks can be attributed to CsxWO3 or TiO2 without other impurity peaks. The successful formation of CsxWO3/TiO2 heterojunction was demonstrated. It is particularly noted that, as shown in Fig. 1b, the intensity of the diffraction peaks of CsxWO3 gradually increased with the increase of CsxWO3 content.
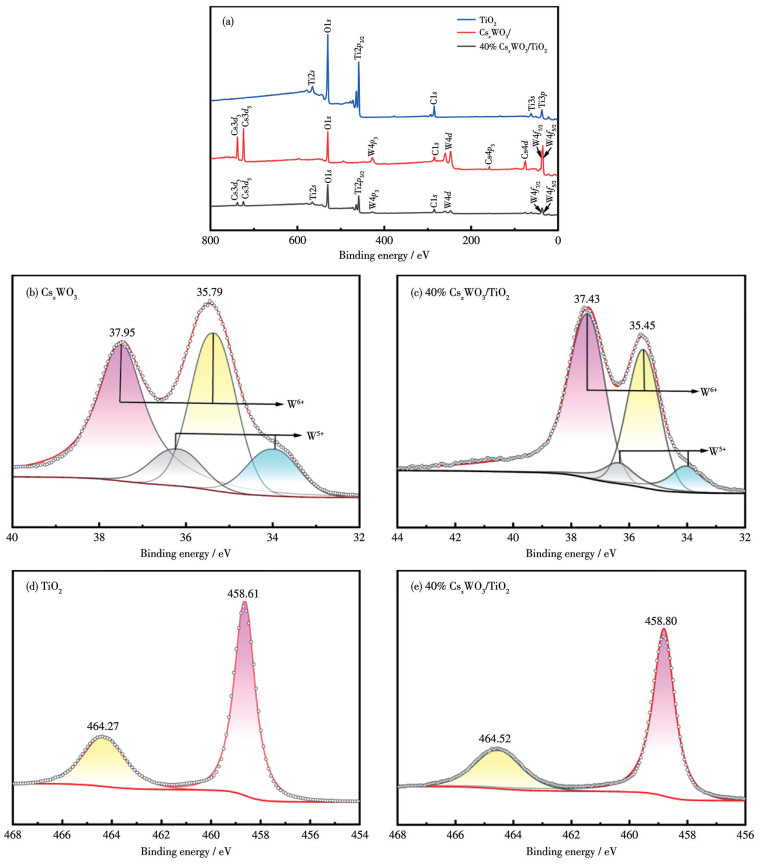
XPS was further applied to study the chemical states of atoms in TiO2, CsxWO3, and 40% CsxWO3/TiO2. The results are presented in Fig. 2.
As shown in Fig. 2a, the chemical binding energies of about 458.80 eV (Ti2p3/2), 530.03 eV (O1s), 724.21 eV (Cs3d), and 35.45 eV (W4f7/2) characterize the elements Ti, O, Cs, and W. The successful formation of CsxWO3/TiO2 heterojunction was further confirmed. The core energy level W4f XPS spectra of CsxWO3 and 40% CsxWO3/TiO2 are shown in Fig. 2b and 2c. The higher energies, 35.79 and 37.95 eV, in W4f7/2 and W4f5/2 belong to W6+. The lower energies, 34.24 and 36.29 eV, in W4f7/2 and W4f5/2 are from the reduced W5+. Similarly, in 40% CsxWO3/TiO2 complexes, the higher energies, 35.45 and 37.43 eV, in W4f7/2 and W4f5/2 belong to W6+. The lower energies, 33.91 and 36.03 eV, in W4f7/2 and W4f5/2 come from reduced W5+. The interconversions between W6+ and W5+ provide the electron transfer and small polariton absorption. This favors carrier migration[30]. For CsxWO3 and its composites, it was observed that the W4f peak was shifted to the low‐energy region (35.79 eV negatively shifted by 0.34 eV), while the Ti2p peak was shifted to the high‐energy region (458.61 eV positively shifted by 0.19 eV) (Fig. 2d and 2e). The displacement of these peaks is due to the transfer of electrons from TiO2 to CsxWO3[22].
To study the surface morphologies of the synthesized 40% CsxWO3/TiO2 nanoparticles, SEM analyses were carried out, and the results are shown in Fig. 3.
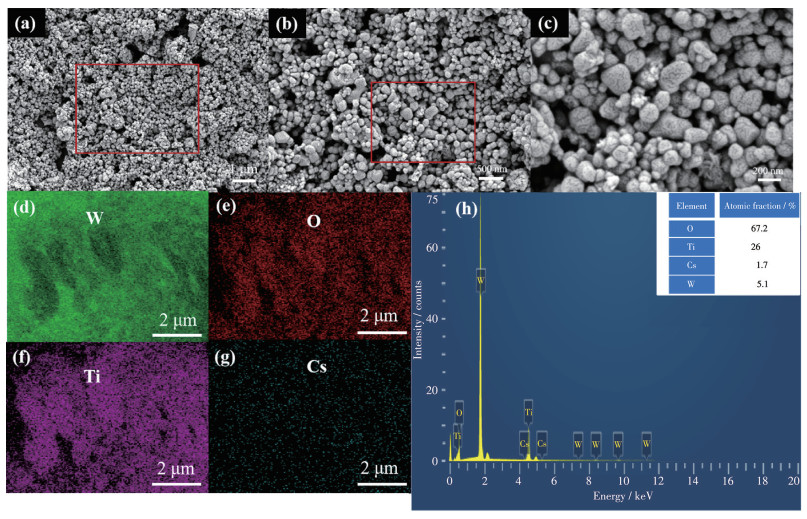
Inset: atomic fractions of the elements in 40% CsxWO3/TiO2.
As shown in Fig. 3a‐3c, CsxWO3 showed nanoparticles with a polyhedral structure. TiO2 was spherical, granular, and uniformly attached to the surface of CsxWO3 nanoparticles. The successful formation of CsxWO3/TiO2 heterojunction was further confirmed. This structure facilitates the migration of photogenerated electrons between CsxWO3 and TiO2, reducing the recombination rate of photogenerated electron (e-)‐hole (h+) pairs. Typical energy dispersive spectroscopy (EDS) element mappings and EDS spectrum of 40% CsxWO3/TiO2 nanoparticles are given in Fig. 3d‐3h. The inset in Fig. 3h shows the atomic fraction content of 40% CsxWO3/TiO2. The mass fraction content of CsxWO3 in the composite product was calculated to be about 40% by using the atomic fraction content of elemental W and Ti to represent CsxWO3 and TiO2, respectively. This result was consistent with the content of the composite product in the previous experimental section. It can be seen from the EDS element mappings that the CsxWO3 nanoparticles were uniformly bound to TiO2 nanoparticles. EDS spectral analysis showed that the signals of each element appeared individually. The formation of CsxWO3/TiO2 heterojunction was further confirmed. SEM and EDS analysis results showed that the composites were solvent heat‐treated at 180 ℃. TiO2 nanoparticles formed a stable crystalline shape while also firmly composited to the surface of CsxWO3 nanoparticles.
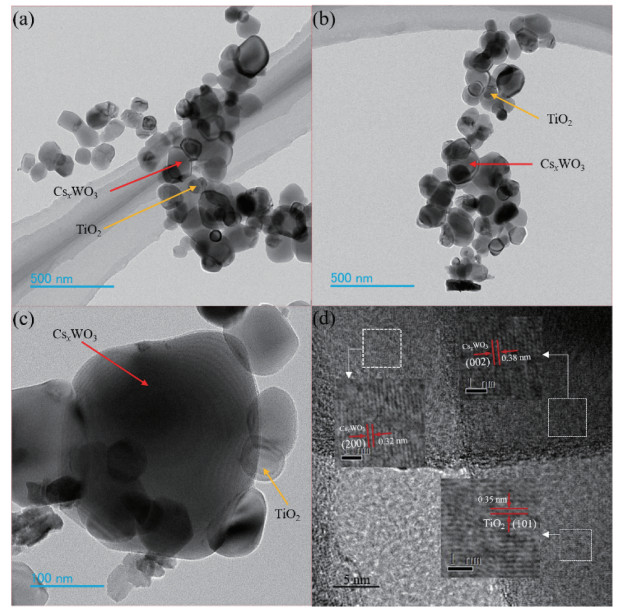
To further investigate the microstructure of the synthesized 40% CsxWO3/TiO2 nanoparticles. TEM analyses were carried out, the results are shown in Fig. 4.
Inset: corresponding lattice streaks.
As shown in Fig. 4a‐4c, the polyhedral structure of CsxWO3 nanoparticles was combined with spherical TiO2 nanoparticles on the surface. It was consistent with the performance of the SEM images. The successful formation of CsxWO3/TiO2 heterojunction was further confirmed. In Fig. 4d, the lattice streaks between the arrows above the nanoparticles correspond to the face‐to‐face spacing of the (002) and (200) crystal faces of CsxWO3. The spacing was 0.38 and 0.32 nm, respectively. The lattice striations between the arrows below the nanoparticles are consistent with the facet spacing of the (101) crystal face of TiO2. The spacing was 0.35 nm. It can be seen that the bonding between CsxWO3 and TiO2 was relatively uniform and tight.
Fig. 5a and 5b show the UV‐Vis DRS and band gaps (Eg), respectively. As shown in Fig. 5a, the single CsxWO3 had a wide absorption width. It is photo‑ responsive in the UV‐Vis as well as in the NIR. The single TiO2 could only absorb UV light below 400 nm. The absorption edge was at 380 nm. when CsxWO3 was compounded with TiO2. The absorption peak was weakened in the 200‐400 nm UV range. But almost no effect occurred. The absorption peak was enhanced in the Vis range of 400‐790 nm. Its absorption spectrum was greatly enhanced in the Vis region. Fig. 5b shows the calculated band gap of the samples. The band gap of each sample was calculated based on the tangent. The Eg values of CsxWO3, TiO2, and 40% CsxWO3/TiO2 nanocomposites were 2.75, 3.34, and 2.65 eV, respectively. The band gap of the composites was reduced compared to the single CsxWO3 with TiO2. Fig. 5c and 5d show the valence band XPS (VB‐XPS) analysis of CsxWO3 and 40% CsxWO3/TiO2. As can be seen from the figures, the EVB (VB energy of valence band) of CsxWO3 and 40% CsxWO3/TiO2 were 2.50 and 2.65 eV, respectively[31]. Fig. 5e shows the UV‐Vis‐NIR DRS. The absorption peaks of the 30% to 50% binary complexes in the NIR optical range increased with the increase of the content of CsxWO3. This is because the moderate introduction of TiO2 enhances the localized surface plasmon resonance and small polariton jump effect of CsxWO3. When the content of CsxWO3 was 55% or above. The absorption peaks of the binary complexes in the NIR optical range started to decrease gradually. This is due to the agglomeration of CsxWO3 nanoparticles as the content of CsxWO3 increased. The CsxWO3/TiO2 heterojunction structure is disrupted. It can be seen that the moderate introduction of TiO2 reduces the band gap and broadens the photo‐response range compared to a single material. It also improves the reduction of e- and oxidation of h+.

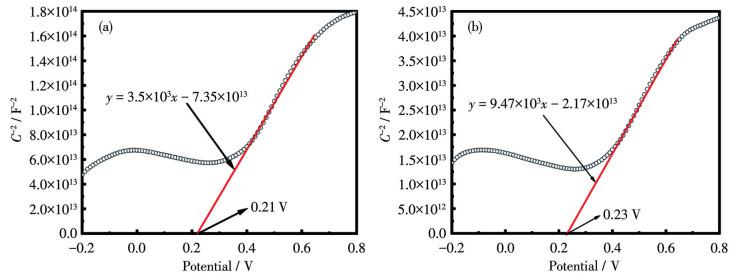
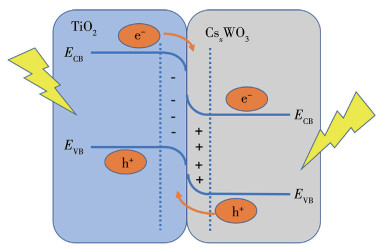
As shown in Fig. 6a (the test frequency was 10 000 Hz), the Mott‐Schottky curve of CsxWO3 was positive, which shows that it is an n‐type semiconductor. The flat band potential of CsxWO3 was 0.21 V. It is known that the VB energy (EVB) and flat band energy of TiO2 are 1.68 and -1.92 eV, respectively[32]. As known from the above, the VB energy and conduction band energy (ECB) of CsxWO3 were 2.50 and -0.25 eV, respectively, and the VB and CB energies of TiO2 were 1.68 and -1.92 eV, respectively. Compared to CsxWO3, TiO2 had a higher CB potential. As shown in Fig. 7, the electrons were transported from TiO2 to CsxWO3, which enhances the CsxWO3 catalytic ability. This was consistent with the findings in Fig. 2.
The specific surface areas and pore size distributions of the materials were analyzed, and the results are shown in Fig. 8.
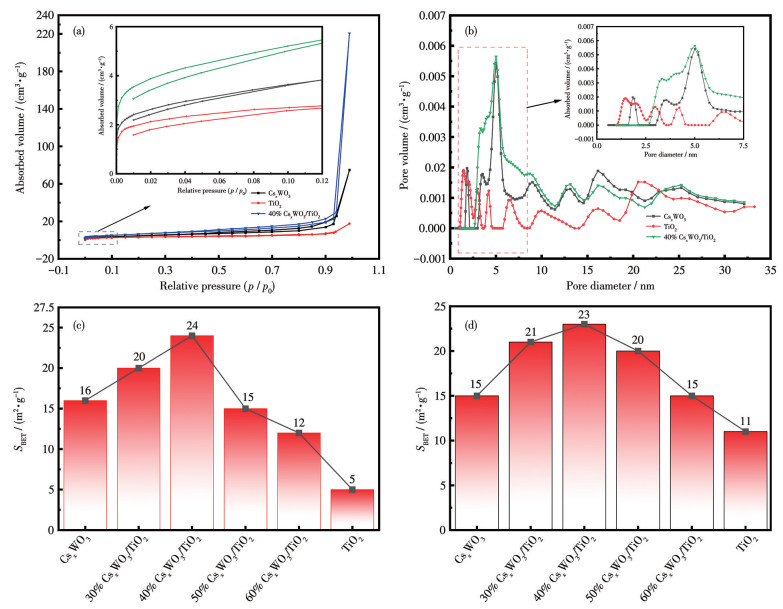
Inset: corresponding enlarged isotherms (a) and curves (b).
Fig. 8a and 8b show the N2 adsorption‐desorption isotherms and pore size distributions of some of the materials and their complexes tested at 77 K. It can be seen that the adsorption isotherms of CsxWO3, TiO2, and their complexes belong to the type Ⅳ line type in the IUPAC classification. For all the samples, when p/p0 was about 1, the adsorption of N2 was small relative to pressure at low pressure, the desorption curve lagged at medium pressure, and the adsorption was small at high pressure. And the pore size distribution in Fig. 8b was mainly in 0‐35 nm and 2‐35 nm. This indicates that a small portion of micropores (< 2 nm), as well as most mesopores (2‐50 nm), mainly exist in CsxWO3, TiO2, and their composites. The inset of Fig. 8b demonstrates the pore size distribution of each material in the range of 0‐7.5 nm. Among them, the microporous distribution of single materials was richer than that of composites. 40% CsxWO3/TiO2 had almost no micropores, which might be attributed to the fact that some small‐sized TiO2 particles fill the micropores of the composites. Fig. 8c and 8d show the specific surface area analysis in Barret‐Joyner‐Halenda (BJH) and density function theory (DFT) modes, respectively. As can be seen from the figures, the CsxWO3/TiO2 composite differed from carbon materials such as graphene. It does not have a relatively large specific surface area and therefore does not have extremely strong dark adsorption properties. The specific surface area in the figure showed a trend of increasing, then decreasing. This was consistent with the performance of the dark adsorption trend in the subsequent photocatalytic process.
The dark adsorption curves of CsxWO3, TiO2, and their composites on MB are shown in Fig. 9a. The dark adsorption of CsxWO3 was 22.9%. The adsorption of TiO2 on MB was almost 0 (0.4%). The adsorption effects of the composites were all between 20% and 30%. The enlarged portion of Fig. 9a shows dark adsorption plots of individual materials for 50 to 60 min. The adsorption effect showed a trend of increasing and then decreasing, and was consistent with the specific surface area of the composites. The highest adsorption effect of 27% was achieved when the loading of CsxWO3 was 40%. After 30 min of dark adsorption, the concentration of the MB solution was almost unchanged. It can be inferred that the MB solution reached the dark reaction adsorption equilibrium state. The composites showed the highest photocatalytic degradation activity when the CsxWO3 content was 40%. Fig. 9b shows the degradation profile of single and its composites for photocatalytic degradation of MB under mercury lamp (simulated UV). The degradation rate of MB reached 94.6% at 30 min. The solution degradation was complete at 40 min. Fig. 9c shows the degradation curve of MB photodegraded by a single and its composites under a xenon lamp (simulated Vis). The MB solution reached 91.4% degradation at 120 min. Fig. 9d shows the degradation curves of MB photodegraded by a single and its composites under the infrared (IR) lamp (simulated NIR). Since the time was on the long side, we added a set of blank controls (without any catalysts, other conditions were the same). From the blank control group, it can be seen that there was almost no degradation of the MB dye under the condition of no catalyst. The influence of factors such as the long time for this experiment was excluded. The degradation rate of the MB solution under NIR light reached 70.7% at 6 h. The results showed that the photocatalytic activities of the composites were all superior to those of single CsxWO3 and TiO2. Combined analytical (TEM, SEM, XRD, XPS) analyses show that the heterostructures were formed by solvothermal reaction between CsxWO3 and TiO2. Combined with Fig. 7, it could be seen that the electrons on TiO2 were transferred to the surface of CsxWO3. It enhances the carrier concentration on the surface of CsxWO3 and reduces the probability of photocomposite e-‐h+ generation. When the content of CsxWO3 was low, the carrier concentration formed by it was insufficient. It is difficult to effectively avoid the rapid compounding of e- and h+. When the content of CsxWO3 was high, the particles were attracted to each other to form agglomerates during the solvent‐thermal reaction. The heterogeneous structure was destroyed, leading to a decrease in photocatalytic activity.
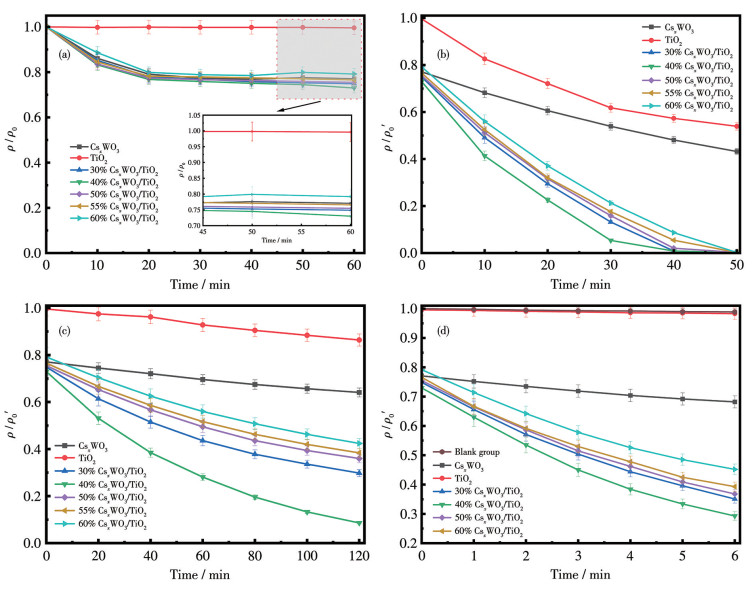
Fig. 10a and 10b show the pseudo‐primary kinetic models fitted for the photocatalytic degradation of MB dye by CsxWO3, TiO2, and their composites under simulated Vis and NIR light, respectively. The fitting process started at the photocatalytic reaction′s beginning (after the dark reaction′s end). The curves showed a linear relationship. The values of k under the Vis light (Fig. 10a) were 0.001 5 min-1 (CsxWO3), 0.001 2 min-1 (TiO2), 0.007 6 min-1 (30% CsxWO3/TiO2), 0.018 min-1 (40% CsxWO3/TiO2), 0.006 2 min-1 (50% CsxWO3/TiO2), 0.005 8 min-1 (55% CsxWO3/TiO2), and 0.005 2 min-1 (60% CsxWO3/TiO2). The values of k under NIR light (Fig. 10b) were 0.021 h-1 (CsxWO3), 0.002 2 h-1 (TiO2), 0.13 h-1 (30% CsxWO3/TiO2), 0.16 h-1 (40% CsxWO3/TiO2), 0.12 h-1 (50% CsxWO3/TiO2), 0.11 h-1 (55% CsxWO3/TiO2), and 0.094 h-1 (60% CsxWO3/TiO2). The trend of rate degradation constants was consistent with the results in Fig. 9.
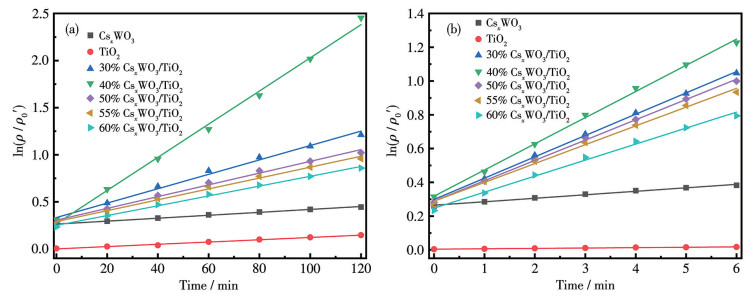
Fig. 11 shows the photocatalytic analysis of 40% CsxWO3/TiO2 under ionic interference, which included photocatalytic degradation plots under UV, Vis, and NIR light. NaCl and Na2CO3, which were commonly used in the dyeing process, were used as interfering ions. As can be seen from the graphs, the addition of NaCl and Na2CO3 decreased the photocatalytic rate under UV light. However, it still reached 99.7%. The photocatalytic degradation rate under Vis and NIR light was decreased, but still had an excellent photocatalytic degradation rate (Vis: 91.4% for the blank group, 85.2% for NaCl, and 83.7% for Na2CO3. NIR: 70.7% for the blank group, 67.1% for NaCl, 65.8% for Na2CO3). It can be seen that the photocatalyst can still maintain a high catalytic activity under the interference of some ions.
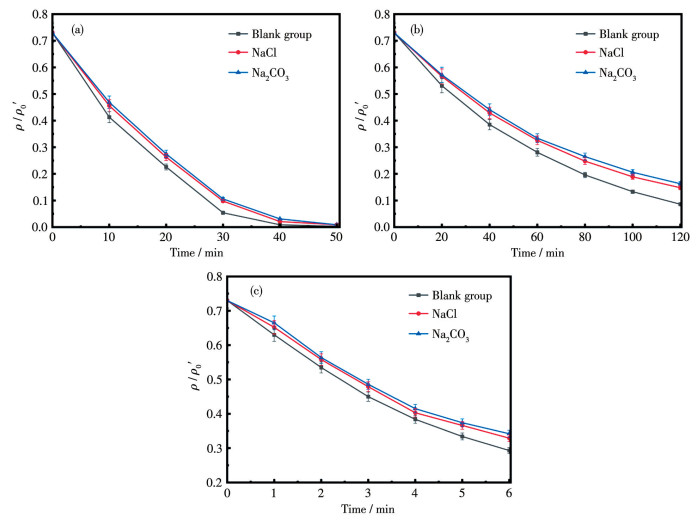
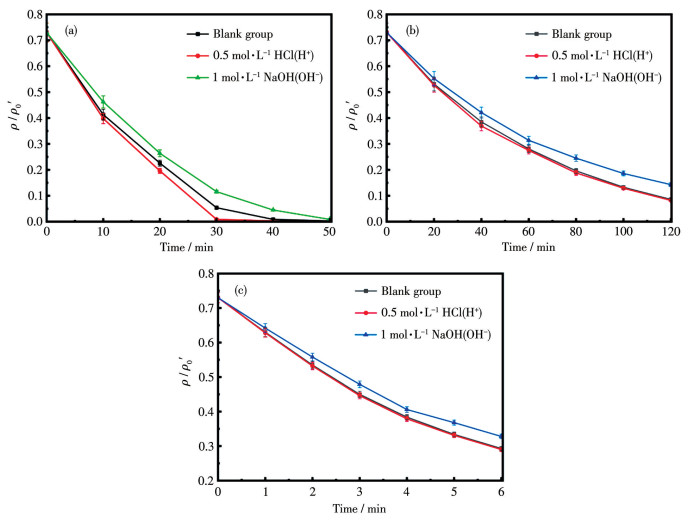
Fig. 12 shows the photocatalytic analysis of 40% CsxWO3/TiO2 under the influence of different pH levels. Acidic conditions (cationic interference) were simulated by adjusting the pH to 4 with 0.5 mol·L-1 HCl. Alkaline conditions (anionic interference) were simulated by adjusting the pH to 10 with 1 mol·L-1 NaOH. Fig. 12a‐12c shows the photocatalytic effect in UV, Vis, and NIR, respectively. From the plots, it can be seen that the photocatalytic effect increased under acidic conditions. Under alkaline conditions, the photocatalytic effect decreased, but it still had high activity. It can be seen that the photocatalyst can still maintain high catalytic activity under the interference of anions and cations. It illustrates the wide application of photocatalysts.
The stability of the catalyst plays an important role in the photodegradation process. The 40% CsxWO3/TiO2 composite was selected for five repetitions of degradation of MB under Vis light. As shown in Fig. 13, the photocatalytic performance of the composite did not significantly decrease after five cycles (87.6%). It indicates that the prepared photocatalyst have excellent photocatalytic activity and stability.
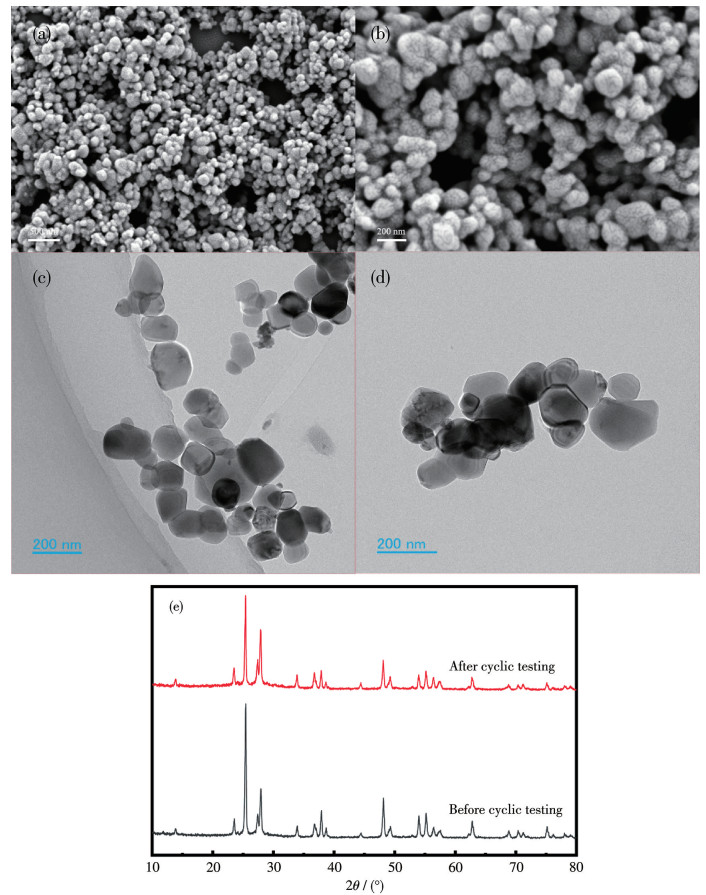
The SEM and TEM images, XRD patterns of 40% CsxWO3/TiO2 after the results of cyclic testing experiments are shown in Fig. 14. It can be seen from the figure that there was almost no change in the samples after cyclic testing experiments. It shows the high stability of the composites.
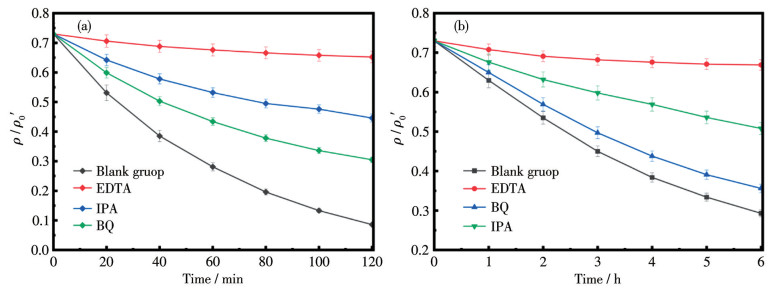
Many active species were produced during the photocatalytic degradation of dyes. These included e-, h+, hydroxyl radicals (·OH), and superoxide radicals (·O2-). These species play different roles in different photocatalytic systems. The role of active species in the photocatalytic process is inferred to explore the photocatalytic mechanism by capturing experiments. In the capture experiments, isopropanol (IPA) acted as a trapping agent for ·OH. Benzoquinone (BQ) was used as a trapping agent for ·O2-. Ethylenediaminetetraacetic acid (EDTA) was used as a trapping agent for h+. The results of the trapping experiments on 40% CsxWO3/TiO2 samples under Vis and NIR light are shown in Fig. 15a and 15b. The results show that under Vis light, the degradation rate of MB decreased from 91.4% to 69.5% with the addition of BQ, 55.4% with the addition of IPA, and 34.8% with the addition of EDTA rapidly. Under NIR light, the degradation rate of MB decreased from 70.7% to 64.4% upon adding BQ, to 49.2% with IPA added, and to 66.9% with EDTA added. Based on these results, it is inferred that the main active species are h+ and ·OH, while ·O2- plays a lesser role. The effect of ·OH under NIR light was lower than that of Vis light. It is due to the lower energy of NIR light, which reduces the conversion of ·OH.
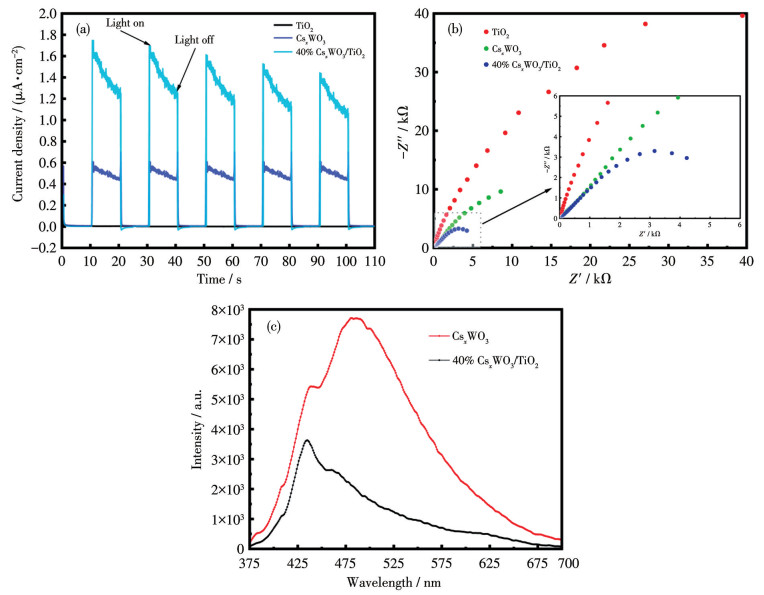
From Fig. 16a, it can be seen that the transient photocurrent of 40% CsxWO3/TiO2 was much larger than that of CsxWO3 and TiO2. This also indicates that the composites produce more carriers under the light. The heterojunction structure formed by CsxWO3 and TiO2 enhances the photogenerated carriers′ separation. The inset in Fig. 16b shows an enlarged view of the 0‐6 kΩ section. It is also evident from the electrochemical impedance distribution (Fig. 16b) that the arc radius (impedance) of the composites was much smaller than that of the single CsxWO3 containing TiO2. It can be seen that the composites had a much higher electron transfer efficiency in the photocatalytic process. This was consistent with the results of the transient photocurrent test. Fig. 16c shows the photoluminescence (PL) spectra of CsxWO3 and 40% CsxWO3/TiO2 composites. As shown, the 40% CsxWO3/TiO2 composite had the lowest PL intensity under the same conditions of light excitation, indicating that it has the lowest e-‐h+ complexation probability. This result was in complete agreement with the photoelectric efficiency analysis described above, further indicating that the 40% CsxWO3/TiO2 composite can accelerate the separation of photogenerated e-‐h+ pairs.
Inset: 0‐6 kΩ impedance amplification curves.
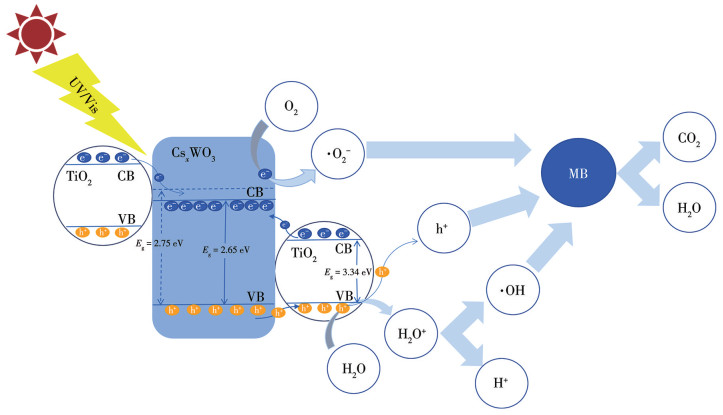
From the above analytical results, the photocatalytic mechanism of CsxWO3/TiO2 composites under UV and Vis light was proposed as shown below in Fig. 17. CsxWO3 was excited under UV/Vis light irradiation. Photogenerated h+ were generated in the VB, and e- were generated in the CB. e- in the CB on TiO2 could be transferred to the CB on CsxWO3. e- on CsxWO3 combined with O2 to form ·O2-. At the same time, h+ in the VB of CsxWO3 could be transferred to the VB of TiO2. H2O would combine with the h+ in the VB on TiO2 to form H2O+. After that, H2O+ decomposed to form ·OH and H+. These free radicals as well as h+ will degrade the dye (MB) to CO2 and H2O.
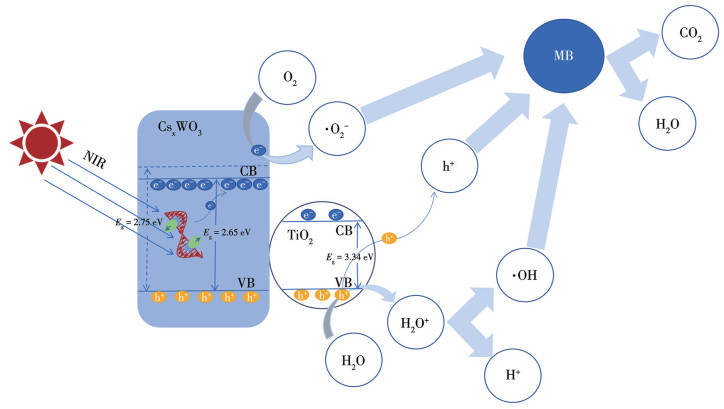
The photocatalytic mechanism of CsxWO3/TiO2 composites under NIR light is shown in Fig. 18 below. NIR light irradiates the CsxWO3 surface and generates the LSPR effect. The large number of carriers in the CsxWO3/TiO2 composite generates a collective electromagnetic oscillatory behavior accompanied by the excitation of hot e-‐h+ pairs. These hot e- are excited to high‐energy LSPR states with corresponding h+ on OS1 (occupied state 1) or OS2 (occupied state 2). The vicinity of the bottom of the CsxWO3 CB possesses an abundant impurity energy level for W5+. Therefore, the hot e- in the LSPR state preferentially jumps to the CB of the lower energy surface state CsxWO3 after relaxation. The h+ then remains in TiO2. The effective separation of photogenerated e- and h+ is realized. O2 dissolves in the solution combined with e- in the CB of CsxWO3 to form ·O2-. At the same time, the cavities located in TiO2 combine with H2O to form H2O+. After that, H2O+ decomposes to form ·OH and H+. Eventually, these ·O2-, ·OH, and h+ catalytically produced by CsxWO3/TiO2 composites under NIR excitation are involved in the degradation reactions, such as MB. The dye (MB) is degraded into CO2 and H2O.
Eq.1‐6 reveal the mechanism of photocatalytic degradation of dyes by CsxWO3/TiO2 composites.
|
|
(1) |
|
|
(2) |
|
|
(3) |
|
|
(4) |
|
|
(5) |
|
|
(6) |
In summary, full‐spectrum responsive CsxWO3/TiO2 composite photocatalysts were prepared by the solvothermal method. TEM, SEM, XRD, and XPS results show that the CsxWO3 nanoparticles were tightly bonded with TiO2 particles to form a heterogeneous structure. DRS results indicate that the optimal amount of CsxWO3 in the CsxWO3/TiO2 composite photocatalysts was 40%. The composite photocatalyst had a small band gap (2.65 eV) and a low complexation efficiency of photoinduced carriers. Additionally, the transient photocurrent and electrochemical impedance analysed a higher electron transfer efficiency of 40% CsxWO3/TiO2. The photocatalytic effect of the composite photocatalysts was significantly improved compared with that of the single material under the irradiation of UV, Vis, or NIR light sources. After five cycles of treatment, the 40% CsxWO3/TiO2 nanocomposites exhibited high and stable photocatalytic activity. In addition, the method has the advantage of a simple process. It provides a reference value for the design of efficient and stable full‐spectrum photocatalyst materials as well as practical production.
WU Z, ZHU Z Q, MA J P, ZHOU M, WU Z S, YOU H L, ZHANG H F, LI N J, WANG F. High piezo‐photocatalysis of BaTiO3 nanofibers for organic dye decomposition[J]. Surf. Interfaces, 2024, 48: 104308. doi: 10.1016/j.surfin.2024.104308
FATIMA R, AFRIDI M N, KUMAR V, LEE J, ALI I, KIM K H, KIM J O. Photocatalytic degradation performance of various types of modified TiO2 against nitrophenols in aqueous systems[J]. J. Clean Prod., 2019, 231: 899-912. doi: 10.1016/j.jclepro.2019.05.292
MAYER B K, DAUGHERTY E, ABBASZADEGAN M. Disinfection byproduct formation resulting from settled filtered and finished water treated by titanium dioxide photocatalysis[J]. Chemosphere, 2014, 117: 72-78. doi: 10.1016/j.chemosphere.2014.05.073
ZHAO L, CHEN X F, WANG X C, ZHANG Y J, WEI W, SUN Y H, ANTONIETTI M, TITIRICI M M. One‐step solvothermal synthesis of a carbon@TiO2 dyade structure effectively promoting visible‐light photocatalysis[J]. Adv. Mater., 2010, 22(30): 3317-3321. doi: 10.1002/adma.201000660
SMAZNA D, SHREE S, POLONSKYI O, LAMAKA S, BAUM M, ZHELUDKEVICH M, FAUPEL F, ADELUNG R, MISHRA Y K. Mutual interplay of ZnO micro‐and nanowires and methylene blue during cyclic photocatalysis process[J]. J. Environ. Chem. Eng., 2019, 7(2): 103016. doi: 10.1016/j.jece.2019.103016
PENFOLD T, SZLACHETKO J, GAWELDA W, SANTOMAURO F, BRITZ A, VAN DRIEL T, SALA L, EBNER S, SOUTHWORTH S, DOUMY G, MARCH A M, LEHMANN S, KATAYAMA T, MUCKE M, IABLONSKYI D, KUMAGAI Y, KNOPP G, MOTOMURA K, TOGASHI T, OWADA S, YABASHI M, RITTMANN J, NIELSEN M, PAJEK M, UEDA K, CHERGUI M, ABELA R, MILNE C J. Revealing hole trapping in zinc oxide nanoparticles by time‐resolved X‐ray spectroscopy[J]. Abstr. Pap. Am. Chem. Soc., 2018, 9: 478.
SUN L, YANG M J, HUANG J F, YU D S, HONG W, CHEN X D. Freestanding graphitic carbon nitride photonic crystals for enhanced photocatalysis[J]. Adv. Funct. Mater., 2016, 26(27): 4943-4950. doi: 10.1002/adfm.201600894
SUN L, HONG W, LIU J, YANG M J, LIN W S, CHEN G J, YU D S, CHEN X D. Cross‐linked graphitic carbon nitride with photonic crystal structure for efficient visible‐light‐driven photocatalysis[J]. ACS Appl. Mater. Interfaces, 2017, 9(51): 44503-44511. doi: 10.1021/acsami.7b14359
LINGHU X, SHU Y, LIU L A, ZHAO Y, ZHANG J W, CHEN Z, SHAN D, WANG B Q. Hydro/solvothermally synthesized bismuth tungstate nanocatalysts for enhanced photocatalytic degradation of dyes, antibiotics, and bacteria in wastewater: A review[J]. J. Water Process. Eng., 2023, 54: 103994. doi: 10.1016/j.jwpe.2023.103994
ORIMOLADE B O, IDRIS A O, FELENI U, MAMBA B. Recent advances in degradation of pharmaceuticals using Bi2WO6 mediated photocatalysis‒A comprehensive review[J]. Environ. Pollut., 2021, 289: 117891. doi: 10.1016/j.envpol.2021.117891
WANG F F, WANG H J, LIU X Y, WU D P, JIANG K, LI Q, XU D S. Full‐spectrum liquid‐junction quantum dot‐sensitized solar cells by integrating surface plasmon‐enhanced electrocatalysis[J]. Adv. Energy Mater., 2018, 8(20): 1800136. doi: 10.1002/aenm.201800136
WANG S L, ZHU Y, LUO X, HUANG Y, CHAI J W, WONG T I, XU G Q. 2D WC/WO3 heterogeneous hybrid for photocatalytic decomposition of organic compounds with Vis‐NIR light[J]. Adv. Funct. Mater., 2018, 28(11): 1705357. doi: 10.1002/adfm.201705357
HUANG M Z, YUAN B L, DAI L Y, FU M L. Toward NIR driven photocatalyst: Fabrication, characterization, and photocatalytic activity of β‐NaYF4: Yb3+, Tm3+/g‐C3N4 nanocomposite[J]. J. Colloid Interface Sci., 2015, 460: 264-272. doi: 10.1016/j.jcis.2015.08.063
ELBANNA O, ZHU M S, FUJITSUKA M, MAJIMA T. Black phosphorus sensitized TiO2 mesocrystal photocatalyst for hydrogen evolution with visible and near‐infrared light irradiation[J]. ACS Catal., 2019, 9(4): 3618-3626. doi: 10.1021/acscatal.8b05081
SHI X, WANG P Q, WANG L, BAI Y, XIE H Q, ZHOU Y, WANG J A, LI Z J, QU L B, SHI M J, YE L Q. Few layered BiOBr with expanded interlayer spacing and oxygen vacancies for efficient decomposition of real oil field produced wastewater[J]. ACS Sustain. Chem. Eng., 2018, 6(11): 13739-13746. doi: 10.1021/acssuschemeng.8b01622
TERAMURA K, IGUCHI S, MIZUNO Y, SHISHIDO T, TANAKA T. Photocatalytic conversion of CO2 in water over layered double hydroxides[J]. Angew. Chem.‒Int. Edit., 2012, 51(32): 8008-8011. doi: 10.1002/anie.201201847
PRABHU P, JOSE V, LEE J M. Heterostructured catalysts for electrocatalytic and photocatalytic carbon dioxide reduction[J]. Adv. Funct. Mater., 2020, 30(24): 1910768. doi: 10.1002/adfm.201910768
LU Y F, HUANG Y, ZHANG Y F, HUANG T T, LI H W, CAO J J, HO W K. Effects of H2O2 generation over visible light‐responsive Bi/Bi2O2‐xCO3 nanosheets on their photocatalytic NOx removal performance[J]. Chem. Eng. J., 2019, 363: 374-382. doi: 10.1016/j.cej.2019.01.172
LASEK J, YU Y H, WU J C S. Removal of NOx by photocatalytic processes[J]. J. Photochem. Photobiol. C‒Photochem. Rev., 2013, 14: 29-52. doi: 10.1016/j.jphotochemrev.2012.08.002
WU X Y, YIN S, XUE D F, KOMARNENI S, SATO T. A CsxWO3/ZnO nanocomposite as a smart coating for photocatalytic environmental cleanup and heat insulation[J]. Nanoscale, 2015, 7(40): 17048-17054. doi: 10.1039/C5NR04452A
YUAN B H, ZHANG C F, LIANG Y, YANG L X, YANG H W, BAI L J, WEI D L, WANG W X, WANG Q Y, CHEN H. Defect‐induced self‐cleaning solar absorber with full‐spectrum light absorption for efficient dye wastewater purification[J]. Sol. RRL, 2021, 5(5): 2100105. doi: 10.1002/solr.202100105
LI N, GAO X Y, FAN H K, GAO Y Q, GE L. Insight into the relationship of the high photocatalytic performance and double photochromic activity of Z‐scheme CsxWO3/AgBr heterostructures under UV‐Vis‐NIR light utilization[J]. Appl. Surf. Sci., 2020, 529: 147038. doi: 10.1016/j.apsusc.2020.147038
CAO X, CHEN Z, LIN R, CHEONG W C, LIU S J, ZHANG J, PENG Q, CHEN C, HAN T, TONG X J, WANG Y, SHEN R G, ZHU W, WANG D S, LI Y D. A photochromic composite with enhanced carrier separation for the photocatalytic activation of benzylic C—H bonds in toluene[J]. Nat. Catal., 2018, 1(9): 704-710. doi: 10.1038/s41929-018-0128-z
LI Y, WU X Y, LI J, WANG K, ZHANG G K. Z‐scheme g‐C3N4@ CsxWO3 heterostructure as smart window coating for UV isolating, Vis penetrating, NIR shielding and full spectrum photocatalytic decomposing VOCs[J]. Appl. Catal. B‒Environ., 2018, 229: 218-226. doi: 10.1016/j.apcatb.2018.02.024
LI T C, LIU J X, SHI F, SONG X Y, ZHANG H Y, ZHANG H J, MA C C, ZHU K Y, LIU J Y. Construction of a novel highly porous BiOBr/CsxWO3@SiO2 composite aerogel: Adsorption/self‐heating photocatalytic synergistic degradation of antibiotics and mechanism study[J]. J. Environ. Chem. Eng., 2022, 10(3): 107785. doi: 10.1016/j.jece.2022.107785
YE N F, WANG J J, YAN X H, SHA D W, CHEN M, ZHOU C, WANG D F, YUAN X X, CHENG X N, ZU J X. Novel CsxWO3/TiO2 microspheres as enhanced visible light photocatalysts for dye pollutant treatments[J]. J. Nanosci. Nanotechnol., 2018, 18(8): 5485-5492. doi: 10.1166/jnn.2018.15438
HUANG X, DU R, REN J Y, LI X, FU M X, FU S J, MA T X, GUO L, SOOMRO R A, YANG C M, WANG D J. Unveiling the mechanism of aerobic photocatalytic nitrogen fixation over dynamic structural renovation on Bi2MO6 (M=Mo, W)[J]. ACS Catal., 2024, 14(18): 13542-13549. doi: 10.1021/acscatal.4c03183
MAN H L, WANG C, SUN Y, NING Y P, SONG P, HUANG W S. Studies on CsxWO3/BiOCl composite as a novel visible light droven photocatalyst[J]. J. Materiomics, 2016, 2(4): 338-343. doi: 10.1016/j.jmat.2016.10.002
XING M Y, FANG W Z, NASIR M, MA Y F, ZHANG J L, ANPO M. Self‐doped Ti3+‐enhanced TiO2 nanoparticles with a high‐performance photocatalysis[J]. J. Catal., 2013, 297: 236-243. doi: 10.1016/j.jcat.2012.10.014
SHI F, LIU J X, DONG X L, XU Q, LUO J Y, MA H C. Hydrothermal synthesis of CsxWO3 and the effects of N2 annealing on its microstructure and heat shielding properties[J]. J. Mater. Sci. Technol., 2014, 30(4): 342-346. doi: 10.1016/j.jmst.2013.08.018
MA T X, LI R Q, HUANG Y C, LU Y X, GUO L, NIU M M, HUANG X, SOOMRO R A, REN J Y, WANG Q, XU B, YANG C M, FU F, WANG D J. Interfacial chemical‐bonded MoS2/In‐Bi2MoO6 heterostructure for enhanced photocatalytic nitrogen‐to‐ammonia conversion[J]. ACS Catal., 2024, 14(8): 6292-6304. doi: 10.1021/acscatal.3c05416
LI R Q, BIAN Y J, YANG C M, GUO L, MA T X, WANG C T, FU F, WANG D J. Electronic structure regulation and built‐in electric field synergistically strengthen photocatalytic nitrogen fixation performance on Ti‐BiOBr/TiO2 heterostructure[J]. Rare Metals, 2024, 43(3): 1125-1138. doi: 10.1007/s12598-023-02471-1

Figure 1 XRD patterns of (a) 40% CsxWO3/TiO2 and (b) a series of CsxWO3/TiO2 composites

Figure 3 (a‐c) SEM images, (d‐g) EDS element mappings, and (h) EDS spectrum of 40% CsxWO3/TiO2
Inset: atomic fractions of the elements in 40% CsxWO3/TiO2.

Figure 4 (a‐c) TEM images and (d) HRTEM images of 40% CsxWO3/TiO2
Inset: corresponding lattice streaks.

Figure 5 (a) UV‐Vis DRS and (b) band gaps of CsxWO3, TiO2, and 40% CsxWO3/TiO2; VB‐XPS spectra of (c) CsxWO3 and (d) 40% CsxWO3/TiO2; (e) UV‐Vis‐NIR DRS of CsxWO3 and CsxWO3/TiO2 composites

Figure 8 (a) N2 adsorption‐desorption isotherms, (b) pore size distribution curves, (c) specific surface areas in BJH, and (d) DFT modes of different samples
Inset: corresponding enlarged isotherms (a) and curves (b).

Figure 9 (a) Dark adsorption curves and photocatalytic degradation under (b) UV, (c) Vis, and (d) NIR of MB by different samples

Figure 10 First‐order kinetic modeling of photocatalytic degradation of MB dye by different samples under (a) Vis and (b) NIR

Figure 11 Photocatalysis of 40% CsxWO3/TiO2 under ionic interference under (a) UV, (b) Vis, and (c) NIR

Figure 12 Photocatalytic test of 40% CsxWO3/TiO2 under the influence of different pH values under (a) UV, (b) Vis, and (c) NIR

Figure 14 (a, b) SEM images, (c, d) TEM images, and (e) XRD patterns of 40% CsxWO3/TiO2 after cyclic testing

Figure 15 Effect of different capture agents on the degradation rate of 40% CsxWO3/TiO2 composites against MB under (a) Vis and (b) NIR

Figure 16 (a) Transient photocurrent response curves, (b) EIS, and (c) PL spectra of different samples
Inset: 0‐6 kΩ impedance amplification curves.

 扫一扫看文章

扫一扫关注我们
 下载:
下载:

 下载:
下载:


 下载:
下载: