Table 1.
IR and Raman spectra of the complexes and ligands
Citation:
Dan-Dan DU, Ya-Fan HAO, Xin-Xin WANG, Jin-Jin ZHAO, Ning REN, Jian-Jun ZHANG. Crystal structure, spectra, and thermal behavior of lanthanide complexes with 2-chloro-4-fluorobenzoic acid and 5,5'-dimethyl-2,2'-bipyridine[J]. Chinese Journal of Inorganic Chemistry,
2023, 39(9): 1807-1816.
doi:
10.11862/CJIC.2023.138

2-氯-4-氟苯甲酸与5,5'-二甲基-2,2'-联吡啶镧系配合物的晶体结构、光谱和热行为
摘要:
合成并表征了2个双核配合物[Pr(2-Cl-4-FBA)3(5,5'-DM-2,2'-bipy)]2(1)和[Dy(2-Cl-4-FBA)3(5,5'-DM-2,2'-bipy)]2·2(2-Cl-4-FHBA)(2),其中2-Cl-4-FHBA=2-氯-4-氟苯甲酸,5,5'-DM-2,2'-bipy=5,5'-二甲基-2,2'-联吡啶。配合物1以八配位的Pr3+为中心,其周围的配位环境为扭曲的三角十二面体。配合物2的结构是独特的,它包含2个自由的2-氯-4-氟苯甲酸分子,并以九配位的Dy3+为中心与周围的氮、氧原子形成扭曲的三棱镜几何构型。这2个配合物均结晶于三斜晶系P1空间群,并通过氢键相互作用和π-π堆积作用形成了一维和二维超分子结构。研究了配合物的热分解过程,结果表明配合物1和2分别分为4步和5步进行分解。同时对配合物的三维红外堆积图进行了研究,结果表明,整个热分解过程中释放出的主要气态产物是水、二氧化碳和有机小分子碎片。配合物2的荧光性质研究表明,它可以发射出Dy3+的特征跃迁对应的荧光。
English
Crystal structure, spectra, and thermal behavior of lanthanide complexes with 2-chloro-4-fluorobenzoic acid and 5,5'-dimethyl-2,2'-bipyridine
Abstract:
Two binuclear complexes[Pr(2-Cl-4-FBA)3(5,5'-DM-2,2'-bipy)]2 (1) and[Dy(2-Cl-4-FBA)3(5,5'-DM-2,2'-bipy)]2·2(2-Cl-4-FHBA) (2), where 2-Cl-4-FHBA=2-chloro-4-fluorobenzoic acid and 5,5'-DM-2,2'-bipy=5,5'-dimethyl-2,2'-bipyridine, have been fabricated and characterized. The two complexes crystallize in the P1 space group of the triclinic crystal system, featuring 1D and 2D supramolecular structures. The structure of complex 2 is fascinating, containing two free 2-Cl-4-FHBA molecules, which are rare in lanthanide complexes. A three-dimensional infrared stacking diagram of the gas phase products indicates that the main gaseous products released over the whole decomposition process are water, carbon dioxide, some gaseous molecules, and the gaseous organic fragments. Also, the fluorescence property of complex 2 has been studied.
-
Key words:
- crystal structure
- / lanthanide complex
- / thermochemical property
- / spectroscopy
-
Lanthanide elements not only have a unique 4f electronic layer structure and attractive structure but also have potential applications in magnetism, catalysis[1-3], sensing materials[4-6], and luminescent materials[7-9]. Currently, lanthanide complexes of various structural motifs of 1D, 2D, and 3D have been synthesized. Unfortunately, due to the spin-blocking transitions of the f-f transition, the excitation efficiency of lanthanide ion (Ln3+) is reduced[10]. Moreover, the most common coordination numbers of lanthanide complexes are eight and nine, and the geometric coordination configurations are diverse. Therefore, the factors required to control the synthesis of structurally desirable lanthanide complexes remain a great challenge[11-12]. Fortunately, the common way to avoid the above defects is to select organic ligands with strong absorption ability, and then the absorbed energy is transferred from the ligand to lanthanide ions through a non-radiative process[13-15]. In addition, it is commonly admitted that lanthanides have a strong affinity for oxygen atoms. Therefore, oxygen-containing organic ligands can be used for the synthesis of lanthanide complexes[16-17]. Carboxylic acid ligands are the most widely used ligands, acting as "antennas"[18] and having flexible coordination modes and strong coordination ability. The lanthanide complexes constructed by them have become the focus of current coordination chemistry research.
In this work, two new lanthanide complexes [Pr(2-Cl-4-FBA)3(5, 5′-DM-2, 2′-bipy)]2 (1) and [Dy(2-Cl-4-FBA)3(5, 5′-DM-2, 2′-bipy)]2·2(2-Cl-4-FHBA) (2), where 2-Cl-4-FHBA=2-chloro-4-fluorobenzoic acid and 5, 5′-DM-2, 2′-bipy=5, 5′-dimethyl-2, 2′-bipyridine, have been prepared. The two complexes were fully characterized by single-crystal X-ray diffraction, powder X-ray diffraction (PXRD), IR spectra, Raman spectra, and elemental analysis. Moreover, thermogravimetry-differential scanning calorimetry (TG-DSC)/FTIR technology was employed to study the thermal behavior of the obtained complexes. In addition, the fluorescence property of complex 2 has been studied.
1. Experimental
1.1 Materials and general methods
The contents of carbon, hydrogen, and nitrogen were acquired on a Vario-EL Ⅲ element analyzer, while the metal content was assayed using the EDTA titration method. Raman spectra were recorded by scanning 64 times with the BRUKER VERTEX-70 FTIR-RAMAN Ⅱ instrument under an excitation power of 300 mW and liquid nitrogen cooling. The PXRD data were obtained from a Bruker D8 Advance X-ray diffraction at a working voltage of 40 kV and a working current of 40 mA in a 2θ range of 5°-45° with Cu Kα radiation (λ=0.154 18 nm) at 298 K.
TG-DTG (derivative thermogravimetry)/DSC and evolved gas analysis of the obtained lanthanide complexes were carried out using a NETASCH STA 449 F3 instrument with a Bruker TENSOR 27 Fourier transform infrared spectrometer. Also, the luminescence spectra were measured on FS5 spectrometer.
1.2 Synthesis
0.06 mmol 2-Cl-4-FHBA and 0.20 mmol 5, 5′-DM-2, 2′-bipy were dissolved in 95% ethanol. Then a NaOH solution (1 mol·L-1) was used to adjust the pH of the reaction solution to 5-6. The mixture was stirred into a solution of lanthanum (Pr/Dy) nitrate dissolved in 3.5 mL water. The solution was stirred for 7 h and allowed to stand for 12 h. The obtained mother liquor was allowed to stand for 7 d to obtain crystals.
Elemental analysis Calcd. for C66H42Cl6F6N4O12Pr2(%): C, 46.86; H, 2.50; N, 3.31; Pr, 16.66. Found(%): C, 46.70; H, 2.63; N, 3.17; Pr, 16.61. Elemental analysis Calcd. for C80H50Cl8Dy2F8N4O16(%): C, 46.11; H, 2.42; N, 2.69; Dy, 15.60. Found(%): C, 46.08; H, 2.43; N, 2.67; Dy, 15.58.
1.3 X-ray single crystal structure determination
The single crystal data of the complexes were collected on a Bruker Smart-1000 single crystal diffractometer with the emission source of Mo Kα (λ=0.071 073 nm) monochromatized by the graphite. At the same time, the obtained data were improved and refined by the SHELXS-2019/2 program. The non-hydrogen atomic coordinates were corrected by full matrix least squares. All non-hydrogen atoms were redefined using anisotropic thermal parameters.
2. Results and discussion
2.1 Infrared and Raman spectroscopy
Infrared and Raman spectroscopy were collected to detect and characterize the functional groups of ligands and complexes (Table 1). After forming the complexes, the absorption peaks of νC=O at 1 696 cm-1 (IR) and 1 653 cm-1 (Raman) in 2-Cl-4-FHBA were replaced by νas(COO-) and νs(COO-) of carboxyl groups. They occurred in the vicinity of 1 626-1 636 cm-1 (IR), 1 600-1 603 cm-1 (Raman), 1 402-1 405 cm-1 (IR), and 1 415-1 425 cm-1 (Raman), respectively. At 415-418 cm-1 (IR) and 420 cm-1 (Raman), a new Ln—O bond tensile vibration characteristic absorption band appeared in the complex. All the above changes indicated that the oxygen atoms coordinated with Ln(Ⅲ) cation. Furthermore, the νC=N peak in 5, 5′-DM-2, 2′-bipy was shifted toward higher wavenumbers in the complexes (IR: 1 483-1 484 cm-1, Raman: 1 509-1 510 cm-1). In addition, the absorption of Ln—N at 204-208 cm-1 also appeared in the Raman spectrum. These facts indicate that the nitrogen atoms coordinate with Ln(Ⅲ) cation[19]. It is speculated that new products are formed.
Table 1

 下载:
导出CSV
下载:
导出CSV
Compound νC=N δC—H νC=O νas(COO-) νs(COO-) νLn—O νLn—N IR Raman IR IR Raman IR Raman IR Raman IR Raman Raman 2-Cl-4-FHBA 1 696 1 653 5, 5′-DM-2, 2′-bipy 1 467 1 503 827, 736 1 1 484 1 510 862, 788 1 626 1 600 1 402 1 415 415 420 204 2 1 483 1 509 861, 788 1 636 1 603 1 405 1 425 418 420 208 2.2 Description of crystal structure
Table 2 lists the single crystal structure data of complexes 1 and 2. Table 3 lists the data of selected bond lengths for complexes 1 and 2. Analyzing the single crystal diffraction data in Table 2 shows that complexes 1 and 2 have completely different structures. Next, the crystal structures of complexes 1 and 2 will be discussed separately.
Table 2
Table 2. Crystal and structure refinement data for complexes 1 and 2下载:
导出CSV
Parameter 1 2 Empirical formula C66H42Cl6F6N4O12Pr2 C80H50Cl8Dy2F8N4O16 Formula weight 1 691.55 2 083.84 Temperature / K 298.15 298.15 Crystal system Triclinic Triclinic Space group P1 P1 a / nm 1.119 33(11) 1.270 20(11) b / nm 1.238 45(12) 1.297 59(12) c / nm 1.316 93(14) 1.405 71(13) α / (°) 87.837(2) 112.761(4) β / (°) 89.275(2) 96.631(2) γ / (°) 72.148 0(10) 102.695(3) Volume / nm3 1.736 4(3) 2.031 8(3) Z 1 2 Dc / (g·cm-3) 1.618 1.703 Absorption coefficient / mm-1 1.695 2.175 F(000) 836 1 026 Crystal size / mm 0.40×0.18×0.07 0.30×0.11×0.07 θ range for data collection / (°) 4.558-56.55 5.158-50.36 Limiting indices -14 ≤ h ≤ 14, -15 ≤ k ≤ 16, -17 ≤ l ≤ 10 -15 ≤ h ≤ 14, -15 ≤ k ≤ 13, -9 ≤ l ≤ 16 Reflection collected, unique 10 893, 7 996 (Rint=0.062 3) 10 328, 7 033 (Rint=0.030 5) Completeness to θ=25.02° / % 98.1 98.1 Max. and min. transmission 0.890 6 and 0.550 5 0.862 7 and 0.561 5 Data, restraint, parameter 7 996, 0, 424 7 033, 24, 530 Goodness-of-fit on F 2 1.001 0.991 Final R indices [I > 2σ(I)] R1=0.077 9, wR2=0.191 4 R1=0.038 1, wR2=0.086 2 R indices (all data) R1=0.107 4, wR2=0.216 0 R1=0.048 9, wR2=0.092 4 Largest diff. peak and hole / (e·nm-3) 1 830 and -1 640 1 830 and -910 Table 3
Table 3. Selected bond lengths (nm) for complexes 1-2下载:
导出CSV
1 Pr1—O4#1 0.230 4(7) Pr1—O3 0.236 7(7) Pr1—O1 0.236 2(6) Pr1—O2#1 0.238 2(6) Pr1—O6 0.242 4(7) Pr1—O5 0.243 2(7) Pr1—N1 0.255 6(8) Pr1—N2 0.259 9(8) 2 Dy1—O4#1 0.231 7(3) Dy1—O3 0.233 2(3) Dy1—O2#1 0.234 1(3) Dy1—O5 0.239 4(3) Dy1—O1 0.239 9(3) Dy1—O6 0.251 4(4) Dy1—N2 0.253 9(4) Dy1—N1 0.257 4(3) Dy1—O2 0.270 8(3) Symmetry codes: #1: 1-x, 1-y, 1-z for 1; #1: 1-x, -y, 1-z for 2. 2.2.1 Structure of complex 1
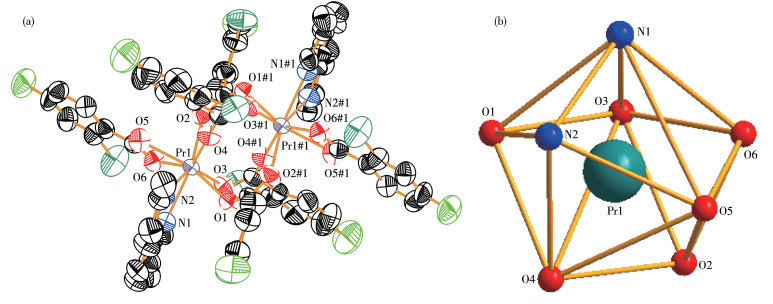
Complex 1 contains one kind of Pr3+, three 2-Cl-4-FBA ligands, and one 5, 5′-DM-2, 2′-bipy ligand (Fig. 1a). The coordination with oxygen and nitrogen atoms is carried out with eight-coordinated Pr3+ ion as the center (Fig. 1b), which belong to the 2-Cl-4-FBA ligand of the bridged and chelated di-dentate and the 5, 5′-DM-2, 2′-bipy ligand of the chelated di-dentate, respectively, shows a distorted dodecahedral coordination sphere[20]. The Pr—O distance (0.230 4-0.242 7 nm) is within the previously reported Pr—O bond length range[21]. In addition, the Pr—N distance is 0.255 6-0.259 9 nm. The average distance of Pr—O (0.237 9 nm) is significantly shorter than Pr—N (0.2578 nm), and it has been confirmed that neutral ligands are first lost during thermal decomposition[22].
Figure 1
 Figure 1. (a) ORTEP diagram of complex 1 with a 50% probability; (b) Coordination polyhedron of the Pr3+ ion in 1
Symmetry codes: #1: 1-x, 1-y, 1-z.
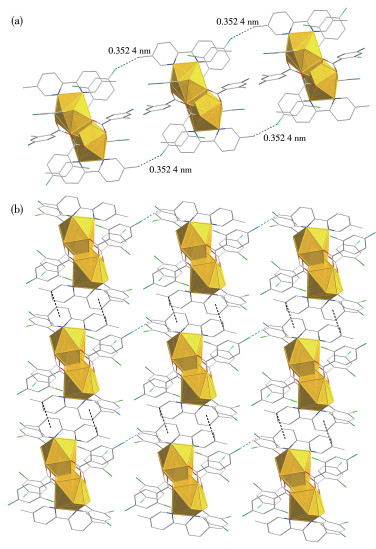
Along the a-axis, the adjacent binuclear molecules are linked by C—H…F weak hydrogen bonds (Fig. 2a) to form a 1D supramolecular in complex 1. Then, the adjacent 1D chains extend to the a- and c-axis directions through π-π stacking to form a 2D thin-section structure (Fig. 2b).
Figure 2
 Figure 2. (a) One-dimensional chain structure of complex 1 viewed along the a-axis; (b) 2D structure of 1 viewed from the a- and c-axis directions
2.2.2 Structure of complex 2
The complex consists of two Dy3+ ions, two 5, 5′-DM-2, 2′-bipy ligands, six 2-Cl-4-FBA ligands, and two free 2-Cl-4-FHBA molecules, as illustrated in Fig. 3a (To make the structure clear, two free 2-Cl-4-FHBA molecules are omitted). A twisted triple prism geometry is formed with a nine-coordinated Dy3+ as the central ion (Fig. 3b)[23]. Dy3+ ion chelates with acid and neutral ligands: they contribute nitrogen atoms (N1, N2) and oxygen atoms (O5, O6), respectively. The average bond lengths of Dy—N and Dy—O are 0.255 7 and 0.245 4 nm, respectively. Three (O1, O2, O2#1) of these are from bridging tridentate 2-Cl-4-FBA ligands with an average Dy—O length of 0.248 3 nm. The other oxygen atoms (O3, O4) come from two different bridging bidentate 2-Cl-4-FBA ligands with an average length of 0.232 5 nm.
Figure 3
 Figure 3. (a) ORTEP diagram of complex 2 with a 50% probability; (b) Coordination polyhedron of the Dy3+ion in 2
Symmetry codes: #1: 1-x, -y, 1-z.
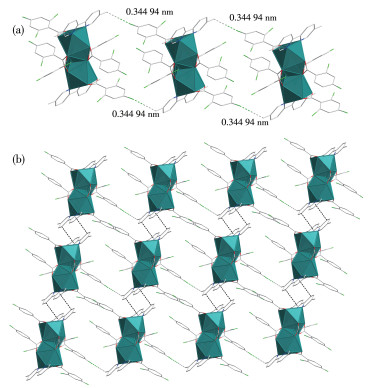
Further, along the c-axis, the adjacent binuclear molecules are linked by C—H…F weak hydrogen bonds (Fig. 4a) to form a 1D supramolecular in complex 2. Then, the adjacent 1D chains extend to the a- and c-axis directions through π-π stacking to form a 2D thin-section structure (Fig. 4b).
Figure 4
 Figure 4. (a) One-dimensional chain structure of complex 2viewed along the a-axis; (b) 2D structure of 2 viewed from the a- and b-axis directions
2.3 PXRD analysis
The ligands and complexes were subjected to PXRD to determine their purity and structure (Fig. 5). However, from the PXRD patterns of complexes 1 and 2, it is found that the position and number of peaks were different, which shows that complexes 1 and 2 have different crystal structures. The diffraction patterns simulated by the single crystal data had a good similarity with the observed results, confirming their excellent phase purity. We could also find that the complexes were not the result of the addition of raw materials, indicating that the synthesized complexes have a new phase structure.
Figure 5
2.4 Thermal analysis
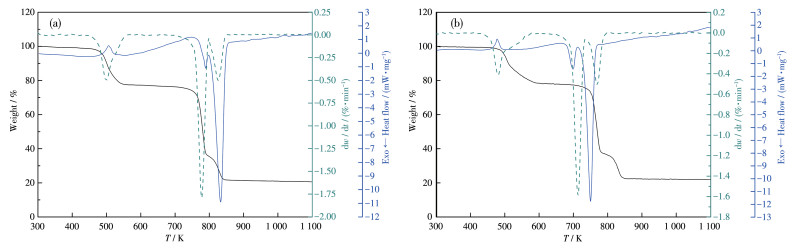
Thermal stability is an important parameter in material application. TG-DSC method was used to characterize the thermal stability of the complexes, and the results are shown in Fig. 6, respectively. The thermal behavior of the two complexes was studied. Table 4 gives the TG-DSC analysis results of the complexes[24].
Figure 6
Table 4
Table 4. Thermal analysis data of complexes 1 and 2下载:
导出CSV
Complex Step Temperature range / K Tp of DTG / K Mass loss rate / % Probably expelled groups Intermediate and residue Found Calcd. 1 Ⅰ 438.15-599.15 501.45 21.53 21.78 2(5, 5′-DM-2, 2′-bipy) [Pr2(2-Cl-4-FBA)6] Ⅱ 599.15-801.15 780.15 42.06 58.04 6(2-Cl-4-FBA) Pr6O11 Ⅲ 801.15-1 260.65 829.05 15.21 2 Ⅰ 410.15-476.15 461.15 1.91 x(2-Cl-4-FHBA) [Dy2(2-Cl-4-FBA)6(5, 5′-DM-2, 2′-bipy)2]·(2-x)(2-Cl-4-FHBA) Ⅱ 476.15-632.15 515.15 20.41 (2-x)(2-Cl-4-FHBA)+ y(5, 5′-DM-2, 2′-bipy) [Dy2(2-Cl-4-FBA)6(5, 5′-DM-2, 2′-bipy)2-y] Ⅲ 632.15-792.25 766.15 39.41 (2-y)(5, 5′-DM-2, 2′-bipy)+z(2-Cl-4-FBA) [Dy2(2-Cl-4-FBA)6-z] Ⅳ 792.15-1 260.25 822.15 17.62 (6-z)2-Cl-4-FBA Dy2O3 As shown in Fig. 6a, for complex 1, In the first stage (438.15-599.15 K), all neutral ligands were lost. The mass loss rate at this stage was 21.53% (Calcd. 21.78%). In a range of 599.15-1 260.15 K, the mass loss rate of step Ⅱ and step Ⅲ were 57.27%, which is the elimination of all 2-Cl-4-FBA ligands. One upward endothermic peak and two downward exothermic peaks were observed on the corresponding DSC curve (T1=503.55 K; H1=69.8 J·g-1; T2=786.05 K, H2=91.33 J·g-1; T2=830.45 K, H3=1534 J·g-1). Finally, complex 1 was degraded to Pr6O11, and the total mass loss was 78.80% (Calcd. 79.82%).
As shown in Fig. 6b, for complex 2, the first stage of decomposition (410.15-476.15 K) can be attributed to the loss of some free 2-Cl-4-FBA molecules. The second step occurred in a range of 476.15-632.15 K with a mass loss rate of 20.41%, belonging to the decomposition of the rest free 2-Cl-4-FHBA molecules and part of 5, 5′-DM-2, 2′-bipy molecules. The third and fourth steps occurred in the ranges of 632.15-792.25 K and 792.15-1 260.25 K, which eliminates all ligands. Finally, complex 2 was degraded to Dy2O3, and the total mass loss rate was 79.35% (Calcd. 82.10%).
2.5 Evolved gas analysis
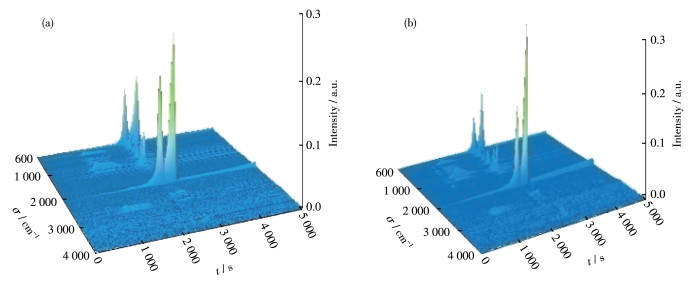
To further determine the stability of the complexes in the air and the gas products produced during thermal decomposition, the 3D infrared spectra (Fig. 7a and 7b) of complexes 1 and 2 were measured by TG-DSC/FTIR system. The 2D infrared spectra (Fig. 8a and 8b) were analyzed by FTIR.
Figure 7
 Figure 7. Three-dimensional FTIR stacking diagrams of gas escaping of complexes 1 (a) and 2 (b)
Figure 8
For complex 1, at 501.42 K, the characteristic absorption bands of H2O and CO2 can be seen in the wavenumber ranges of 3 358-3 840 cm-1 and 2 336-2 414 cm-1, and 653 cm-1. Besides, the absorption peaks νC=N (1 468 cm-1), νC—N (1 131, 1 217 cm-1), νC=C (1 551, 1 572, 1 599 cm-1), νC—H (2 880-3 012 cm-1), γ=C—H (1 060, 1 028, 863 cm-1) were observed. This matches the removal of 5, 5′-DM-2, 2′-bipy. At 771.24 K, characteristic absorption peaks of CO2 (2 330-2 358 cm-1, 648 cm-1) and H2O (3 425-3 962 cm-1) were found. And some important characteristic bands were observed: νC=O (1 758 cm-1), νC=C (1 486, 1 600 cm-1), γC—H (885 cm-1). All of these indicate that the 2-Cl-4-FBA ligands have been destroyed. At 826.59 K, the absorption peaks of CO2 (2 330-2 359, 668 cm-1) and H2O (3 604-3 901 cm-1) were detected in the infrared spectrum, indicating that the acid ligand has been completely decomposed.
For complex 2, at 416.87 K, the characteristic absorption bands of H2O and CO2 could be seen in the wavenumber ranges of 3 243-3 926 cm-1 and 2 318-2 367 cm-1, and 668 cm-1. Besides, the absorption peaks νC=O (1 775 cm-1), νC=C (1 468, 1 492, 1 602 cm-1), and γ=C—H (1 094, 1 036, 914 cm-1) were observed. The above shows that free 2-Cl-4-FHBA molecules have started to decompose. At 515.30 K, the absorption bands CO2 (2 371-2 358 cm-1) and H2O (3 400-3 953 cm-1) are found. And some characteristic bands are observed: νC=C (1 599, 1 563, 1 536 cm-1), νC—H (2 875-3 037 cm-1), γC—H (1 060, 1 028, 825 cm-1), νC=N (1 468 cm-1), νC—N (1 236, 1 129 cm-1). This indicates that the remaining free 2-Cl-4-FHBA molecules and some 5, 5′-DM-2, 2′-bipy molecules decompose in the second step. At T=771.33 and 826.68 K, the bands were the strongest absorptions of the third and fourth step decomposition. We have observed not only the absorption of CO2 and H2O but also the characteristic absorption of C=N, C—N, C=C, C—H, and C=O. It indicates that the remaining 5, 5′-DM-2, 2′-bipy and 2-Cl-4-FBA ligands are decomposed. The results are consistent with the thermogravimetric analysis.
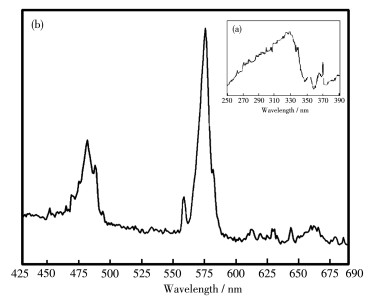
2.6 Fluorescence property
It is obtained from the excitation spectrum in Fig. 9a that there was a strong excitation-wide peak in a range of 240-400 nm, which is mainly due to the absorption peak generated by electron transfer from the ligand to the central ion. After excitation at 329 nm, the ligand-mediated emission spectra of complex 2 showed two characteristic emission bands of Dy3+ at 482 and 576 nm[25-26]. The reason why the Dy complex sensitized by 2-Cl-4-FBA ligand has yellow light is that the transition intensity of 4F9/2 → 6H13/2 (yellow) is greater than that of 4F9/2 → 6H15/2 (blue) (Fig. 9b)[27-28].
Figure 9
3. Conclusions
In summary, we have successfully assembled 5, 5′-DM-2, 2′-bipy, 2-Cl-4-FBA, and lanthanide nitrate into two novel one- and two-dimensional lanthanide complexes, and carried out a series of characterization for them. Although the two complexes have different structures, they all form a 1D chain and 2D planar structures. Each stage of the thermal decomposition behavior of the two complexes was described by TG-DSC/ FTIR technology. In addition, the fluorescence spectra of solid complex 2 showed the luminescence characteristics of Dy3+ ions.
Acknowledgments: The research work was supported by the National Natural Science Foundation of China (Grant No.22273015). -
-
[1]
Dang D B, Bai Y, He C, Wang J, Duan C Y, Niu J Y. Structural and catalytic performance of a polyoxometalate-based metal-organic framework having a lanthanide nanocage as a secondary building block[J]. Inorg. Chem., 2010, 49(4): 1280-1282. doi: 10.1021/ic901504q
-
[2]
Hao J M, Yu B Y, Van H K, Cui G H. A series of d10 metal coordination polymers based on a flexible bi-methylbenzimidazole) ligand and different carboxylates: Synthesis, structures, photoluminescence and catalytic properties[J]. CrystEngComm, 2015, 17(11): 2279-2293. doi: 10.1039/C4CE02090A
-
[3]
Xuan W M, Zhu C F, Liu Y, Cui Y. Mesoporous metal-organic framework materials[J]. Chem. Soc. Rev., 2012, 41(5): 1677-1695. doi: 10.1039/C1CS15196G
-
[4]
Ilmi R, Kansız S, Dege N, Khan M S. Synthesis, characterization, DNA binding and cleaving properties of photochemically activated phenanthrene dihydrodioxin[J]. J. Photochem. Photobiol. A, 2019, 377: 268-281. doi: 10.1016/j.jphotochem.2019.03.036
-
[5]
Yan L, Zhang J L, Hu H M, Wang F, Bai C, Li X Y, Wang X, Wang B Z. Structural diversity and near-infrared luminescence of lanthanide coordination polymers with different flexibility and coordination orientation based on bipyridyl carboxylate and dicarboxylate ligands[J]. J. Solid State Chem., 2020, 292: 121654. doi: 10.1016/j.jssc.2020.121654
-
[6]
Taha Z A, Hijazi A K, Al Momani W M. Lanthanide complexes of the tridentate Schiff base ligand salicylaldehyde-2-picolinoylhydrazone: Synthesis, characterization, photophysical properties, biological activities and catalytic oxidation of aniline[J]. J. Mol. Struct., 2020, 1220: 128712. doi: 10.1016/j.molstruc.2020.128712
-
[7]
Bünzli J C G. The role of 2, 3-dihydro-1-H-1, 3, 2-diazaboroles in luminescent molecules[J]. Coord. Chem. Rev., 2015, 293-294: 19-47. doi: 10.1016/j.ccr.2014.10.013
-
[8]
Miyata K, Konno Y, Nakanishi T, Kobayashi A, Kato M, Fushimi K, Hasegawa Y. Chameleon luminophore for sensing temperatures: Control of metal-to-metal and energy back transfer in lanthanide coordination polymers[J]. Angew. Chem. Int. Ed., 2013, 52(25): 6413-6416. doi: 10.1002/anie.201301448
-
[9]
Yang D Q, Liu D X, Tian C K, Wang S, Li H R. Synergistic effect of well-defined dual sites boosting the oxygen reduction reaction[J]. J. Colloid Interface Sci., 2018, 519: 11-17. doi: 10.1016/j.jcis.2018.02.025
-
[10]
Dogaheh S G, Barbero S, Barrientos J, Janczak J, Soleimannejad J, Sanudo E C. Cathecol and naphtol groups in salphen-type Schiff bases for the preparation of polynuclear complexes[J]. J. Mol. Struct., 2020, 1219: 129060. doi: 10.1016/j.molstruc.2020.129060
-
[11]
Zhang X T, Fan L M, Sun Z, Zhang W, Fan W L, Sun L M, Zhao X. Syntheses, structures, and luminescence of four lanthanide metal-organic frameworks based on lanthanide-oxide chains with C2- or C3-symmetric trigonal-planar polycarboxylate ligands[J]. CrystEngComm, 2013, 15(24): 4910-4916. doi: 10.1039/c3ce27082c
-
[12]
Litvinova Y M, Gayfulin Y M, Brylev K A, Piryazev D A, van Leusen J, Kögerler P, Mironov Y V. Metal-organic frameworks with solvent-free lanthanide coordination environments: Synthesis from aqueous ethanol solutions[J]. CrystEngComm, 2020, 22(45): 7935-7943. doi: 10.1039/D0CE01240H
-
[13]
Gai Y L, Xiong K C, Chen L, Bu Y, Li X J, Jiang F L, Hong M C. Visible and NIR photoluminescence properties of a series of novel lanthanide-organic coordination polymers based on hydroxyquinoline-carboxylate ligands[J]. Inorg. Chem., 2012, 51(24): 13128-13137. doi: 10.1021/ic301261g
-
[14]
Liu G, Lu Y K, Ma Y Y, Wang X Q, Hou L, Wang Y Y. Syntheses of three new isostructural lanthanide coordination polymers with tunable emission colours through bimetallic doping, and their luminescence sensing properties[J]. Dalton Trans., 2019, 48(36): 13607-13613. doi: 10.1039/C9DT02733E
-
[15]
周孟雪, 任宁, 张建军. 2, 4, 6-三甲基苯甲酸与5,5'-二甲基-2,2'-联吡啶构筑的系列镧系超分子配合物的晶体结构、热分解机理和性能[J]. 物理化学学报, 2021,37,2004071. ZHOU M X, REN N, ZHANG J J. Crystal structure, thermal decomposition mechanism and properties of lanthanide supramolecular complexes based on 2, 4, 6-trimethylbenzoic acid and 5,5'-dimethyl-2,2'-bipyridine[J]. Acta Phys.-Chim. Sin., 2021, 37: 2004071.
-
[16]
王晨璐, 宿素玲, 任宁, 张建军. 卤代芳香族羧酸与含氮配体合成镧系配合物的结构、热化学和荧光性质[J]. 物理化学学报, 2023,39,2206035. WANG C L, SU S L, REN N, ZHANG J J. Construction, thermochemistry, and fluorescence properties of novel lanthanide complexes synthesized from halogenated aromatic carboxylic acid and nitrogen-containing ligands[J]. Acta Phys.-Chim. Sin., 2023, 39: 2206035.
-
[17]
Zhang C C, Ma X F, Cen P P, Jin X Y, Yang J H, Zhang Y Q. A series of lanthanide(Ⅲ) metal-organic frameworks derived from a pyridyl-dicarboxylate ligand: Single-molecule magnet behaviour and luminescence properties[J]. Dalton Trans., 2020, 49(40): 14123. doi: 10.1039/D0DT02736G
-
[18]
Vishwakarma A, Sengupta S K, Pandey O P. Characterizations and photo-physical properties of synthesized europium(Ⅲ) and terbium(Ⅲ) complexes with mercapto-triazole Schiff base ligands[J]. J. Lumin., 2021, 229: 117659. doi: 10.1016/j.jlumin.2020.117659
-
[19]
Chen Y M, Liu S S, Gao R, Wang Y, Zhang W J, Ju Z H. Synthesis, structures and luminescence of two lanthanide coordination polymers based on 2, 4-pyridinedicarboxylic acid[J]. J. Solid State Chem., 2019, 279: 120931. doi: 10.1016/j.jssc.2019.120931
-
[20]
Gusev A, Shul'gin V, Braga E, Zamnius E, Lyubomirskiy N, Kryukova M, Linert W. Luminescent properties of zinc complexes of 4-formylpyrazolone based azomethine ligands: Excitation-dependent emission in solution[J]. J. Lumin., 2019, 212: 315-321. doi: 10.1016/j.jlumin.2019.04.055
-
[21]
Xu B, Yan L, Hu H M, Bai C, Xue L L, He S. Construction of lanthanide coordination polymers based on mixed terpyridyl and dicarboxylate ligands: Syntheses, structures, and luminescent properties[J]. J. Solid State Chem., 2020, 288: 121424. doi: 10.1016/j.jssc.2020.121424
-
[22]
Wang P, Fan R Q, Yang Y L, Liu X R, Xiao P, Li X Y, Hasi W, Cao W W. Two-/three-dimensional open lanthanide-organic frameworks containing rigid/flexible dicarboxylate ligands: Synthesis, crystal structure and photoluminescent properties[J]. CrystEngComm, 2013, 15(22): 1931-1949.
-
[23]
周孟雪, 任宁, 张建军. 氯代芳香羧酸与联吡啶配体构筑的四种稀土配合物的晶体结构、热分析和荧光性质[J]. 无机化学学报, 2020,36,(12): 2349-2358. ZHOU M X, REN N, ZHANG J J. Four rare earth complexes with chlorinated carboxylic acids and bipyridine ligands: Crystal structures, thermal analysis and luminescence properties[J]. Chinese J. Inorg. Chem., 2020, 36(12): 2349-2358.
-
[24]
Adhikary A, Sheikh J A, Biswas S, Konar S. Synthesis, crystal structure and study of magnetocaloric effect and single molecular magnetic behaviour in discrete lanthanide complexes[J]. Dalton Trans., 2014, 43(24): 9334-9343. doi: 10.1039/C4DT00540F
-
[25]
Faheim A A, Abdou S N, Abd El-Wahab Z H. Synthesis and characterization of binary and ternary complexes of Co(Ⅱ), Ni(Ⅱ), Cu(Ⅱ) and Zn(Ⅱ) ions based on 4-aminotoluene-3-sulfonic acid[J]. Spectroc. Acta Pt. A-Molec. Biomolec. Spectr., 2013, 105: 109-124. doi: 10.1016/j.saa.2012.12.018
-
[26]
Zhang L, Ji Y F, Xu X B, Liu Z L, Tang J K. Synthesis, structure and luminescence properties of a series of dinuclear LnⅢ complexes (Ln=Gd, Tb, Dy, Ho, Er)[J]. J. Lumin., 2012, 132(8): 1906-1909. doi: 10.1016/j.jlumin.2012.03.040
-
[27]
Xu J H, Xia X Z, Zhang G, Wu H L, Qu Y, Xia L X, Han X T. Two heteronuclear ZnⅡ/CdⅡ-DyⅢ complexes based on open-chain ether Schiff base ligand: Synthesis, structures, fluorescence, and antioxidation activity[J]. Inorg. Chim. Acta, 2020, 512: 119918. doi: 10.1016/j.ica.2020.119918
-
[28]
Xu J, Cheng J W, Su W P, Hong M C. Effect of lanthanide contraction on crystal structures of three-dimensional lanthanide based metal-organic frameworks with thiophene-2, 5-dicarboxylate and oxalate[J]. Cryst. Growth Des., 2011, 11(6): 2294-2301. doi: 10.1021/cg101736e
-
[1]
-
Figure 1 (a) ORTEP diagram of complex 1 with a 50% probability; (b) Coordination polyhedron of the Pr3+ ion in 1
Symmetry codes: #1: 1-x, 1-y, 1-z.
Figure 2 (a) One-dimensional chain structure of complex 1 viewed along the a-axis; (b) 2D structure of 1 viewed from the a- and c-axis directions
Figure 3 (a) ORTEP diagram of complex 2 with a 50% probability; (b) Coordination polyhedron of the Dy3+ion in 2
Symmetry codes: #1: 1-x, -y, 1-z.
Figure 4 (a) One-dimensional chain structure of complex 2viewed along the a-axis; (b) 2D structure of 2 viewed from the a- and b-axis directions
Figure 7 Three-dimensional FTIR stacking diagrams of gas escaping of complexes 1 (a) and 2 (b)
Table 1. IR and Raman spectra of the complexes and ligands
Compound νC=N δC—H νC=O νas(COO-) νs(COO-) νLn—O νLn—N IR Raman IR IR Raman IR Raman IR Raman IR Raman Raman 2-Cl-4-FHBA 1 696 1 653 5, 5′-DM-2, 2′-bipy 1 467 1 503 827, 736 1 1 484 1 510 862, 788 1 626 1 600 1 402 1 415 415 420 204 2 1 483 1 509 861, 788 1 636 1 603 1 405 1 425 418 420 208  下载: 导出CSV
Table 2. Crystal and structure refinement data for complexes 1 and 2
Parameter 1 2 Empirical formula C66H42Cl6F6N4O12Pr2 C80H50Cl8Dy2F8N4O16 Formula weight 1 691.55 2 083.84 Temperature / K 298.15 298.15 Crystal system Triclinic Triclinic Space group P1 P1 a / nm 1.119 33(11) 1.270 20(11) b / nm 1.238 45(12) 1.297 59(12) c / nm 1.316 93(14) 1.405 71(13) α / (°) 87.837(2) 112.761(4) β / (°) 89.275(2) 96.631(2) γ / (°) 72.148 0(10) 102.695(3) Volume / nm3 1.736 4(3) 2.031 8(3) Z 1 2 Dc / (g·cm-3) 1.618 1.703 Absorption coefficient / mm-1 1.695 2.175 F(000) 836 1 026 Crystal size / mm 0.40×0.18×0.07 0.30×0.11×0.07 θ range for data collection / (°) 4.558-56.55 5.158-50.36 Limiting indices -14 ≤ h ≤ 14, -15 ≤ k ≤ 16, -17 ≤ l ≤ 10 -15 ≤ h ≤ 14, -15 ≤ k ≤ 13, -9 ≤ l ≤ 16 Reflection collected, unique 10 893, 7 996 (Rint=0.062 3) 10 328, 7 033 (Rint=0.030 5) Completeness to θ=25.02° / % 98.1 98.1 Max. and min. transmission 0.890 6 and 0.550 5 0.862 7 and 0.561 5 Data, restraint, parameter 7 996, 0, 424 7 033, 24, 530 Goodness-of-fit on F 2 1.001 0.991 Final R indices [I > 2σ(I)] R1=0.077 9, wR2=0.191 4 R1=0.038 1, wR2=0.086 2 R indices (all data) R1=0.107 4, wR2=0.216 0 R1=0.048 9, wR2=0.092 4 Largest diff. peak and hole / (e·nm-3) 1 830 and -1 640 1 830 and -910
下载: 导出CSV
Table 3. Selected bond lengths (nm) for complexes 1-2
1 Pr1—O4#1 0.230 4(7) Pr1—O3 0.236 7(7) Pr1—O1 0.236 2(6) Pr1—O2#1 0.238 2(6) Pr1—O6 0.242 4(7) Pr1—O5 0.243 2(7) Pr1—N1 0.255 6(8) Pr1—N2 0.259 9(8) 2 Dy1—O4#1 0.231 7(3) Dy1—O3 0.233 2(3) Dy1—O2#1 0.234 1(3) Dy1—O5 0.239 4(3) Dy1—O1 0.239 9(3) Dy1—O6 0.251 4(4) Dy1—N2 0.253 9(4) Dy1—N1 0.257 4(3) Dy1—O2 0.270 8(3) Symmetry codes: #1: 1-x, 1-y, 1-z for 1; #1: 1-x, -y, 1-z for 2.
下载: 导出CSV
Table 4. Thermal analysis data of complexes 1 and 2
Complex Step Temperature range / K Tp of DTG / K Mass loss rate / % Probably expelled groups Intermediate and residue Found Calcd. 1 Ⅰ 438.15-599.15 501.45 21.53 21.78 2(5, 5′-DM-2, 2′-bipy) [Pr2(2-Cl-4-FBA)6] Ⅱ 599.15-801.15 780.15 42.06 58.04 6(2-Cl-4-FBA) Pr6O11 Ⅲ 801.15-1 260.65 829.05 15.21 2 Ⅰ 410.15-476.15 461.15 1.91 x(2-Cl-4-FHBA) [Dy2(2-Cl-4-FBA)6(5, 5′-DM-2, 2′-bipy)2]·(2-x)(2-Cl-4-FHBA) Ⅱ 476.15-632.15 515.15 20.41 (2-x)(2-Cl-4-FHBA)+ y(5, 5′-DM-2, 2′-bipy) [Dy2(2-Cl-4-FBA)6(5, 5′-DM-2, 2′-bipy)2-y] Ⅲ 632.15-792.25 766.15 39.41 (2-y)(5, 5′-DM-2, 2′-bipy)+z(2-Cl-4-FBA) [Dy2(2-Cl-4-FBA)6-z] Ⅳ 792.15-1 260.25 822.15 17.62 (6-z)2-Cl-4-FBA Dy2O3
下载: 导出CSV
-


 扫一扫看文章
计量
- PDF下载量: 3
- 文章访问数: 2397
- HTML全文浏览量: 200
 下载:
下载:
