Figure 1.
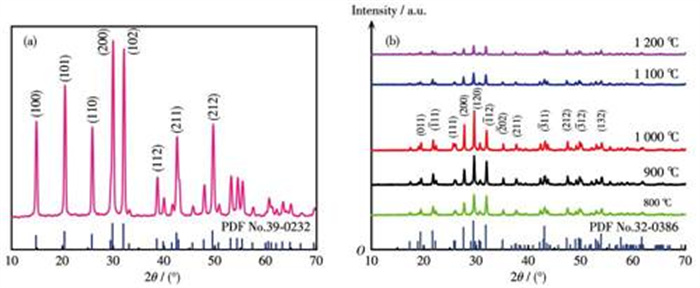
XRD patterns of the precursor GdPO4·H2O∶2%Sm3+ (a) and GdPO4∶2%Sm3+ obtained by calcination at different temperatures (b)
GdPO4: Sm3+ phosphor: Optimization of calcination temperature and doping concentration and fluorescence and magnetic properties
Jin-Xiu WU , Qian-Qian WANG , Bao-Long WU , Zhao-Gang LIU , Yan-Hong HU , Yuan-Hao QI , Xiao-Wei ZHANG , Fu-Shan FENG , Jian-Fei LI

Rare earth phosphate has excellent chemical and thermal stability and unique structural characteristics, which make it have excellent optical and magnetic properties. Therefore, it is widely used in optical materials, magneto-optical/resistive materials, dielectric materials, laser materials, and chemical sensors[1]. GdPO4 has been extensively studied for its unique properties in various rare earth-doped phosphates. Under the effect of seven non-paired electrons, Gd3+ions have strong paramagnetism. It can be used to design new magnetic resonance functional materials with electron relaxation time in the order of micro nanoseconds[2-3]. The study of Sm3+ - doped phosphate luminescent materials is helpful to explain the luminescent mechanism of rare earth ions in phosphate matrix and has certain basic theoretical significance for the development and utilization of rare earth in lumines cence and magnetic resonance imaging[4-5].
Ouertani et al.[6] studied the impact of Sm3+ doping concentration and excitation wavelength on the spectral characteristics of GdPO4∶Sm3+ phosphors. Li et al. [7] prepared a series of red-orange phosphors Ba3Gd1-x (PO4)3∶xSm3+ through the high- temperature solid -phase reaction. It had very strong absorption and bright red-orange emission in the near - ultraviolet region. Liu et al. [8] synthesized a series of Sr3GdNa(PO 4)3F∶Sm3+ through a high - temperature solid- phase reaction, explored that the Sm3+ concentration quenching was attributable to the electric dipole-electric dipole interaction, and calculated that the activation energy of thermal quenching was 0.242 eV. Hu et al. [9] proposed introducing Tb3+ ions into YPO4∶Sm3+ crystals to improve their luminescent properties, which increased the luminescence intensity and duration of Sm3+ at room temperature by about 14 times. Nair et al. [10] synthesized Ca3Mg 3(PO4)4∶Sm3+ phosphors through the combustion method and the prepared phosphors were potential candidates for orange light - emitting diode (LED). Zou et al.[11] synthesized LaPO4∶Sm3+ nanocrystalline luminescent material with lactic acid (LA) as the cosolvent using the solvothermal method. LA not only significantly restricts the inherent one -dimensional (1D) growth of hexagonal LaPO4 crystals along the [001] direction, resulting in the shape change from microfilaments to nanoparticles, but also promotes the growth of crystals. Our research group[12-13] synthesized a series of nanophosphors using the hydrothermal method and studied the concentration quenching and energy conversion mechanism of Sm3+ and Eu3+.
The luminescence mechanism of rare earth samarium ions has been studied more, but the high temperature luminescence mechanism and magnetic properties of phosphors have not been studied much[14]. Therefore, based on previous research, the impact of the optimal calcination temperature on the luminescent properties of GdPO4∶Sm3+ phosphors was investigated first, then the Sm3+ doping concentration and concentration quenching mechanism were optimized in this paper. The high temperature luminescence characteris- tics and magnetic properties of the optimal products were mainly studied. The research results have impor- tant guiding significance in the development of rare earth resources in the field of magneto - optical materials, and the potential applications in bioimaging and magnetic resonance imaging.
Gd2O3, concentrated phosphoric acid, concentrated nitric acid, and NaOH (AR) were purchased from Sinopharm Group Chemical Reagent Co. Sm2O3 (99.999%) was purchased from the Baotou Rare Earth Research Institute. The experimental water was all deionized water.
The hydrothermal method was used to prepare GdPO4•H 2O∶Sm3+. The molar fraction (x) of Sm3+ dop- ing were 0%, 1%, 2%, 3%, 4%, 6%, and 10%, respectively. First, Sm2O3 and Gd2O3 were dissolved in 6 mol• L-1 HNO3 solution to prepare 0.5 mol•L-1 Gd(NO3)3 and 0.05 mol•L-1 Sm(NO 3)3 solutions, respectively. In a 100 mL beaker, a certain amount of Gd(NO3)3 and Sm(NO3)3 solution was mixed. H 3PO4 (1.5 mol•L-1) solution was added dropwise to the mixture. After enough reaction, 6 mol•L-1 NaOH was used to bring the pH of the reaction system down to 1 - 2, and the solution was stirred for 10 min and then dispersed by ultrasonic for 30 min to produce about 60 mL of suspension liquid. This suspension liquid was transferred into the Teflon liner of a 100 mL high - pressure reactor with a filling degree of 80%. Then, the reactor was placed in an air - dry oven with a reaction temperature of 200 ℃ and maintained for 8 h until the reaction was completed. The cation and anion′s molar ratio was 1∶3 at this point. After the reaction, the product was cooled to room temperature, performed centrifugal separation, washed, and dried at 80 ℃ for grinding, and then the phosphor precursor GdPO4•H2O, GdPO4•H2O∶1%Sm3+, GdPO4•H2O∶2%Sm3+, GdPO4•H2O∶3%Sm3+, GdPO4•H2O∶4%Sm3+, GdPO4• H2O∶6%Sm3+, GdPO4•H2O∶10%Sm3+ was obtained, which is corresponded to x=0%, 1%, 2%, 3%, 4%, 6%, and 10%.
The prepared precursor GdPO 4•H2O∶2%Sm3+ was put into a corundum crucible and a muffle furnace to calcine for 3 h at 800, 900, 1 000, 1 100, or 1 200 ℃, respectively. The finished product was then ground with an agate mortar, cooled to room temperature, packaged for measurement, and then GdPO4∶2%Sm3+ calcined at different temperatures were obtained.
The structural characterization was carried out using Bruker D8 Advance X-ray diffractometer (Cu Kα, λ =0.154 06 nm, I=200 mA, and U=40 kV, scanning range of 10°-70°, scanning speed of 4 (°)•min-1). The crystal size, morphology, particle size, distribution, and constituent element of the samples were measured by a Sigma 500 AMCs scanning electron microscope, and the working voltage was 3 kV. The hysteresis curves of the samples were detected by SQUID-VSM magnetometer. The excitation and emission spectra of the samples were obtained using a Hitachi F - 4600 fluorescence spectrophotometer (Japan). The phosphorescence life time was measured by FL920 series steady/transient state luminescence spectrometer. All the samples were tested at room temperature. In addition, the temperature - dependent emission spectra of the samples were measured using a Hitachi F-4600 fluorescence spectro- photometer (Japan), and the temperature was adjusted by the Janis VPF-800 temperature-controlling system.
From Fig. 1a, the positions of the diffraction peaks of the precursor GdPO4•H2O∶2%Sm3+ are the same as the hexagonal crystal system GdPO4•H2O (P3121 (152), PDF No. 39 - 0232). It indicates that the precursor is a pure - state hexagonal structure. It can be known from the standard card that the space group of GdPO4•H2O is P3121 (152). The crystal cell parameters are a=b= 0.690 5 nm, c=0.632 6 nm, α=β=90°, γ=120°, Z=3, V=0.261 2 nm3. No other peak (such as SmPO4) was observed in Fig. 1a, indicating that Sm3+ did not change the crystal structure of the GdPO4 matrix, and better replaced the Gd3+ ion site in the crystal lattice, achieving effective doping[15-17].
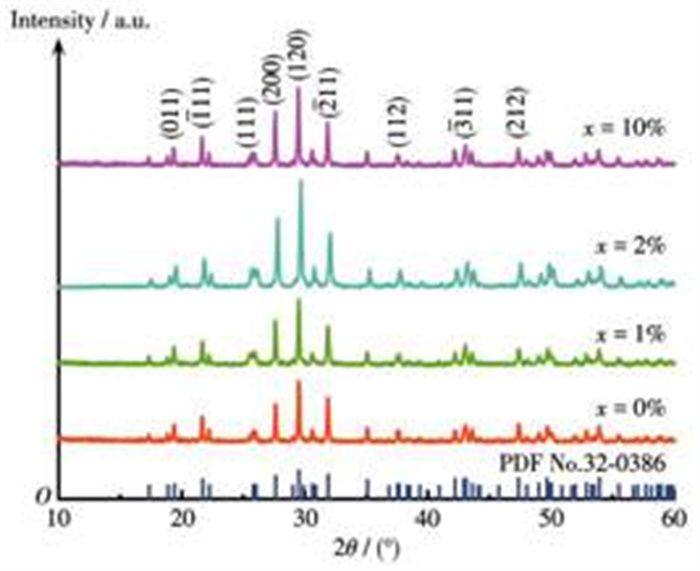
Fig. 1b shows the XRD patterns of the products GdPO4∶2%Sm3+ obtained by calcination at 800, 900, 1 000, 1 100, and 1 200 ℃, respectively. The diffraction peak positions of all the samples were the same, but were different from the characteristic diffraction peak of the precursor, indicating that the calcined phosphors had the same lattice structure, which are different from that of the precursor[18]. Through comparison of the diffraction peak of the calcined phosphor and the characteristic peak in the standard pattern (PDF No.32- 0386) of GdPO 4 in the monoclinic crystal system, the positions of the peaks were completely consistent, and there was no extra peak, indicating that the final product is GdPO4 in the monoclinic crystal system P21/n (14). The crystal cell parameters are a=0.665 3 nm, b= 0.684 5 nm, c=0.644 3 nm, Z=4, and V=0.279 9 nm3. The phosphors prepared with calcination temperatures of 800 to 1 200 ℃ had strong diffraction peaks at (200), (120), and (112) planes, and the strongest peak was the (120) plane. Through comparison of the intensity of the diffraction peaks in Fig. 1b, the crystallization properties of the phosphor prepared with a calcination temperature of 1 000 ℃ were the best.
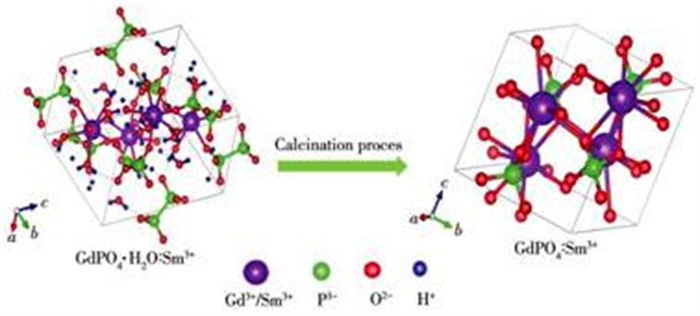
It indicates that the phosphor precursor changed from a hexagonal crystal system to a monoclinic crystal system after calcination. The hexagonal crystal system GdPO4 •H2 O∶2%Sm3+ lost crystal water through calcination so the final product was the monoclinic crystal system GdPO 4∶2%Sm3+. The crystal lattice transformation process is shown in Fig. 2. The distributions of atoms in the two crystal structures are similar. It is related to the difference in the number of coordinating oxygens of gadolinium. In the hexagonal crystal system GdPO4• H2O, Gd3+ and 6 oxygen atoms form a quadrilateral bipyramid. After dehydration, Gd3+ and 9 oxygen atoms form a triangular prism, and one phosphorus atom and three oxygen atoms form a tetrahedron.
Fig. 3 shows that the morphology of the precursor GdPO4•H2O∶2%Sm3+ was rod-like. The morphology of GdPO4∶2%Sm3+ obtained by calcination at 800 ℃ was still nanorod, but the size of the nanorod was 2-3 times larger than that of the precursor, and the nanoparticles had better dispersibility. GdPO4∶2%Sm3+ obtained by calcination at 900 ℃ maintained a nanorod morphology, but the nanoparticles showed obvious agglomeration and some edges were melted. GdPO4∶2%Sm3+ obtainedby calcination at 1 000 ℃ exhibited an ellipsoid - shaped micro-block morphology, with uniform distribution and better dispersibility. GdPO4∶2%Sm3+ obtained by calcination at 1 100 ℃ exhibited an ellipsoid - shaped micro - block morphology that aggregated into clusters, forming larger irregular particles with uneven shape distribution. GdPO4∶2%Sm3+ obtained by calcination at 1 200 ℃ indicated nanoparticles were fusion, blurred boundaries, and forming clusters. From the above analysis, with the temperature increasing, the morphology changed from nanorods to micro - and nano- like spherical particles until the emergence of sintered masses. The mechanism of the phenomenon: in the hexagonal structure, the c - axis has a high symmetry, thus the samples tend to grow along the c -axis, whereas the growth of the other two axes may be compressed. However, with the increased temperature, the atoms slightly shift and break the symmetry of the crystal structure due to the removal of water from GdPO4•H2O. Therefore, the samples will no longer grow along with the c - axis. Meanwhile, it is suggested that they can grow along the a - axis and b - axis. Thus, it is reasonable to observe that the morphology of the sample transforms from nanorods to spheroidal particles[19-20].
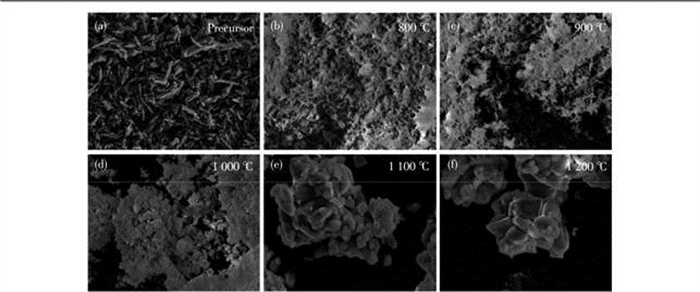
Fig. 4a shows that the samples had a series of excitation peaks in the range of 250-450 nm. The peak at 273 nm is due to the absorption of the Gd3+ charge transfer band from 8S7/2 to 6I11/2, while the peaks at 361, 373, and 401 nm correspond to the transitions of Sm3+ from 6H5/2 to 4H7/2, 6H5/2 to 4P7/2, and 6H5/2 to 4F7/2, respectively. The peak at 401 nm is the strongest excitation peak[21-22]. Fig. 4b shows that when the product is excited by ultraviolet light at 401 nm, the luminescent spectra of the samples at 562, 599, and 646 nm exhibited three main characteristic emission peaks of Sm3+, which belonged to the 4G5/2 → 6HJ (J=5/2, 7/2, 9/2) transition, respectively[23-24]. The luminous intensity of the emission peak was the strongest at 600 nm. In Fig. 4c, under the excitation of ultraviolet light at 273 nm, the emission peak of the luminescent spectrum of the GdPO4∶2%Sm3+ at 599 nm was the strongest characteristic peak of Sm3+. The emission peak at 626 nm is that of Gd3+, which belonged to the electronic transition of6G3/2 → 6P7/2[25].

The results show that the shapes and positions of the excitation and emission peaks of the precursor and products were the same at different calcination temperatures, but the intensities of the excitation and emission peaks of the precursor were very weak. The intensities of the excitation and emission peaks of the GdPO 4∶ 2%Sm3+ (800 and 900 ℃) were about 4 times that of the precursor. The intensities of the excitation and emission peaks of the GdPO4∶2%Sm3+ obtained by calcination at 1 000 ℃ reached the maximum value, which was almost 20 times that of the precursor. It is suggested that the luminescence performance of phosphors with monoclinic crystals is better than that of phosphors with hexagonal crystal systems because the hydroxyl groups in the water molecules in hexagonal crystal systems have a quenching effect on the lumines- cence[15]. The spheroidal sample is beneficial to decrease the non - radiative rate and thus increase the luminescent intensity. Because of the fewer defects of the spheroidal morphology, it is beneficial to decrease the non - radiative rate and thus there are more electrons to relax down to the ground state, leading to an increase in the luminescent intensity. It also indicates that the optimum calcination temperature of GdPO4∶ 2%Sm3+ was 1 000 ℃.
Under the excitation by 401 nm near - ultraviolet light, the color coordinates of GdPO4∶2%Sm3+ obtained at different calcination temperatures are drawn in Fig. 5. The color coordinates of the precursor were X= 0.542 3, Y=0.456 5, and the emitting color was orange. The color coordinates of the GdPO4∶2%Sm3+ phosphor calcined at 1 000 ℃ were X=0.583 4, Y =0.415 8. The colors of the phosphors were all orange - red. The color coordinate of the sample does not change much with the increase in the calcination temperature. It indicates that such phosphors changed from orange to orange-red.
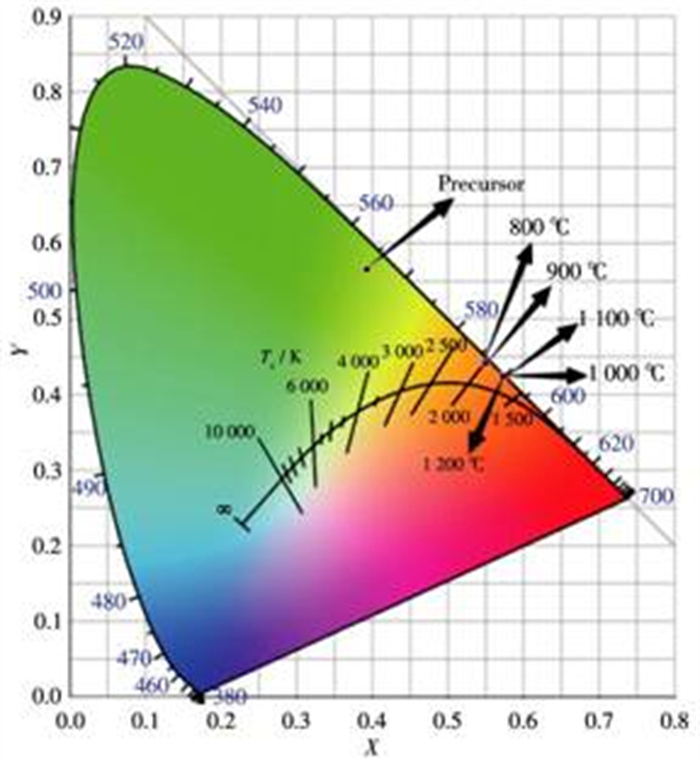
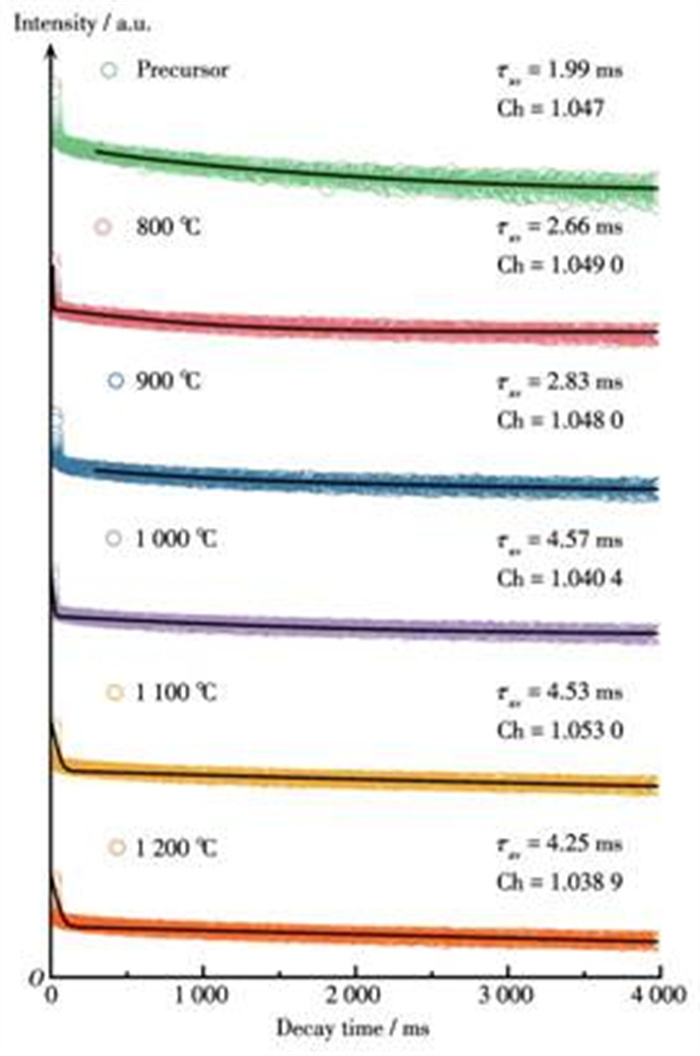
Fig. 6 shows the luminescence decayed curves of GdPO4∶2%Sm3+ for the transition from 4 G5/2 → 6H7/2 (599 nm). These decay curves can be fitted with Formu-la1[26]
Ch is the fitting coefficient
|
|
(1) |
Where It is the emission intensity at time t, I0 is the emission intensity at t=0, τ1 and τ2 are the long life- times and short lifetimes, and A1 and A2 are constants. The average lifetime (τav) can be calculated with Formu- la 2[27-28]:
|
|
(2) |
The fitting results are shown in Fig. 6. The lifetime of the calcined phosphor obtained by calcination at 1 000 ℃ (4.57 ms) is more than twice that of the precursor (1.99 ms), which further proved that the phosphor in the monoclinic system had better luminescence properties. It might be due to the different crystal structures, crystallinity, and morphology of phosphors. The change laws for the intensity of the excitation and emission spectra of the phosphor in Fig. 4 at various calcination temperatures were the same as those for the phos- phorescence lifetime of GdPO4∶2%Sm3+, indicating that the luminescence properties of micro - scale phos- phors were stronger than those of nano - scale phos- phors. From the above results, the luminescence perfor- mance of the monoclinic crystal structure and uniformly dispersed sphere-like morphology GdPO4∶2%Sm3+ is better. It indicates that 1 000 ℃ is the ideal calcination temperature for the phosphors.
At the calcination temperature of 1 000 ℃, the effect of Sm3+ doping concentration was studied.
The diffraction peaks in Fig. 7 were consistent with those in Fig. 1b and no other heterogeneous peaks appeared as the doping concentration was increased, demonstrating that the prepared samples were a pure phase. The doping of Sm3+ did not change the crystal structure of the matrix GdPO4, and the prepared samples are monoclinic crystal systems[13]. The characteristic peak of SmPO4 did not appear in the XRD pattern. Because Gd3+ (0.105 3 nm) and Sm3+ (0.107 9 nm) have similar radii and crystal structures, so Sm3+ easily replaces the lattice of Gd3+.
The morphology of GdPO4 is an irregular block, with uneven size distribution. The morphologies of GdPO 4∶1%Sm3+ and GdPO4∶2%Sm3+ were very similar. Some are like spherical particles, while others are irregular blocks with uneven size distribution but good dispersion. The morphology of GdPO4: 6%Sm3+ and GdPO 4∶10%Sm3+ was an irregular block, which is similar to that of GdPO4 (Fig. 8a). It indicates that when the Sm3+ doping concentration was relatively low, the morphology of the product was refined. As the Sm3+ doping concentration increased to 6% - 10%, the particle size of the product remained unchanged. According to the EDS analysis of Fig. 8f, GdPO4∶2%Sm3+ was only composed of O, Gd, Sm, and P. From the above results, the Sm3+ doping concentration has little effect on the morphology of the phosphor[15].
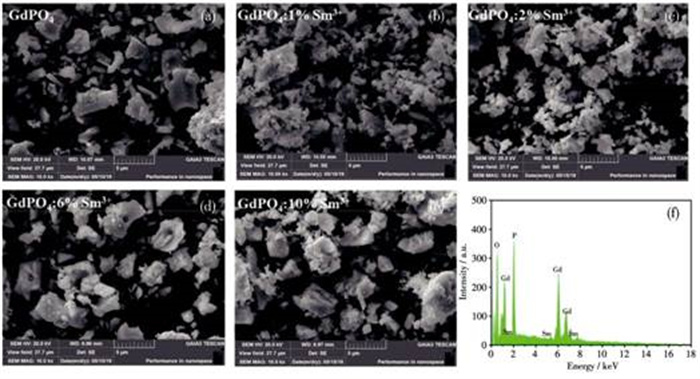
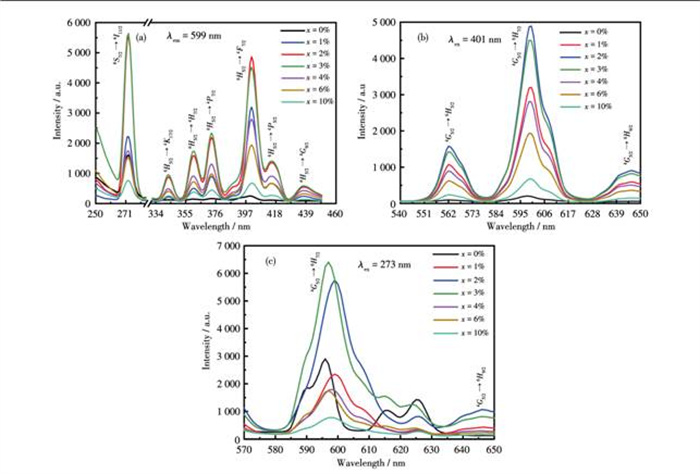
Fig. 9 shows that the intensity of the excitation and emission spectra of GdPO4∶Sm3+ increased first and then decreased gradually with the Sm3+ doping concentration. The intensities of the excitation spectrum of GdPO4∶2%Sm3+ reached the maximum at 330-450 nm. The strongest peak was located at 401 nm, which was the characteristic excitation peak of Sm3+ [29]. The intensity of the excitation spectrum of GdPO4∶3%Sm3+ at 273 nm reached the maximum, which was the characteristic excitation peak of Gd3+. It indicates that when the Sm3+ doping concentration was 3%, the characteris- tic excitation peak of Gd3+ was the strongest, and the absorption capacity was the highest.
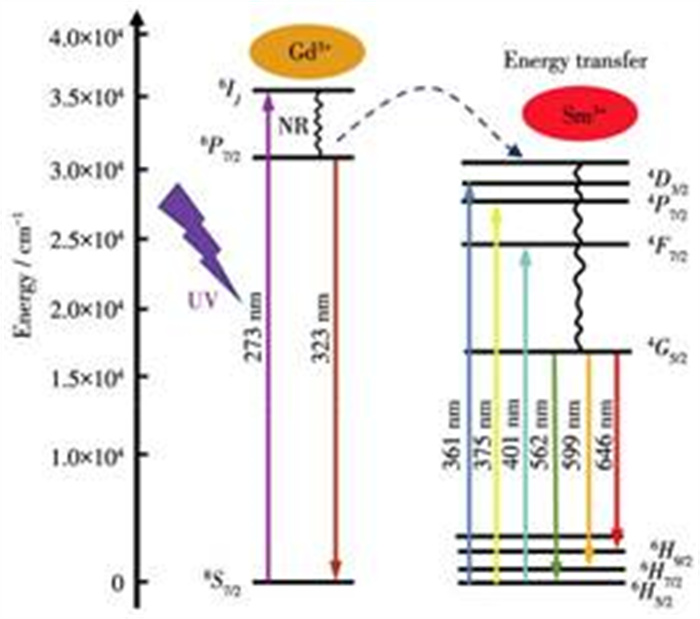
Fig. 9b shows that the luminescence intensity of GdPO4∶2%Sm3+ reached the maximum. Fig. 9c shows that under the excitation of ultraviolet light at 273 nm, the characteristic emission peaks of Gd3+ were obvious in GdPO4, which were located at 590 nm (13/26G → 6P7/2), 596 nm (6G13/2 → 6P7/2), 617 nm (6G7/2 → 6P7/2), and 626 nm (6G3/2 → 6P7/2), respectively[30]. As the Sm3+ doping concentration gradually increased, the emission spectra were mainly at 599 and 646 nm, which are the char- acteristic emission peaks of Sm3+. The intensities of the characteristic emission peaks of Gd3+ and Sm3+ increased first and then decreased gradually. The intensity of the emission peak of Sm3+ in GdPO4∶2%Sm3+ reached the maximum. The optimal doping concentration of Sm3+ was 2% - 3%. The concentration quenching phenomenon appeared when the doping concentration of Sm3+ was higher than 2%. The emission peak of Gd3+ almost disappeared when the doping concentration of Sm3+ was higher than 3%. It indicates that Gd3+ effectively transferred the absorbed energy to Sm3+ during the lumines- cence process of GdPO4∶Sm3+ [31], as shown in Fig. 10.
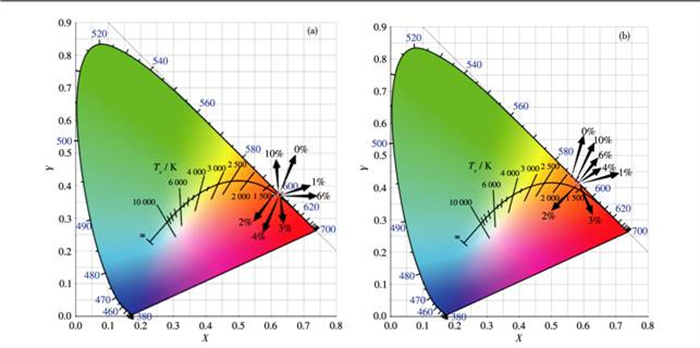
The color coordinates of GdPO4∶Sm3+ under the excitation of ultraviolet and near - ultraviolet light at 273 and 401 nm were calculated using the CIE 1931 software. The corresponding color coordinates diagrams (Fig. 11) were drawn. Under the excitation of 273 nm UV light, the luminescence color of the phosphor was red in Fig. 11a. Under the excitation of 401 nmnear-UV light, the luminescence color of the phosphor changed from red to orange - red with the increase of Sm3+ doping concentration in Fig. 11b.
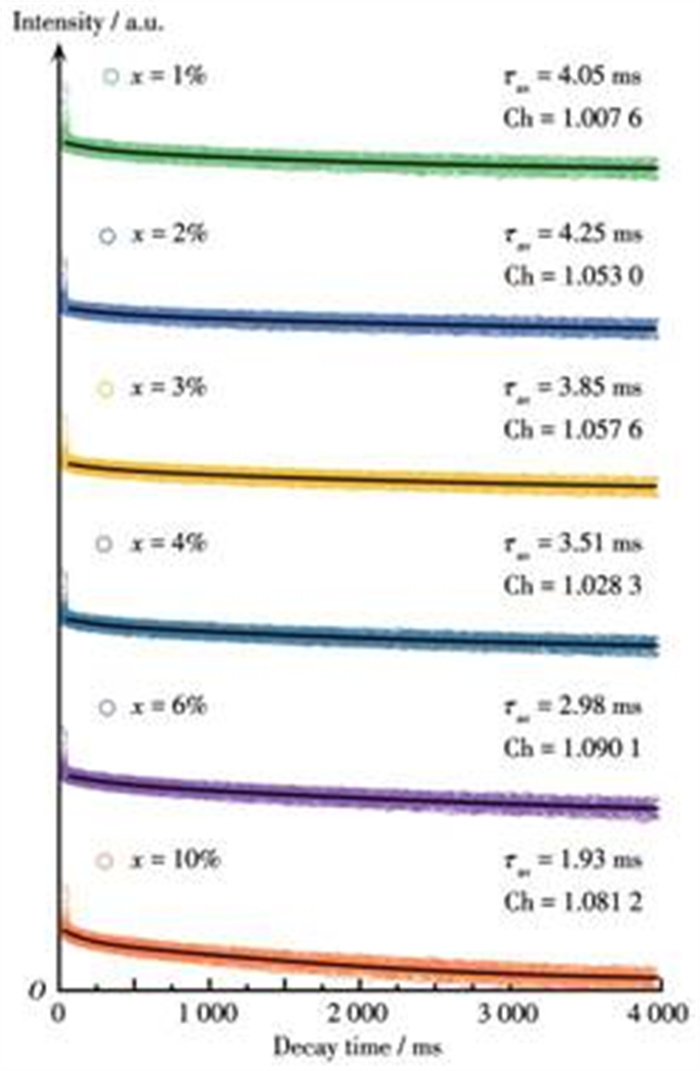
Fig. 12 shows the luminescence decay curves of the 4G5/2 → 6 H9/2 (599 nm) transition of Sm3+ for GdPO 4∶ Sm3+ under the excitation by 401 nm. These decay curves can be fitted with Formula 1. The fitting results are shown in Fig. 12. The phosphorescence lifetimes increased from 4.04 to 4.25 ms as the Sm3+ doping concentration increased from 1% to 2%. The phosphores- cence lifetime tended to decrease significantly with the increase of doping concentration when the doping con- centration was higher than 2%. The change law is con- sistent with that of luminescence intensity with Sm3+ doping concentration in Fig. 9. It further proved that the optimal doping concentration of Sm3+ was 2%. This is because the concentration quenching phenomenon occurs when the Sm3+ doping concentration is greater than 2%, which increases the energy transfer rate between Sm3+ thereby reducing the phosphorescence lifetime[32-33].
The critical distance (Dc) between neighboring Sm3+ can be used to determine the type of interaction mechanism. Blasse[34] obtained through research that the Dc of the energy transfer of rare - earth ions can be expressed with Formula 3:
|
|
(3) |
Where V is the volume of the crystal cell; c is the critical quenching concentration; N is the number of cations that can be replaced in the unit crystal cell. For the GdPO4 crystal in the monoclinic crystal system, V is 0.279 9 nm3, N=4, c=0.02-0.03. Dc=1.646-1.884 nm was obtained by Formula 3. This distance is much greater than the minimum required for energy transfer between activators (0.5 nm). Therefore, it can be indicated that the interaction between electric multipoles is the cause of the concentration quenching mechanism of GdPO4∶Sm3+. The concentration quenching mechanism of GdPO4∶Sm3+ was s tudied further according t o Dexter′s energy transfer theory[35-36]:
|
|
(4) |
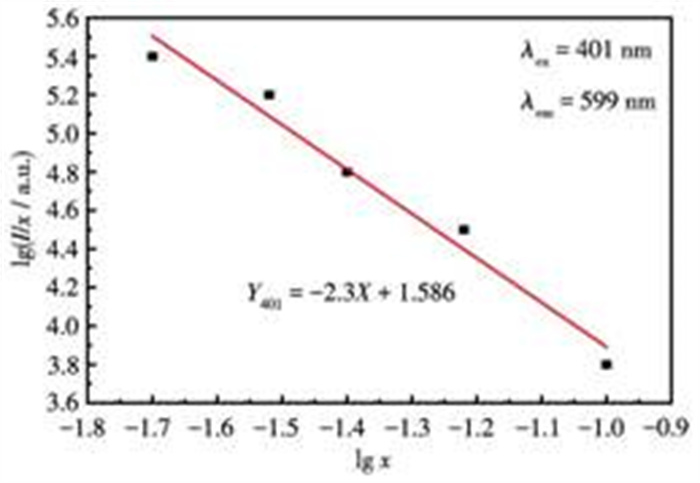
Where β and C are constants and s is the electrical multilevel interaction index. Taking lg x as abscissa and lg(I/x) as ordinate, the slope of a straight line is-s/3.
Fig. 13 shows that the curve of lg(I/x) and lg x was linear, with a slope of -2.3 which is closest to 2. It can be obtained that the s was 6. Therefore, the concentration quenching mechanism between Sm3+ is the electric dipole-electric dipole interaction.
Fig. 14a shows the high-temperature luminescence spectra of GdPO4•H2O: 2%Sm3+ from 305 to 580 K under the excitation by 401 nm. Fig. 14a shows that as the temperature increased, the shape and peak position of the emission spectrum did not change, but the intensity changed greatly. From Fig. 14b, the luminescence intensity of the emission peak at 599 nm did not change from 305 to 320 K. The luminescence intensity suddenly rose from 420 K. The luminescence intensity at 430 K was 114% of that at 305 K. The luminescence intensity at 450 K was 238% of that at 305 K. The intensity of the emission peak at 599 nm changed slightly from 450 to 580 K. It indicates that the thermal stability of the GdPO4 •H2O∶2%Sm3+ in the hexagonal crystal system is very poor. It is mainly because the GdPO4•H2O∶2%Sm3+ in the hexagonal crystal system is unstable at high temperatures and transformed to GdPO 4∶2%Sm3+ in the monoclinic crystal system[37-38], which is consistent with the analysis results in Fig. 1.
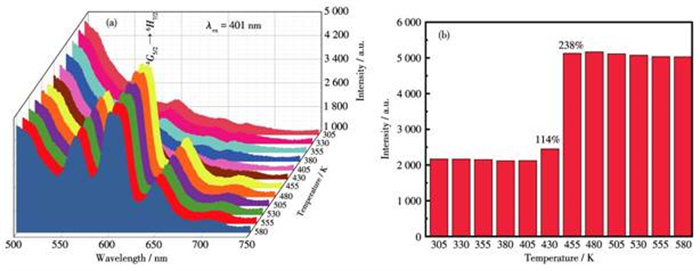
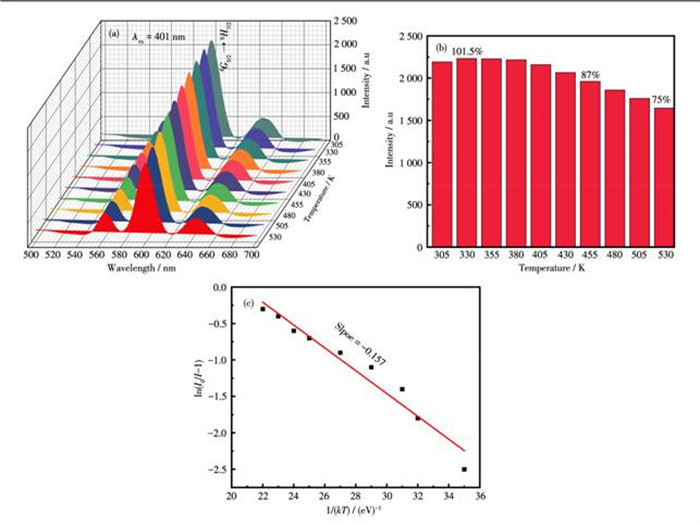
Fig. 15a shows the luminescence spectra of GdPO4∶2%Sm3+ under the excited by 401 nm at high temperatures (from 305 to 530 K). The shape and peak position of the phosphor′s emission spectrum essentially remained unchanged as the temperature rose, but the intensity gradually decreased. From 305 to 380 K, there was essentially no change in the luminescence intensity in Fig. 15b. As the temperature rose from 380 K, the luminescence intensity gradually decreased, possibly due to the thermal quenching effect[39-40]. The lumi nescence intensity of GdPO 4∶2%Sm3+ at 455 K was 87% of that at 305 K. The luminescence intensity at 530 K was 75% of that at 305 K. GdPO4∶2%Sm3+ in the monoclinic crystal system had good luminescence thermal stability. By fitting the Arrhenius equation, it is possible to determine the thermal quenching activa- tion energy (ΔE) of these phosphors[41-42]:
|
|
(5) |
Where I0 is the initial luminescence intensity, IT is the luminescence intensity at different temperatures, C is a constant, k is Boltzmann′s constant (8.62×10⁻⁵ eV• K-1), and T is the temperature. Fig. 15c shows that the slope of the straight line fitted linearly was -0.157, corresponding to a ΔE value of 0.157 eV for GdPO4∶ 2%Sm3+.
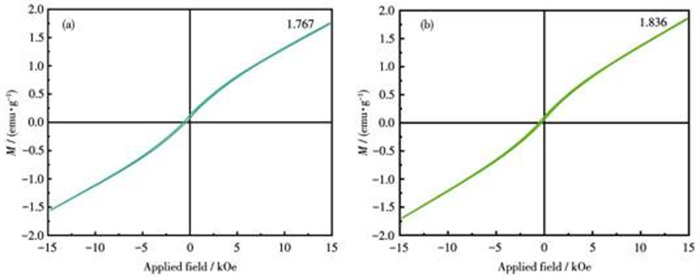
In Fig. 16, the magnetization intensity of GdPO4• H2O∶2%Sm3+ was about 1.767 emu•g-1, and the mass susceptibility was 1.18×10⁻⁴ emu•g-1•Oe-1. The magnetization intensity of GdPO4∶2%Sm3+ was about 1.836 emu•g-1, and the mass susceptibility was 1.22×10⁻⁴ emu•g-1•Oe-1. when the field intensity was 15 kOe. From the above results, the magnetic property of GdPO4∶2%Sm3+ was better than that of GdPO4•H2O∶ 2%Sm3+. The magnetization intensity of GdPO4∶ 2%Sm3+ had a good linear relationship with the external magnetic field. The coercivity and residual magne- tism are almost zero, demonstrating the product′s strong paramagnetism[43-44]. The magnetism came from Gd3+ in GdPO4∶2%Sm3+. Due to Gd3+ having 7 unpaired inner 4f electrons, which are tightly combined with the nucleus, effectively shielded by the outer shell electron 5s25 p6, and not disturbed by other ions. Therefore, Gd3+ had a high theoretical magnetic moment of 7.94 μB, resulting in paramagnetism[45]. The magnetic property of the monoclinic crystal structure and uniformly dispersed sphere-like morphology of GdPO4∶2%Sm3+ is better.
GdPO4•H2O∶Sm3+ were prepared using the hydrothermal method. Firstly, the calcination temperature was optimized, and then the doping concentration of Sm3+ was investigated. The results indicate that the crystal structure of phosphors was changed from the precursor GdPO4∶Sm3+•H 2 O in the hexagonal crystal system to GdPO4∶Sm3+ in the monoclinic crystal system. The morphology was changed from nanorods to like -sphere particles. The optimal calcination temperature was 1 000 ℃. The intensity of excitation and emission spectra of GdPO4∶Sm3+ was 20 times that of the precursor, and the phosphorescence lifetime was more than 2 times that of the precursor. The optimal doping concentration of Sm3+ was 2%-3%, and the phosphores- cence lifetime of the optimal product was 4.25 ms. The critical distance for energy transferred of GdPO4∶ 2%Sm3+ was 1.884 nm, and the concentration quenching mechanism between Sm3+ is the electric dipole - electric dipole interaction. GdPO 4∶2%Sm3+ had good thermal stability, with the thermal quenching activation energy as - 0.157 eV. Moreover, it had good paramag- netism, and its mass susceptibility was 1.22×10⁻⁴ emu• g-1•Oe-1. The multifunctional GdPO 4∶2%Sm3+ with luminescence and magnetic properties can be useful in bioimaging and magnetic resonance imaging.
Yang J F, Xiong H L, Dong J C, Yang C M, Gan S C, Zou L C. Facile hydrothermal synthesis and luminescent properties of Sm3+/Eu3+ codoped GdPO4 phosphors[J]. J. Phys. Chem. Solids, 2017, 111: 355-363. doi: 10.1016/j.jpcs.2017.08.031
Guan H X, Liu G X, Wang J X, Dong X T, Yu W S. Multicolor tunable luminescence and paramagnetic properties of NaGdF4:Tb3+/Sm3+ multifunctional nanomaterials[J]. Dalton Ttans., 2014, 43(28): 10801-10808. doi: 10.1039/c4dt00158c
Tang Y X, Mei R, Yang S K, Tang H X, Yin W Z, Xu Y C, Gao Y P. Hollow GdPO4: Eu3+ microspheres: Luminescent properties and applications as drug carrier[J]. Superlattice Microstruct., 2016, 92: 256-263. doi: 10.1016/j.spmi.2016.02.038
Yang Z F, Xu D H, Sun J Y. Synthesis and luminescence properties of Ba3Lu(PO4)3:Sm3+ phosphor for white light-emitting diodes[J]. Opt. Express, 2017, 25: 391-401. doi: 10.1364/OE.25.00A391
Jiang H X, Lv S C. Intense red emission and two-way energy transfer in Sm3+, Eu3+ co-doped NaLa(WO4)2 phosphors[J]. Mater. Res. Bull., 2019, 111: 140-145. doi: 10.1016/j.materresbull.2018.11.004
Ouertani G, Ferhi M, Horchani-Naifer K, Ferid M. Effect of Sm3+ concentration and excitation wavelength on spectroscopic properties of GdPO4: Sm3+ phosphor J[J]. Alloy. Compd., 2021, 885: 161178. doi: 10.1016/j.jallcom.2021.161178
Li H H, Gong X H, Chen Y J, Huang J H, Lin Y F, Luo Z D, Huang Y D. Luminescence properties of phosphate phosphors Ba3Gd1-x(PO4)3:xSm3+[J]. J. Rare Earths, 2018, 36(5): 456-460. doi: 10.1016/j.jre.2017.09.014
Han L, Xu D H, Xu Q G, Di Q M, Su J Y. Synthesis and luminescence properties of Sr3GdNa(PO4)3F: Sm3+ phosphor[J]. J. Mater. Sci., 2015, 50(5): 2257-2262. doi: 10.1007/s10853-014-8788-9
Hu Y, Li X X, Wang X, Li Y Q, Li T Y, Kang H X, Zhang H W, Yang Y M. Greatly enhanced persistent luminescence of YPO4:Sm3+ phosphors via Tb3+ incorporation for in vivo imaging[J]. Opt. Express, 2020, 28(2): 2649-2660. doi: 10.1364/OE.384678
Na ir, G B, Dhoble S J. Orange light-emitting Ca3Mg3(PO4)4:Sm3+ phosphors[J]. Luminescence, 2017, 32(1): 125-128. doi: 10.1002/bio.3194
Zou J F, Zhu Q, Li J G. Lactic-acid enhanced solvothermal crystallization, color-tunable photoluminescence, and thermal stability of h-LaPO4:Ce3+, Tb3+, Sm3+ nanocrystals[J]. CrystEngComm, 2020, 22(25): 4289-4300. doi: 10.1039/D0CE00491J
Wu J X, Jia H J, Li M, Jia H L, Liu Z G. Influence of pH on nanophosphor YPO4:2%Sm3+ and luminescent properties[J]. Appl. Phys. A-Mater., 2020, 126(87): 1-8.
Wu J X, Li M, Jia H L, Liu Z G, Jia H J, Wang Z Z. Morphology formation mechanism and fluorescence properties of nano-phosphor YPO4:Sm3+ excited by near-ultraviolet light[J]. J. Alloy. Compd., 2020, 821: 153535. doi: 10.1016/j.jallcom.2019.153535
Zou X, He L H, Tan D H, Lei F Y, Jiang N, Zheng Q, Lin D M, Xu C G, Liu Y F. Anneal-induced transformation of phase structure, morphology and luminescence of GdPO4: Sm3+ nanomaterials synthesized by a hydrothermal method[J]. Dalton Ttans., 2017, 46(9): 2948-2956. doi: 10.1039/C6DT04583A
刘丛林, 吴锦绣, 贾慧灵, 柳召刚, 胡艳宏, 王昕, 齐源昊, 王忠志. 荧光纳米材料YPO4:Sm3+@YPO4@聚乙二醇的构筑及其荧光性能[J]. 无机化学学报, 2022,38,(7): 1272-1282. LIU C L, WU J X, JIA H L, LIU Z G, HU Y H, WANG X, QI Y H, WANG Z Z. Construction and fluorescence properties of fluorescent nanomaterials YPO4:Sm3+@YPO4@polyethylene glycol[J]. Chinese J. Inorg. Chem., 2022, 38(7): 1272-1282.
Zhang Z X, Zhang Y P, Feng Z G, Wang C, Xia A H P, Zhang X M. Luminescent properties of Ce3+/Tb3+ co-doped glass ceramics containing YPO4 nanocrystals for W-LEDs[J]. J. Rare Earths, 2016, 34(5): 464-469. doi: 10.1016/S1002-0721(16)60050-9
Zhang L, Dong B H, Wang G H, Gao R J, Su G, Wang W, Cao L X. Controllable synthesis and luminescent properties of rare earth doped Gd2(MoO4)3 nanoplates[J]. Colloids Surf. A, 2017, 504: 134-139.
Halappa P, Mathur A, Marie-Helene D, Shivakumara C. Alkali metal ion Co-doped Eu3+ activated GdPO4 phosphors: Structure and photoluminescence properties[J]. J. Alloy. Compd., 2018, 40: 1086-1098.
杨伟斌, 熊飞兵, 杨寅, 周琼, 谢岚驰, 凌爽, 罗新. 低热猝灭新型Sr3Ga2Ge4O14:Sm3+橙红色荧光粉[J]. 发光学报, 2022,43,(6): 879-890. YANG W B, XIONG F B, YANG Y, ZHOU Q, XIE L C, LING S, LUO X. Low thermal quenching novel Sr3Ga2Ge4O14:Sm3+ orange-red phosphor[J]. Chinese Journal of Luminescence, 2022, 43(6): 879-890.
Cho J, Kim C H. Solid -state phase transformation mechanism from hexagonal GdPO4: Eu3+ nanorods to monoclinic nanoparticles[J]. RSC Adv., 2014, 4: 31385-31392. doi: 10.1039/C4RA03229B
Liu Y S, Luo W Q, Zhu H M, Chen X Y. Optical spectroscopy of lanthanides doped in wide band-gap semiconductor nanocrystals[J]. Luminescence, 2011, 131: 415-422. doi: 10.1016/j.jlumin.2010.07.018
Yang Z P, Yue H A, Song Y C, Zhao Y H, Liu P F. Synthesis and luminescence properties of a novel red Sr3Bi(PO4)3:Sm3+ phosphor[J]. J. Rare Earths, 2012, 30(12): 1199-1202. doi: 10.1016/S1002-0721(12)60205-1
Ma B, Liu B X. Luminescence properties and crystal structure of Sr3Sc(PO4)3:Sm3+ as novel orange-red emitting phosphors[J]. J. Lumin., 2017, 188: 54-59. doi: 10.1016/j.jlumin.2017.04.012
Yang F, Liu Y F, Tian X D, Dong G Y, Yu Q M. Luminescence properties of phosphate phosphor Ba3Y(PO4)3:Sm3+[J]. Solid State Sci., 2015, 225: 19-23. doi: 10.1016/j.jssc.2014.11.025
Gupta I, Singh S, Bhagwan S, Singh D. Rare earth (RE) doped phosphors and their emerging applications: A review[J]. Ceram. Int., 2021, 47(14): 19282-19303. doi: 10.1016/j.ceramint.2021.03.308
Kumar G A, Balli N R, Kailasnath M, Mimun L C, Dannangoda C, Martirosyan K S, Santhosh C, Sardar D K. Spectroscopic and magnetic properties of neodymium doped in GdPO4 sub-micron-stars prepared by solvothermal method[J]. J. Alloy. Compd., 2016, 672: 668-673. doi: 10.1016/j.jallcom.2016.02.165
Yawalkar M M, Zade G D, Singh V, Dhoble S J. Investigation of luminescence processes in Li6Gd(BO3)3: Eu3+ phosphor[J]. J. Mater. Sci.-Mater. Electron., 2017, 28(1): 180-189. doi: 10.1007/s10854-016-5509-y
Li L, Tang X H, Jiang Z Q, Zhou X J, Jiang S, Luo X B, Xiang G T, Zhou K N. NaBaLa2(PO4)3:A novel host lattice for Sm3+-doped phosphor materials emitting red dish-orange light[J]. J. Alloy. Compd., 2017, 701: 515-523. doi: 10.1016/j.jallcom.2017.01.171
石彩文, 汲长艳, 曾婷, 黄志, 田修营, 彭秧锡. 高色纯度高热稳定性红色荧光粉Sr3La2Ge3O12:Sm3+的合成及其性能[J]. 无机化学学报, 2020,36,(5): 901-907. SHI C W, JI C Y, ZENG T, HUANG Z, TIAN X Y, PENG Y X. Synthesis and properties of red phosphor La2Ge3O12:Sm3+ with high color purity and thermal stability[J]. Chinese J. Inorg. Chem, 2020, 36(5): 901-907.
Priya R, Pandey O P, Dhoble S J. Review on the synthesis, structural and photo-physical properties of Gd2O3 phosphors for various luminescent applications[J]. Opt. Laser Technol., 2021, 135: 106663. doi: 10.1016/j.optlastec.2020.106663
Yang J F, Wang X X, Song L, Luo N, Dong J C, Gan S C, Zou L C. Tunable luminescence and energy transfer properties of GdPO4: Tb3+, Eu3+ nanocrystals for warm-white LEDs[J]. Opt. Mater., 2018, 85: 71-78. doi: 10.1016/j.optmat.2018.08.043
Gan Y, Liu W, Zhang W T, Li W J, Huang Y, Qiu K H. Effects of Gd3+ codoping on the enhancement of the luminescent properties of a NaBi(MoO4)2:Eu3+ red-emitting phosphors[J]. J. Alloy. Compd., 2019, 784: 1003-1010. doi: 10.1016/j.jallcom.2019.01.062
南赏瑞, 付振东, 张云霄, 刘桂霞. Tb3+, Sm3+掺杂的YNbO4多色荧光材料的制备及发光性能[J]. 无机化学学报, 2021,37,229-234. doi: 10.11862/CJIC.2021.004NAN S R, FU Z D, ZHANG Y X, LIU G X. Preparation and luminescent properties of Tb3+, Sm3+ doped YNbO4 multicolor fluorescent materials[J]. Chinese J. Inorg. Chem., 2021, 37: 229-234. doi: 10.11862/CJIC.2021.004
Blasse G. Energy transfer between inequivalent Eu2+ ions[J]. Solid State Sci., 1986, 62: 207. doi: 10.1016/0022-4596(86)90233-1
Dexter D L. A theory of sensitized luminescence in solids[J]. J. Chem. Phys., 1952, 11: 835-855.
吴锦绣. 三价钐离子掺杂的橙红色发光材料及生物应用. 北京: 北京科技大学, 2020: 101-114WU J X. Orange-red luminescent materials doped with trivalent samarium ions and their biological applications. Beijing: University of Science and Technology Beijing, 2020: 101-114
Guo H, Devakumar B, Li B, Huang X. Novel Na3Sc2(PO4)3:Ce3+, Tb3+ phos-phors for white LEDs: Tunable blue-green color emission, high quantum efficiency and excellent thermal stability[J]. Dyes Pigment., 2018, 151: 81-88. doi: 10.1016/j.dyepig.2017.12.051
Shi P, Xia Z, Molokeev M S, Atuchin V. Crystal chemistry and luminescence properties of red-emitting CsGd1-xEux(MoO4)2 solid-solution phosphors[J]. Dalton Trans., 2014, 43(25): 9669-9676. doi: 10.1039/C4DT00339J
Li B, Huang X Y, Guo H, Zen Y J. Energy transfer and tunable photoluminescence of LaBWO6:Tb3+, Eu3+ phosphors for near-UV white LEDs[J]. Dyes Pigment., 2018, 150: 67-72. doi: 10.1016/j.dyepig.2017.11.003
Yang M, You H P, Ling Y L, Xu J Z, Lu F, Dai L M, Liu Y. Morphology controllable and highly luminescent monoclinic LaPO4:Eu3+ microspheres[J]. J. Alloy. Compd., 2014, 582: 603-608. doi: 10.1016/j.jallcom.2013.08.091
Guo H, Devakumar D, Li B, Huang X Y. Novel Na3Sc2(PO4)3:Ce3+, Tb3+ phosphors for white LEDs: Tunable blue-green color emission, high quantum efficiency and excellent thermal stability[J]. Dyes Pigm., 2018, 151: 81-88.
Li S X, Wang L, Zhu Q Q, Tang D M, Liu X J, Cheng G F, Lu L, Takeda T, Hirosaki N, Huang Z R, Xie R J. Crystal structure, tunable emission and applications of Ca1-xAl1-xSi1+xN3-xOx: RE (x=0-0[J]. 22, RE=Ce3+, Eu2+) solid solution phosphors for white light-emit- ting diodes. J. Mater. Che. C, 2016, 4(47): 11219-11230.
Sarkar B J, Bandyopadhyay A, Mandal J, Deb A K, Chakrabarti P, Chakrabarti K. Paramagnetic to ferromagnetic phase transition of codoped Gd2O3 prepared by chemical route[J]. J. Alloy. Compd., 2016, 656: 339-346.
Hu F F, Wei X T, Qin Y G, Jiang S, Li X Y, Zhou S S, Chen Y H, Duan C K, Yin M. Yb3+/Tb3+ co-doped GdPO4 transparent magnetic glass-ceramics for spectral conversion[J]. J. Alloy. Compd., 2016, 674: 162-167.
Janulevicius M, Klimkevičius V, Mikoliunaite L, Vengalis B, Vargalis R, Sakirzanov1 S, Plausinaitiene V, Zilinskas A, Arturas K. Ultralight magnetic nanofibrous GdPO4 aeroge[J]. ACS Omega, 2020, 5(23): 14180-14185.

Figure 1 XRD patterns of the precursor GdPO4·H2O∶2%Sm3+ (a) and GdPO4∶2%Sm3+ obtained by calcination at different temperatures (b)

Figure 3 SEM images of the precursor GdPO4·H2O∶2%Sm3+ and GdPO4∶2%Sm3+ obtained by calcination at different temperatures

Figure 4 Excitation (a) and emission (b, c) spectra of the precursor GdPO4·H2O∶2%Sm3+ and GdPO4∶2%Sm3+ obtained by calcination at different temperatures

Figure 5 Color coordinates of precursor and GdPO4∶2%Sm3+ obtained by calcination at different temperatures

Figure 6 Phosphorescence lifetimes of the precursor and GdPO 4∶2%Sm3+ obtained by calcination at different temperatures Fig. 7 XRD patterns of GdPO4∶Sm3+ doped with 0%-10% S
Ch is the fitting coefficient

Figure 8 (a-e) SEM images of GdPO4∶Sm3+ doped with 0%-10% Sm3+ and (f) EDS spectrum of GdPO4∶2%Sm3+

Figure 14 (a) Emission spectra of GdPO4·H2O∶2%Sm3+ at different temperatures and (b) the relationshipbetween temperature and luminescence intensity at 599 nm

Figure 15 (a) Emission spectra and (b) luminescence intensities at 599 nm of GdPO4∶2%Sm3+ at different temperatures; (c) Relationship between ln[(I0/I)-1] and 1/(kT)

 扫一扫看文章

扫一扫关注我们
 下载:
下载:
 下载:
下载:


 下载:
下载: