Table 1.
Crystal data and structure refinement parameters for complexes 1 and 2
Citation:
Xuan WANG, Ji-Jiang WANG, Long TANG, Yi-Dan ZHENG, Xin ZHANG, Er-Lin YUE, Chao BAI, Yu-Qi ZHANG. Synthesis, structures, magnetic and fluorescent sensing properties of 1D Co(Ⅱ)/Ni(Ⅱ) coordination polymers[J]. Chinese Journal of Inorganic Chemistry,
2023, 39(3): 545-553.
doi:
10.11862/CJIC.2023.020

一维钴(Ⅱ)/镍(Ⅱ)配位聚合物的合成、结构、磁性及荧光传感性质
摘要:
采用水热法合成了2个新的配位聚合物[Co(L)0.5(1,4-bib)(H2O)3]n(1)和[Ni(L)0.5(1,4-bib)(H2O)3]n(2)(H4L=1,4-二(2,6-二甲基-3,5-二羧基吡啶基)苯,1,4-bib=1,4-双(1-咪唑基)苯),通过X射线单晶及粉末衍射、元素分析、红外光谱分析和热重分析对其结构进行表征。结构分析表明配合物1和2为异质同构,均为一维结构。通过变温磁化率测量发现,配合物1和2中的Co(Ⅱ)/Ni(Ⅱ)离子之间存在反铁磁相互作用。此外,配合物1可通过荧光猝灭法检测头孢克肟(CEF),配合物2可用来检测四环素(TET),该方法灵敏度高、选择性好,其检出限分别为0.86 μmol·L-1(CEF)和0.49 μmol·L-1(TET)。
English
Synthesis, structures, magnetic and fluorescent sensing properties of 1D Co(Ⅱ)/Ni(Ⅱ) coordination polymers
Abstract:
Two new coordination polymers [Co(L)0.5(1, 4-bib)(H2O)3]n (1) and [Ni(L)0.5(1, 4-bib)(H2O)3]n (2) (H4L=1, 4-bis (2, 6-dimethyl-3, 5-dicarboxypyridyl) benzene, 1, 4-bib=1, 4-bis(1-imidazolyl) benzene) were synthesized by hydrothermal method. Their structures were characterized by single crystal and powder X-ray diffraction, elemental analysis, infrared spectroscopic analysis, and thermogravimetric analysis. Structural analysis shows that complexes 1 and 2 are heterogeneous isomorphisms and 1D structures. The antiferromagnetic interaction between Co(Ⅱ)/Ni(Ⅱ) ions in complexes 1 and 2 was found by variable temperature magnetic susceptibility measurement. In addition, complex 1 can be used to detect cefixime (CEF) by fluorescence quenching method, and complex 2 can be used to detect tetra-cycline (TET). This method had high sensitivity and good selectivity, and their detection limits were 0.86 μmol·L-1 (CEF) and 0.49 μmol·L-1 (TET), respectively.
-
Key words:
- coordination polymers
- / Co(Ⅱ)
- / Ni(Ⅱ)
- / magnetism
- / fluorescent sensing
-
Coordination polymers (CPs) are infinite arrays of extended structures in which the inorganic nodes and linkers are connected through coordination bonds. They are"coordination compounds with repeating coordination entitles extending in one, two, or three dimensions (1D, 2D, or 3D)"[1-2]. The areas of CPs have experienced recent exponential growth in research activity. In the last few decades, over 70 000 CPs have been reported in the literature. Due to their novel and diverse structures and unique properties, they have been used in heterogeneous catalysis[3-6], gas storage and separation[7-9], drug delivery[10], sensing[11-12], energy storage[13], and conductivity[14].
The design and synthesis of CPs with specific structures have always been the focus of scientific and technological workers. For a long time, coordination polymer materials based on pyridine carboxylic acid ligands have attracted much attention. This is because pyridine carboxylic acid ligands are a common bifunctional ligand, which combines the advantages of carboxylic acid ligands and nitrogen-containing heterocyclic ligands, and has the active sites of carboxylic acid O atoms and heterocyclic N atoms. More importantly, at different pH values, carboxylic acids will lead to additional coordination modes due to different degrees of protonation. At the same time, the potential pyridine nitrogen atom can be used as a functional center to recognize Lewis acidic metal ions, which has a certain synergistic effect with oxygen atoms when participating in coordination.
Inspired by these ideas, two CPs were constructed with 1, 4-bis(2, 6-dimethyl-3, 5-dicarboxypyridine) benzene (H4L) as the main ligand, 1, 4-bis(1-imidazolyl) benzene (1, 4-bib) as the auxiliary ligand as well as Co(Ⅱ) ion and Ni(Ⅱ) ion. In addition, the magnetic and fluorescent sensing properties of 1 and 2 were studied in detail.
1. Experimental
1.1 Material and methods
All synthetic reagents and solvents employed were commercially available and used directly without further purification. Powder X-ray diffraction (PXRD) patterns were recorded with a Bruker D8 ADVANCE diffractometer operating at 40 kV and 40 mA using Cu Kα radiation (λ=0.154 18 nm) at a scanning rate 2 (°)·min-1 from 5° to 50°. The C, H, and N elemental analyses were conducted with a PerkinElmer PE-2400 elemental analyzer. The FT-IR spectrum (400-4 000 cm-1) was recorded on a Nicolet 170SX FT-IR spectrophotometer. Thermal gravimetric analysis (TGA) was performed with a NETZSCH STA 449F3 thermal gravimetric analyzer in flowing nitrogen at a heating rate of 10 ℃·min-1. In a range of 2-300 K, the magnetic susceptibility data were investigated by using a Quantum Design MPMS SQUID VSM instrument. Fluorescence experiments were carried out on the Hitachi F-7100 Fluorescence Spectrophotometer.
1.2 Synthesis of [Co(L)0.5(1, 4-bib)(H2O)3]n (1)
A mixture of Co(NO3)2·6H2O (29.1 mg, 0.10 mmol), H4L (23.0 mg, 0.05 mmol), 1, 4-bib (10.5 mg, 0.05 mmol), NaOH (14.40 mmol·L-1) and 13 mL H2O was stirred for 30 min and then placed in a 25 mL Teflon-lined stainless-steel vessel, which was heated to 160 ℃ and kept constant for 120 h. Finally, purple block crystals were obtained. Yield: 34% (based on Co). Anal. Calcd. for C24H24N5O7Co(%): C, 52.08; H, 4.37; N, 12.65. Found(%): C, 52.10; H, 4.33; N, 12.56. IR (KBr, cm-1): 3 119 (w), 2 365 (w), 2 345 (w), 1 560 (s), 1 535 (s), 1 352 (w), 1 310 (s), 1 258 (m), 1 121 (m), 1 063 (w), 961 (s), 831 (m), 766 (s), 650 (w), 534 (w), 501 (w).
1.3 Synthesis of [Ni(L)0.5(1, 4-bib)(H2O)3]n (2)
The synthesis method of 2 was the same as that of 1, and only the metal salt was replaced with Ni(NO3)2·6H2O. Finally, green crystals were obtained with a yield of 36% (based on Ni). Anal. Calcd. for C24H24N5O7Ni (%): C, 52.11; H, 4.37; N, 12.65. Found(%): C, 52.14; H, 4.30; N, 12.54. IR (KBr, cm-1): 3 117 (w), 2 365 (w), 2 345 (w), 1 560 (s), 1 533 (s), 1 352 (w), 1 310 (s), 1 258 (m), 1 124 (m), 1 063 (w), 961 (s), 831 (m), 766 (s), 652 (w), 536 (w), 501 (w).
1.4 X-ray crystallographic studies
The crystals with regular shape and moderate size were selected and placed on BRUKER SMART APEX-Ⅱ CCDX ray single crystal diffractometer. The unit cell parameters and diffraction data were measured by ω-2θ scanning with Mo Kα (λ =0.071 073 nm) ray monochromated by graphite monochromator. The diffraction data were corrected by semi-empirical absorption using the SADABS program. By using the SHELXS-97 and SHELXL-97 programs, the structures were solved by direct methods and refined by full-matrix least squares on F2. All non-hydrogen atoms were refined anisotropically. The crystallographic data of complexes 1 and 2 are shown in Table 1. Selected bond lengths and bond angles are listed in Table 2 and 3.
Table 1

 下载:
导出CSV
下载:
导出CSV
Parameter 1 2 Empirical formula C24H24N5O7Co C24H24N5O7Ni Formula weight 553.41 553.19 Crystal system Triclinic Triclinic Space group P1 P1 Temperature/K 293(2) 293(2) a/nm 0.761 51(19) 0.760 89(11) b/nm 1.238 7(3) 1.238 24(19) c/nm 1.395 1(3) 1.396 4(2) α/(°) 107.152(4) 106.430(2) β/(°) 99.896(4) 100.127(2) γ/(°) 105.738(4) 106.240(2) V/nm3 1.164 0(5) 1.164 2(3) Z 2 2 Dc/(g·cm-3) 1.579 1.578 Reflection collected 6 145 6 067 Unique reflection 4 287 4 282 θ range/(°) 1.94-25.50 1.58-25.50 F(000) 572 574 Goodness-of-fit on F2 1.060 1.079 R1, wR2 [I > 2σ(I)]* 0.049 7, 0.138 7 0.050 8, 0.143 8 R1, wR2 (all data) 0.065 7, 0.149 1 0.058 4, 0.151 2 * R1=∑||Fo|-|Fc||/∑|Fo|, wR2={∑[w(Fo2-Fc2)2]/∑w(Fo2)2}1/2. Table 2
Table 2. Selected bond lengths (nm) and bond angles (°) for complex 1下载:
导出CSV
Co1—O1 0.211 2(2) Co1—O6 0.214 4(3) Co1—N2 0.210 8(3) Co1—O5 0.209 8(3) Co1—O7 0.207 4(7) Co1—N5A 0.211 3(3) O7—Co1—O5 94.81(19) O7—Co1—N5A 87.0(2) N2—Co1—O6 90.91(13) O7—Co1—N2 173.91(19) O5—Co1—N5A 92.26(12) O1—Co1—O6 90.35(10) O5—Co1—N2 90.88(12) N2—Co1—N5A 94.97(12) N5A—Co1—O6 90.11(12) Symmetry code: A: x-1, y-1, z. Table 3
Table 3. Selected bond lengths (nm) and bond angles (°) for complex 2下载:
导出CSV
Ni1—O1 0.207 8(2) Ni1—O6 0.206 2(7) Ni1—N2 0.206 3(3) Ni1—O5 0.208 9(3) Ni1—O7 0.211 2(3) Ni1—N5A 0.206 9(3) O6—Ni1—N2 175.0(2) N2—Ni1—O5 91.77(12) O5—Ni1—O7 176.53(11) O6—Ni1—N5A 87.4(2) N5A—Ni1—O5 92.08(12) O6—Ni1—O6A 9.5(3) N2—Ni1—N5A 94.09(12) O1—Ni1—O5 86.18(11) N2—Ni1—O6A 174.25(19) Symmetry code: A: x-1, y-1, z. 2. Results and discussion
2.1 Description of crystal structures
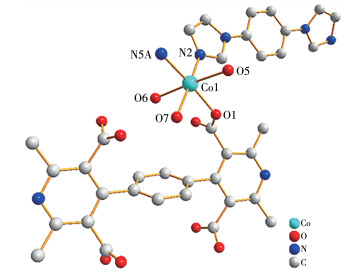
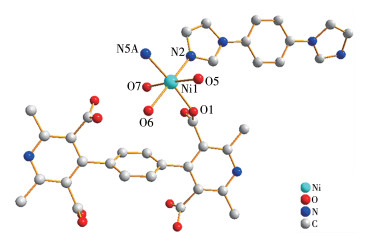
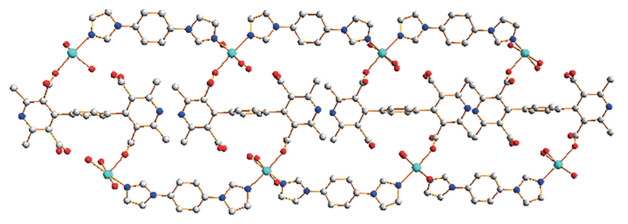
X-ray single crystal diffraction analysis shows that complexes 1 and 2 are heterogeneous isomorphisms, so we only describe the structure of 1. Complex 1 belongs to the triclinic system and P1 space group. The asymmetric unit of complex 1 comprises a Co(Ⅱ) ion, a half L4- ion, one 1, 4-bib molecule, and three coordinated water molecules. As shown in Fig. 1, Co(Ⅱ) ions belong to the six-coordinated mode, O1 from L4-, N2 and N5 from 1, 4-bib and O5, O6, O7 atoms of three H2O molecules. All the Co—O (0.220 6(7)-0.207 4(7) nm) and Co—N (0.210 8(3)-0.211 3(3) nm) bond lengths fall into the normal ranges (Table 2). L4- adopts the bridged coordination mode in complex 1, and the carboxyl group adopts monodentate coordination mode, connecting two Co(Ⅱ) ions. The 1D chain structure is formed by the metal connection of L4- and 1, 4-bib (Fig. 3).
Figure 1
Figure 2
Figure 3
2.2 PXRD analysis
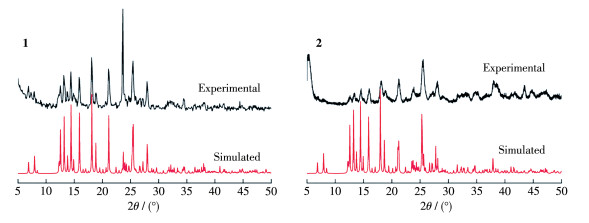
To confirm the purity of complexes 1 and 2, PXRD patterns of complexes 1 and 2 were measured. The experimental and simulated patterns were presented in Fig. 4. The peak positions of complexes 1 and 2 were consistent with those of single crystal structure simulation, indicating that they are pure phases.
Figure 4
2.3 Thermal stability analysis
To determine the thermal stability of complexes 1 and 2, TGA experiments were conducted on the crystal sample. As shown in Fig. 5, the weight loss of complex 1 was about 10.9% due to the loss of three coordination water molecules from room temperature to 246 ℃. When the temperature was increased to 310 ℃, the framework of complex 1 began to decompose. Complex 2 had the same thermal stability as complex 1.
Figure 5
2.4 Magnetic properties
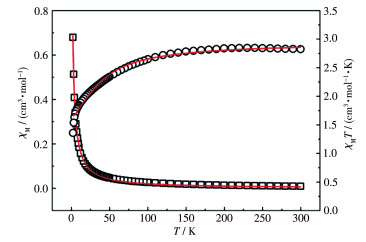
The temperature dependencies of the magnetic susceptibility (χM) of complexes 1 and 2 were measured in a range of 2-300 K under a static field of 10 and 1 kOe, respectively. Fig. 6 shows plots of χM and χMT vs T for complex 1. Here, we refer to the data of the literature[15] to calculate the diamagnetic correction factor (χD) for [Co(L)0.5(1, 4-bib)(H2O)3]:
$ \begin{aligned} \chi_{\mathrm{D}} & =\chi_{\mathrm{D}}\left(\mathrm{Co}^{2+}\right)+\frac{1}{2} \chi_{\mathrm{D}}(\mathrm{L})+\chi_{\mathrm{D}}(1, 4-\mathrm{bib})+3 \chi_{\mathrm{D}}\left(\mathrm{H}_2 \mathrm{O}\right) \\ & =\left[(-12)+\frac{1}{2} \times(-322.14)+(-106.02)+3 \times(-13)\right] \times 10^{-6} \\ & =-3.1809 \times 10^{-4}\left(\mathrm{emu} \cdot \mathrm{mol}^{-1}\right) \end{aligned} $ Figure 6
 Figure 6. Plots of χM and χMT vs T for complex 1
The red lines represent the fitted curve
The χM of complex 1 was determined by equation (χM=χmeas-χD), where χmeas is the measured magnetic susceptibility.
For 1, As the temperature decreased, the value of χMT decreased slowly. The value of χMT decreased from 2.921 4 cm3·mol-1·K at 300 K to 1.359 cm3·mol-1·K at 2 K. The experimental value of one Co(Ⅱ) ion at room temperature was 2.921 4 cm3·K·mol-1, which was larger than that calculated for the spin-only case (1.875 cm3·mol-1·K), revealing a significant orbital contribution. The 1/χM vs T plot was linear, and the least-squares fitting of the data to the Curie-Weiss law gave C=2.928 cm3·mol-1·K and θ=-8.917 K. The negative value of θ may be attributed to antiferromagnetic interactions between Co(Ⅱ) ions. Assuming an isotropic exchange between Co(Ⅱ) ions, the magnetic susceptibility of one Co(Ⅱ) ion can be expressed as[16]:
$ \chi_{\mathrm{M}}^J=\frac{N \beta^2 g^2 S(S+1)}{3 k T} \times \frac{1+u}{1-u} $ $ u=\operatorname{coth}\left[\frac{J S(S+1)}{k T}\right]-\frac{k T}{J S(S+1)} $ The best fit (N, β, and g have their usual meanings) of the experimental data to the equation yielded J=-3.47 cm-1, g=2.22, with an agreement factor R=∑(χobsd-χcacld)2/∑ χobsd2=3.21×10⁻⁴. It seems that the spin-only model gave quite a good fit.
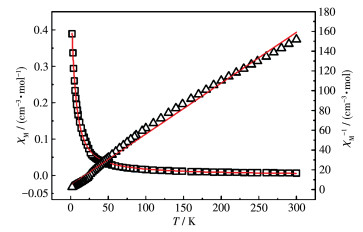
Fig. 7 shows plots of χM and 1/χM vs T for complex 2. As we can see, it was very difficult to get a suitable theoretical model to fit this system. Fortunately, the given plot of 1/χM vs T showed a straight line down to 2 K, which suggests that it can be fit approximately by the Curie-Weiss law. The relationship between reciprocal susceptibility and T obeys the Curie-Weiss Law with C=1.943 cm3·mol-1·K and θ=-9.236 K, demonstrating the antiferromagnetic interaction between Ni(Ⅱ) ions.
Figure 7
 Figure 7. Plots of χM and 1/χM vs T for complex 2
The red lines represent the fitted curve
2.5 Fluorescent sensing properties
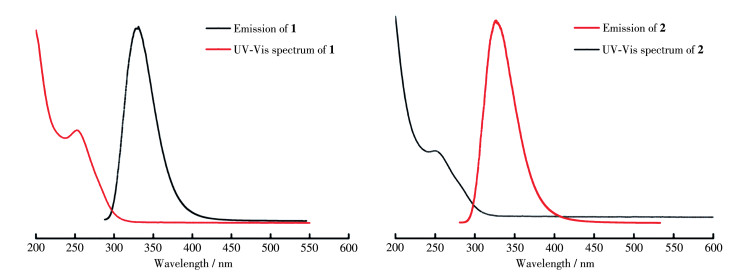
As shown in Fig. 8, the UV-Vis absorption spectra of complexes 1 and 2 in a range of 250-600 nm were determined. The maximum absorption peak of complexes 1 and 2 was at 250 and 252 nm, respectively. We took them as the optimal excitation wavelength to find the maximum emission wavelength repeatedly. Finally, complexes 1 and 2 exhibited the maximum emission at 330 nm.
Figure 8
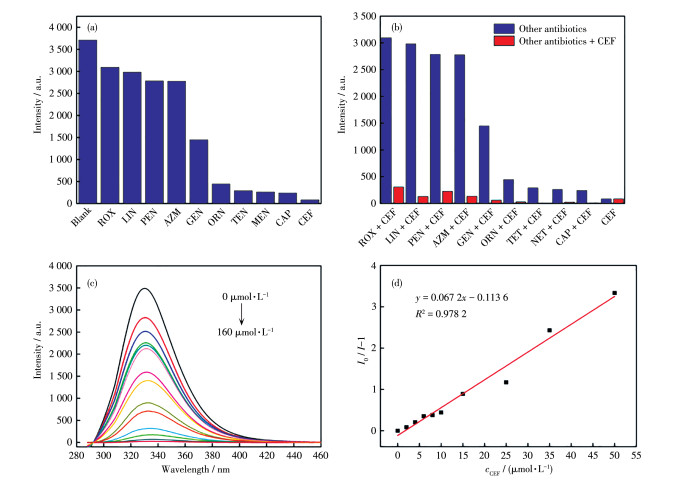
Due to the abuse of antibiotics, the water system and the environment have caused great pollution. Therefore, it is very urgent to find a simple and efficient method to detect antibiotics[17]. A variety of antibiotics including lincomycin hydrochloride (LIN), metronidazole (MDZ), ornidazole (ODZ), tetracycline (TET), roxithromycin (ROX), chloramphenicol (CAP), gentamicin sulfate (GEN), azithromycin (AZM), cefixime (CEF) and penicillin sodium (PEN) was selected to evaluate the sensing ability of 1. As shown in Fig. 9a, the maximum quenching was caused by CEF. The anti-interference experiments were carried out to investigate the selectivity of CEF to other antibiotics. In the absence of CEF, the fluorescence intensity of other antibiotics decreased slightly, but the fluorescence intensity was greatly quenched when CEF was added to the above solution (Fig. 9b). Then the concentration gradient experiment was performed. When the concentration of CEF increased, the intensity of 1 gradually decreased (Fig. 9c). The I0/I-1 value was almost linearly related to the low concentration of CEF (Fig. 9d).
Figure 9
 Figure 9. (a) Fluorescence intensities of different antibiotics added to the suspension of 1; (b) Luminescence intensity of 1 with the addition of CEF to different antibiotics; (c) Emission spectra of 1 in the presence of CEF with different concentrations; (d) Linear relationship of I0/I-1 with CEF concentration for the detection of CEF by 1
At the same time, we also carried out antibiotics tests for complex 2. As shown in Fig. 10a, the maximum quenching was caused by TET. The anti-interference experiments were carried out to investigate the selectivity of TET to other antibiotics. In the absence of TET, the fluorescence intensity of other antibiotics decreased slightly, but the fluorescence intensity was greatly quenched when TET was added to the above solution (Fig. 10b). In addition, the quenching effect of 2 on the concentration of TET in a range of 0-250 μmol·L-1 was also studied. With the increase of TET concentration, the intensity of 2 gradually decreased (Fig. 10c), I0/I-1 value was also linearly correlated with low concentration TET (Fig. 10d). The detection limit was calculated using 3σ/k (σ: standard deviation, k: slope) and the detection limit for 1 towards CEF was 0.86 μmol·L-1 and for 2 towards TET was 0.49 μmol·L-1.
Figure 10
 Figure 10. (a) Fluorescence intensities of different antibiotics added to the suspension of 2; (b) Luminescence intensity of 2 with the addition of TET to different antibiotics; (c) Emission spectra of 2 in the presence of TET with different concentrations; (d) Linear relationship of I0/I-1 with TET concentration for the detection of TET by 2
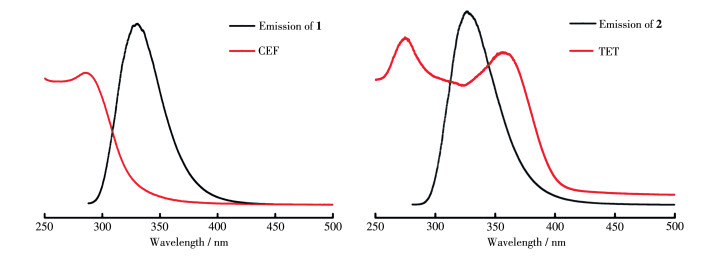
To explain the fluorescence quenching effect of CEF and TET on complexes 1 and 2 respectively, the UV-Vis absorption spectra of antibiotics were recorded. The UV-Vis absorption of CEF partially overlapped with the emission spectrum of 1. TET exhibited absorption in a range of 300-400 nm, which overlapped the emission spectrum of 2. This means that the fluorescence quenching of 1 and 2 should be caused by energy competition and absorption.
Figure 11
3. Conclusions
In summary, two novel Co(Ⅱ)/Ni(Ⅱ) coordination polymers based on a main pyrazole carboxylic acid ligand (H4L) and an auxiliary N-donor ligand (1, 4-bib) were successfully synthesized according to the hydrothermal method. Structural analysis shows that complexes 1 and 2 are heterogeneous isomorphisms and 1D structures. Magnetic studies reveal that there is an antiferromagnetic interaction between Co(Ⅱ)/Ni(Ⅱ) ions in complexes 1 and 2. In addition, 1 and 2 can also detect cefixime and tetracycline by fluorescence quenching, respectively.
Conflicts of interest: The authors declare no competing financial interest.
-
-
[1]
Batten S R, Champness N R, Chen X M, Garcia-Martinez J, Kitagawa S, Öhrström L, O'Keeffe M, Suh M P, Reedijk J. Coordination polymers, metal-organic frameworks and the need for terminology guidelines[J]. CrystEngComm, 2012, 14: 3001-3004. doi: 10.1039/c2ce06488j
-
[2]
Batten S R, Champness N R, Chen X M, Garcia-Martinez J, Kitagawa S, Öhrström L, O'Keeffe M, Suh M P, Reedijk J. Terminology of metal-organic frameworks and coordination polymers (IUPAC Recommendations 2013)[J]. Pure Appl. Chem., 2013, 85: 1715-1724. doi: 10.1351/PAC-REC-12-11-20
-
[3]
Liang Q N, Chen J M, Wang F L, Li Y W. Transition metal-based metal-organic frameworks for oxygen evolution reaction[J]. Coord. Chem. Rev., 2020, 424: 213488. doi: 10.1016/j.ccr.2020.213488
-
[4]
Sakamoto N, Nishimura Y F, Nonaka T, Ohashi M, Ishida N, Kitazumi K, Kato Y, Sekizawa K, Morikawa T, Arai T. Self-assembled cuprous coordination polymer as a catalyst for CO2 electrochemical reduction into C2 products[J]. ACS Catal., 2020, 10(18): 10412-10419. doi: 10.1021/acscatal.0c01593
-
[5]
Woldu A R, Huang Z L, Zhao P X, Hu L S, Astruc D. Electrochemical CO2 reduction (CO2RR) to multi-carbon products over copper-based catalysts[J]. Coord. Chem. Rev., 2022, 454: 214340. doi: 10.1016/j.ccr.2021.214340
-
[6]
Zhou Y T, Abazari R, Chen J, Tahir M, Kumar A, Ikreedeegh R R, Rani E, Singh H, Kirillov A M. Bimetallic metal-organic frameworks and MOF-derived composites: Recent progress on electro and photoelectrocatalytic applications[J]. Coord. Chem. Rev., 2022, 451: 214264. doi: 10.1016/j.ccr.2021.214264
-
[7]
Lin J B, Zhang J P, Chen X M. Nonclassical active site for enhanced gas sorption in porous coordination polymer[J]. J. Am. Chem. Soc., 2010, 132: 6654-6656. doi: 10.1021/ja1009635
-
[8]
Duan J G, Jin W Q, Kitagawa S. Water-resistant porous coordination polymers for gas separation[J]. Coord. Chem. Rev., 2017, 332: 48-74. doi: 10.1016/j.ccr.2016.11.004
-
[9]
Duan J G, Higuchi M, Krishna R, Kiyonaga T, Tsutsumi Y, Sato Y, Kubota Y, Takata M, Kitagawa S. High CO2/N2/O2/CO separation in a chemically robust porous coordination polymer with low binding energy[J]. Chem. Sci., 2014, 5: 660-666. doi: 10.1039/C3SC52177J
-
[10]
Imaz I, Rubio-Martinez M, Garcia-Fernandez L, Garcia F, Ruiz-Molina D, Hernando J, Puntes V, Maspoch D. Coordination polymer particles as potential drug delivery systems[J]. Chem. Commun., 2010, 46: 4737-4739. doi: 10.1039/c003084h
-
[11]
Dutta B, Hazra A, Dey A, Sinha C, Ray P P, Banerjee P, Mir M H. Construction of a succinate-bridged Cd(Ⅱ)-based two-dimensional coordination polymer for efficient optoelectronic device fabrication and explosive sensing application[J]. Cryst. Growth Des., 2020, 20(2): 765-776. doi: 10.1021/acs.cgd.9b01181
-
[12]
Wen T, Zhang D X, Liu J, Lin R, Zhang J. A multifunctional helical Cu coordination polymer with mechanochromic, sensing and photocatalytic properties[J]. Chem. Commun., 2013, 49: 5660-5662. doi: 10.1039/c3cc42241k
-
[13]
Luo X Z, Abazari R, Tahir M, Fan W K, Kumar A, Kalhorizadeh T, Kirillov A M, Amani-Ghadim A R, Chen J, Zhou Y T. Trimetallic metal-organic frameworks and derived materials for environmental remediation and electrochemical energy storage and conversion[J]. Coord. Chem. Rev., 2022, 461: 214505. doi: 10.1016/j.ccr.2022.214505
-
[14]
Horike S, Umeyama D, Kitagawa S. Ion conductivity and transport by porous coordination polymers and metal-organic frameworks[J]. Acc. Chem. Res., 2013, 46(11): 2376-2384. doi: 10.1021/ar300291s
-
[15]
Bain G A, Berry J F. Diamagnetic corrections and Pascal's constant[J]. J. Chem. Educ., 2008, 85(4): 532. doi: 10.1021/ed085p532
-
[16]
Wu B L, Yuan D Q, Jiang F L, Han L, Lou B Y, Liu C P, Hong M C. Effect of conformation and combination of 1, 3-bis(4-pyridylthio) propan-2-one upon coordination architectures: Syntheses, characterizations and properties[J]. Eur. J. Inorg. Chem., 2005, (7): 1303-1311.
-
[17]
Wang L B, Wang J J, Yue E L, Li J F, Tang L, Bai C, Wang X, Hou X Y, Zhang Y Q. Information encryption, highly sensitive detection of nitrobenzene, tetracycline based on a stable luminescent Cd-MOF[J]. Spectroc. Acta Pt. A—Molec. Biomolec. Spectr., 2022, 269: 120752. doi: 10.1016/j.saa.2021.120752
-
[1]
-
Figure 6 Plots of χM and χMT vs T for complex 1
The red lines represent the fitted curve
Figure 7 Plots of χM and 1/χM vs T for complex 2
The red lines represent the fitted curve
Figure 9 (a) Fluorescence intensities of different antibiotics added to the suspension of 1; (b) Luminescence intensity of 1 with the addition of CEF to different antibiotics; (c) Emission spectra of 1 in the presence of CEF with different concentrations; (d) Linear relationship of I0/I-1 with CEF concentration for the detection of CEF by 1
Figure 10 (a) Fluorescence intensities of different antibiotics added to the suspension of 2; (b) Luminescence intensity of 2 with the addition of TET to different antibiotics; (c) Emission spectra of 2 in the presence of TET with different concentrations; (d) Linear relationship of I0/I-1 with TET concentration for the detection of TET by 2
Table 1. Crystal data and structure refinement parameters for complexes 1 and 2
Parameter 1 2 Empirical formula C24H24N5O7Co C24H24N5O7Ni Formula weight 553.41 553.19 Crystal system Triclinic Triclinic Space group P1 P1 Temperature/K 293(2) 293(2) a/nm 0.761 51(19) 0.760 89(11) b/nm 1.238 7(3) 1.238 24(19) c/nm 1.395 1(3) 1.396 4(2) α/(°) 107.152(4) 106.430(2) β/(°) 99.896(4) 100.127(2) γ/(°) 105.738(4) 106.240(2) V/nm3 1.164 0(5) 1.164 2(3) Z 2 2 Dc/(g·cm-3) 1.579 1.578 Reflection collected 6 145 6 067 Unique reflection 4 287 4 282 θ range/(°) 1.94-25.50 1.58-25.50 F(000) 572 574 Goodness-of-fit on F2 1.060 1.079 R1, wR2 [I > 2σ(I)]* 0.049 7, 0.138 7 0.050 8, 0.143 8 R1, wR2 (all data) 0.065 7, 0.149 1 0.058 4, 0.151 2 * R1=∑||Fo|-|Fc||/∑|Fo|, wR2={∑[w(Fo2-Fc2)2]/∑w(Fo2)2}1/2.  下载: 导出CSV
Table 2. Selected bond lengths (nm) and bond angles (°) for complex 1
Co1—O1 0.211 2(2) Co1—O6 0.214 4(3) Co1—N2 0.210 8(3) Co1—O5 0.209 8(3) Co1—O7 0.207 4(7) Co1—N5A 0.211 3(3) O7—Co1—O5 94.81(19) O7—Co1—N5A 87.0(2) N2—Co1—O6 90.91(13) O7—Co1—N2 173.91(19) O5—Co1—N5A 92.26(12) O1—Co1—O6 90.35(10) O5—Co1—N2 90.88(12) N2—Co1—N5A 94.97(12) N5A—Co1—O6 90.11(12) Symmetry code: A: x-1, y-1, z.
下载: 导出CSV
Table 3. Selected bond lengths (nm) and bond angles (°) for complex 2
Ni1—O1 0.207 8(2) Ni1—O6 0.206 2(7) Ni1—N2 0.206 3(3) Ni1—O5 0.208 9(3) Ni1—O7 0.211 2(3) Ni1—N5A 0.206 9(3) O6—Ni1—N2 175.0(2) N2—Ni1—O5 91.77(12) O5—Ni1—O7 176.53(11) O6—Ni1—N5A 87.4(2) N5A—Ni1—O5 92.08(12) O6—Ni1—O6A 9.5(3) N2—Ni1—N5A 94.09(12) O1—Ni1—O5 86.18(11) N2—Ni1—O6A 174.25(19) Symmetry code: A: x-1, y-1, z.
下载: 导出CSV
-


 扫一扫看文章
计量
- PDF下载量: 4
- 文章访问数: 992
- HTML全文浏览量: 76
 下载:
下载:
