Table 1.
Crystal data and structure refinement parameters for MOF 1
Citation:
Xiao-Li CHEN, Lu LIU, Lu SHANG, Miao CAI, Hua-Li CUI, Hua YANG, Ji-Jiang WANG. A Highly Sensitive and Multi-responsive Zn-MOF Fluorescent Sensor for Detection of Fe3+, 2, 4, 6-Trinitrophenol, and Ornidazole[J]. Chinese Journal of Inorganic Chemistry,
2022, 38(4): 735-744.
doi:
10.11862/CJIC.2022.063

一种高灵敏、多响应的Zn-MOF荧光传感器对Fe3+、2,4,6-三硝基苯酚和奥硝唑的检测
摘要:
在水热条件下基于H4bta(1,2,3,5-苯四酸)和bpy(4,4′-联吡啶)配体设计、合成了一个锌的金属有机骨架(Zn-MOF) {[Zn2(bta)(bpy)(H2O)2]·H2O}n (1),并用元素分析、红外光谱、X射线单晶衍射等对其进行了结构表征。MOF 1为三维网状结构。完全去质子化的(bta)4-配体采用了μ6-η1-η2-η2-η1螯合桥联配位方式。有意思的是,MOF 1是一种高灵敏度、选择性好、多响应的荧光传感器,可用于Fe3+、2,4,6-三硝基苯酚和奥硝唑的快速检测。此外还研究了1的热稳定性。
-
关键词:
- 1, 2, 3, 5-苯四酸
- / 晶体结构
- / 荧光传感器
English
A Highly Sensitive and Multi-responsive Zn-MOF Fluorescent Sensor for Detection of Fe3+, 2, 4, 6-Trinitrophenol, and Ornidazole
Abstract:
A Zinc metal-organic framework (Zn-MOF) based on H4bta (1, 2, 3, 5-benzene tetracarboxylic acid) and bpy (4, 4′- dipyridine) ligands, namely {[Zn2(bta) (bpy) (H2O)2]·H2O}n (1), have been hydrothermally synthesized and structurally characterized by elemental analysis, IR spectroscopy, and single-crystal X-ray diffraction analysis. MOF 1 shows a 3D network structure. The completely deprotonated (bta)4- ligand adopts a μ6 -η1 -η2 -η2 -η1 chelating and bridging coordination mode. Interestingly, 1 is a high sensitivity, good selectivity, and multi-response fluorescence sensor, which can be used for detection of Fe3+, 2, 4, 6-trinitrophenol, and ornidazole. In addition, the thermal stability of 1 was also studied.
-
0. Introduction
In recent years, with the rapid development of industry, agriculture, and society, the discharge of heavy metal ions, small organic molecules, explosive molecules, antibiotics, and other toxic substances has increased greatly, resulting in more and more serious water pollution[1-4]. Therefore, the highly efficient and sensitive detection of pollutants in water resources is an extremely urgent problem, which has been paid much attention by scientists[5-7]. So the research on the luminescence properties of metal - organic frameworks (MOFs) has always been the focus of scientists. Due to the diversity of MOFs structure motifs and luminescence properties, it has the advantages of high sensitivity, excellent selectivity, and simple operation in the field of fluorescence detection. It can not only be used as a luminescent material, but also can be used to detect specific metal ions, small organic molecules, antibiotics, and nitroaromatic compounds (NACs) [8-10]. Up till now, a large number of MOFs have been successfully used for the sensing of small organic molecules[11-15] and ions (Fe3+, Al3+, Zn2+, Cu2+, Ag+, F-, Cr2O72-, etc.) [16-19]. However, most fluorescent sensors typically respond to a single or few signals[20-21]. If fluorescence sensors can respond to different analytes, they can perform well in complex objects, multidimensional storage materials, and multiple sensors. So, the design of multiresponsive fluorescence sensors becomes an urgent challenge.
1, 2, 3, 5-Benzene tetracarboxylic acid (H4bta) has four carboxyl groups with eight potential donor atoms, so it can construct various structures with different topologies and dimensions constructed from different directions. In addition, it contains four carboxyl groups that can be completely or partially deprotonated, providing hydrogen bond donors and acceptors, making it ideal candidate for building supramolecular networks based on the degree of deprotonation of carboxyl groups. Therefore, it may be an ideal choice for building multi - dimensional MOFs. Although many MOFs were constructed based on H4 bta ligand, the design of MOF as fluorescence sensor based on H4bta ligand remains a huge challenge. Therefore, it is necessary for exploring the coordination chemistry and fluorescence sensing of H4bta ligand. Inspired by these ideas, we have synthesized a Zn - MOF, {[Zn2(bta) (bpy) (H2O)2]·H2O}n (1, bpy=4, 4′-dipyridine). Herein we describe its synthesis, structure, and thermal stability, and it can be used as a fluorescence sensor.
1. Experimental
1.1 Reagents and physical measurements
All reagents were available from commercial sources without purifying treatment. All reactions were performed under hydrothermal conditions. Elemental analyses (C, H, N) were performed with an Elementar Vario EL Ⅲ elemental analyzer. FT - IR spectrum was recorded on a Bruker EQUINOX55 spectrophotometer in the 4 000-400 cm-1 region using KBr pellet. The fluorescence spectra were performed on a Hitachi F-7100 luminescent spectrophotometer. Thermogravimetric analysis (TGA) was performed in a nitrogen atmosphere with a heating rate of 10 ℃·min-1 with a NETZSCHSTA 449C thermogravimetric analyzer. The powder X - ray diffraction (PXRD) pattern was recorded with a Rigaku D/Max Ⅲ diffractometer operating at 40 kV and 30 mA using Cu Kα radiation (λ =0.154 18 nm) at a scanning rate of 2 (°)·min-1 from 5° to 50°.
1.2 Synthesis of {[Zn2(bta)(bpy)(H2O)2]·H2O}n (1)
A mixture of Zn(NO3)2·6H2O (29.7 mg, 0.1 mmol), H4bta (12.6 mg, 0.05 mmol), bpy (7.8 mg, 0.05 mmol), dimethyl formamide (DMF, 1 mL), H2O (5 mL), and HNO3 (50 μL, 6 mol·L-1) was added into a 25 mL Teflon-lined stainless steel autoclave, which was heated to 180 ℃ and kept constant for 120 h. Then the autoclave was cooled to room temperature at a rate of 5 ℃·h-1, and colorless crystals were obtained in ca. 59% yield based on Zn. Anal. Calcd. for C20H16N2O11Zn2 (%): C, 40.63; H, 2.73; N, 4.74. Found(%): C, 40.69; H, 2.79; N, 4.70. FI-IR (KBr, cm-1): 2 378(w), 1 637(s), 1 560(s), 1 476(w), 1 421(w), 1 342(m), 1 222(w), 1 068 (w), 743(m), 623(m).
1.3 Fluorescence sensing experiment
The powder (3 mg) of MOF 1 was soaked in deionized water (10 mL). Then the ultrasonic treatment was performed for 1 h, and the mixture was placed for 3 d to form a stable suspension, and then the fluorescence study was carried out. Nitrates of different cations, M(NO3)x (5 mmol·L-1, 20 μL, Mx+=Ag+, Ba2+, Bi2+, Ca2+, Cd2+, Co2+, Cu2+, Dy3+, Er3+, Fe3+, Eu3+, K+, La3+, Mg2+, Nd3+, Ni2+, Pb2+, Pr3+, Tb3+, Y3+, and Zn2+), were added to aqueous solution of 1 (1 mL) for inorganic cation sensing. For NACs sensing, different NACs (1 mmol·L-1, 20 μL) were added to aqueous solution of 1 (1 mL), such as 2, 4, 6-trinitrobenzene (TNP), 2, 4, 6-trinitrophenyl-hydrazine (TRI), 4 - dinitrophenylhy - drazine (DNP), p - nitrophenol (4 - NP), p - nitrobenzoic acid (PNBA), p-nitrophenylhydrazine (4-NPH), 3-nitroaniline (3-NT), o-nitroaniline (O-NT), o-nitrophenol (2-NP), and nitrobenzene (NB). Different antibiotics (1 mmol·L-1, 20 μL) were added to aqueous solution of 1 (1 mL), such as lincomycin hydrochloride (LIN), cefminox (CEF), tetracycline (TC), penicillin sodium (PEN), chloramphenicol (CAP), roxithr (ROX), gentamycin sulfate (GEN), omycinmetronidazole (MET), azithromycin (AZM), and ornidazole (ORN) for antibiotic sensing.
1.4 X-ray crystallography
The intensity data of 1 were collected on a Bruker Smart APEX Ⅱ CCD diffractometer with graphitemonochromated Mo Kα radiation (λ=0.071 073 nm) at room temperature. Empirical absorption corrections were applied using the SADABS program. The structure was solved by direct methods and refined by the full-matrix least-squares based on F2 using the SHELXTL - 2014 program[22]. All non - hydrogen atoms were refined anisotropically and hydrogen atoms of organic ligands were generated geometrically. Crystal data and structure refinement parameters for 1 are summarized in Table 1, selected bond distances and bond angles are listed in Table 2.
Table 1

 下载:
导出CSV
下载:
导出CSV
Parameter 1 Empirical formula C20H16Zn2N2O11 Formula weight 591.09 Crystal system Triclinic Space group P1 a / nm 0.969 1(3) b / nm 1.074 8(3) c / nm 1.077 6(3) α/(°) 78.963(4) β/(°) 72.752(4) γ/(°) 83.752(5) V / nm3 1.050 5(5) Z 2 Dc / (g·cm-3) 1.869 θ range for data collection / (°) 2.53-28.35 Absorption coefficient / mm-1 2.352 Crystal size / mm 0.32×0.30×0.20 F(000) 596 Reflection collected 6 466 Limiting-indices -7 ≤ h ≤ 12, -14 ≤ k ≤ 14, -13 ≤ l ≤ 13 Goodness-of-fit (on F2) 1.004 R1, wR2* [I > 2σ(I)] 0.037 6, 0.114 9 R1, wR2 (all data) 0.049 3, 0.123 4 * R=∑||Fo|-|Fc||/∑|Fo|, wR2=[∑w(Fo2-Fc2)2/∑w(Fo2)2]1/2. Table 2
Table 2. Selected bond distances (nm) and bond angles (°) for MOF 1下载:
导出CSV
Zn1—O8B 0.191 6(2) Zn1—O1 0.195 6(2) Zn1—O9 0.196 9(3) Zn1—N1 0.202 2(3) Zn2—O6A 0.191 4(2) Zn2—O2 0.199 7(3) Zn2—O4B 0.203 1(3) Zn2—N2 0.207 3(3) Zn2—O3B 0.254 3(2) Zn2—O10 0.241 0(2) O8B—Zn1—O1 110.98(10) O8B—Zn1—O9 111.44(14) O1—Zn1—O9 113.96(11) O8B—Zn1—N1 120.30(12) O1—Zn1—N1 97.74(11) O9—Zn1—N1 101.71(13) O6A—Zn2—O2 110.40(13) O6A—Zn2—O4 134.40(11) O2—Zn2—O4B 88.64(11) O6A—Zn2—N2 116.61(12) O2—Zn2—N2 94.47(11) O4B—Zn2—N2 101.97(11) O6A—Zn2—O10 77.5(5) O2—Zn2—O10 171.7(5) O4B—Zn2—O10 83.7(5) N2—Zn2—O10 83.9(6) O6A—Zn2—O10 81.9(5) O2—Zn2—O10 165.6(5) O4B—Zn2—O10 77.2(5) N2—Zn2—O10 86.2(5) Symmetry codes: A: -x, -y, 2-z; B: 1-x, -y, 2-z. CCDC: 2104032, 1.
2. Results and discussion
2.1 Structure description of MOF 1
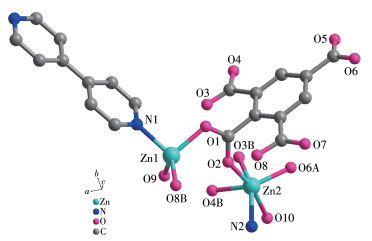
The asymmetric unit of 1 contains two independent Zn2+ ions, one (bta)4- ligand, one coordinated bpy ligand, two coordinated water molecules, and one lattice water molecule. As shown in Fig. 1, Zn1 is surrounded by one nitrogen atom (N1) from one bpy ligand (Zn1—N1 0.202 2(3) nm), one oxygen atom from a coordinated water molecule, two oxygen atoms (O1 and O8) from two carboxylate groups of two (bta)4- ligands. The coordination geometry of the Zn1 center can be described as a slightly distorted tetrahedral geometry. Different from Zn1 ion, Zn2 ion is in a slightly distorted octahedral coordination geometry. Zn2 lies in a general position and coordinates to four oxygen atoms from three carboxylate groups of three (bta)4- ligands, one oxygen atom from a coordinated water molecule, one nitrogen atom from a bpy ligand. The bond lengths of Zn2—O are comparable to the published ones[23], varying between 0.191 4(2) and 0.254 3(2) nm.
Figure 1
 Figure 1. Coordination environment of Zn2+ ion in 1
All H atoms are omitted for clarity; Symmetry codes: A: -x, -y, 2-z, B: 1-x, -y, 2-z
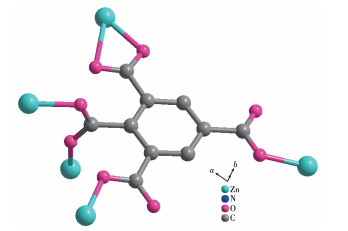
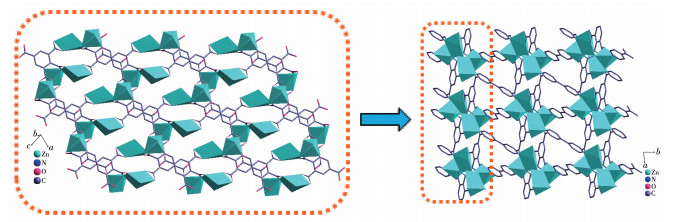
It is noteworthy that the completely deprotonated (bta)4- ligand adopts a μ6-η1-η2-η2-η1 chelating and bridging coordination mode (Scheme 1). Two carboxyl groups connect two Zn2+ ions by bridged monodentate coordination mode; one carboxyl group uses bidentate chelation to connect one Zn2+ ion, while the other carboxyl group link with two Zn2+ ions by bridging the bidentate coordination mode. Based on the connection mode, the neighbouring Zn1 and Zn2 centres are bridged by (bta)4- anions to form a novel 2D network, which is further linked by bpy ligands to generate a 3D network (Fig. 2).
Scheme 1
Figure 2
 Figure 2. View of 2D network of 1 based on (bta)4- ligand along b axis and 3D architecture along c axis
2.2 Thermal properties and PXRD measurement of MOF 1
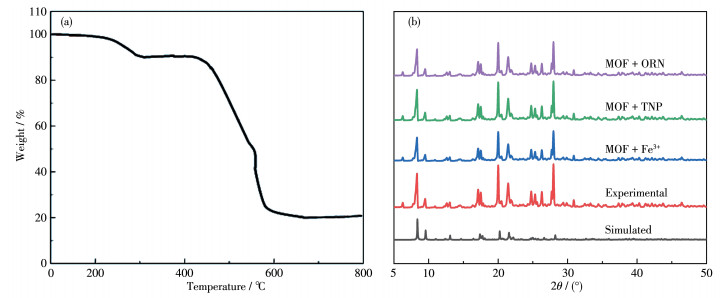
To identify the thermal stabilities of MOF 1, the TGA measurements were performed. The TG curve of 1 is shown in Fig. 3a. MOF 1 first lost its coordinated and lattice water molecule below 215 ℃, and the weight loss found of 10.11% was consistent with that calculated (9.14%). Then 1 was relatively stable up to 215-385 ℃. The further weight loss (68.33%) occurred in a range of 385 - 526 ℃, indicating the decomposition of (bta)4- and bpy ligands (Calcd. 68.05%).
Figure 3
 Figure 3. (a) TGA curve of MOF 1; (b) PXRD patterns of 1: simulated, experimental, and after selective experiments of Fe3+, TNP, and ORN
To confirm the phase purity of the bulk materials, PXRD patterns were measured at room temperature. The PXRD patterns of simulated, experimental, and after selective experiments of Fe3+, TNP and ORN have been shown in Fig. 3b, which exhibit the good agreement between theoretical simulated and experimental values and the good stability of the framework after fluorescence selective experiments.
2.3 Luminescent properties of MOF 1
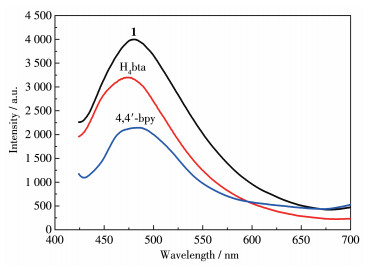
Given the excellent luminescence properties of d10 MOFs, the luminescence properties of MOF 1 and the ligands were studied at room temperature (Fig. 4). The ligands H4bta and bpy exhibited one emission band at 475 and 483 nm, respectively, upon excitation at 373 nm. MOF 1 exhibited one intense emission peak at 480 nm (λex=407 nm), which is assigned to the intraligand (π-π*) transitions of H4bta ligand[24]. By comparing the emission spectra of MOF 1 and the free ligand, we can conclude that the enhancement of luminescence in 1 may be attributed to the ligation of ligand to the metal center, which effectively increases the rigidity and reduces the loss of energy by radiationless decay[25-26].
Figure 4
 Figure 4. Emission spectra of H4bta, 4, 4′-bpy, and 1 in the solid-state at room temperature
2.4 Metal cation sensing experiments
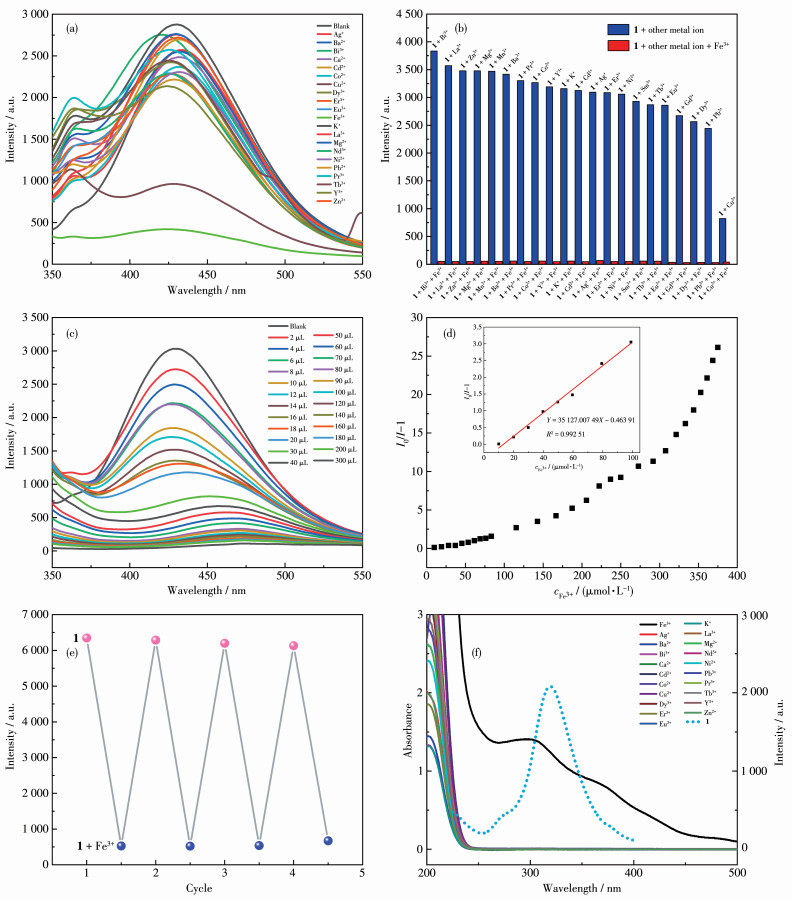
The excellent luminescence properties of MOF 1 prompted us to explore its fluorescence sensing. The sensing properties of 1 to 21 metal ions (Ag+, Ba2+, Bi2+, Ca2+, Cd2+, Co2+, Cu2+, Dy3+, Er3+, Fe3+, Eu3+, K+, La3+, Mg2+, Nd3+, Ni2+, Pb2+, Pr3+, Tb3+, Y3+, and Zn2+) were investigated. The detection of metal ions was analyzed according to the intensity change of the fluorescence emission peak of 1 (Fig. 5a). Interestingly, when Fe3+ was added, the fluorescence intensity of 1 was significantly quenched. However, the effect of other metal ions on the emission intensity of MOF 1 was not significant under the same conditions. This suggests that MOF 1 can be used to selectively determine Fe3+ ions.
Figure 5
 Figure 5. (a) Fluorescence spectra of 1 with various metal ions; (b) Comparison of the luminescence intensity of 1 in presence of Fe3+-mixed metal ions; (c) Fluorescence spectra of 1 in water with different concentrations of Fe3+; (d) Fluorescence Stern-Volmer equation and the linear relationship of I0/I-1 with Fe3+ concentration; (e) Cycle stability of 1 for the detection of Fe3+; Pink square: 1, Blue square: 1+Fe3+; (f) Excitation spectra of 1 and UV-Vis absorption spectra of Fe3+ and other metal ions in water
Competitive experiments were carried out to investigate the selectivity of Fe3+ to other interfering ions. In the absence of Fe3+ ion, the fluorescence intensity of the cations decreased slightly, but was greatly quenched when Fe3+ ion was added to the above solution (Fig. 5b). These results indicate that MOF 1 is an efficient and highly selective fluorescence sensor for Fe3+ ions.
In addition, the quenching effect of MOF 1 on the concentration of Fe3+ in a range of 0-300 μL was also investigated (Fig. 5c). With the increase of Fe3+ concentration, the fluorescence intensity decreased significantly. The quenching effect was evaluated by Stern-Volmer equation: I0/I=1+KsvcFe3+, where I0 and I are the fluorescence intensity of MOF 1 suspensions without and with Fe3+ ion added, respectively, Ksv is the Stern-Volmer enhancement constant, and cFe3+ is the concentration of Fe3+ ion[27]. Linear correlation coefficient (R2) of Ksv curve of MOF 1 suspension with Fe3+ was 0.993 5, and Ksv was estimated to be 5.341×10⁴ L·mol-1, indicating a good linear relationship between relative luminescence intensity and Fe3+ concentration (Fig. 5d). The detection limit for Fe3+ ion was 5.750 nmol·L-1 (at 3σ level)[28].
Furthermore, the recyclability performance of a fluorescence sensor plays a vital role in practical applications. Therefore, it is necessary to seek an easy and quick way of recycling. MOF 1 (cFe3+=5 mmol·L-1) can be easily regenerated for four cycles after detecting Fe3+ and washing several times with water (Fig. 5e). The PXRD patterns of recycled 1 remained essentially unchanged, indicating that the framework of MOF 1 is still stable (Fig. 3b).
The quenching mechanism of different metal ion aqueous solutions was studied by recording the UV-Vis absorption spectra of the metal ion systems (Fig. 5f). Among them, the absorption spectrum of Fe3+ had an observable peak in a range of 250 - 400 nm, and there was no other metal ion absorption in this wavelength range. Therefore, the luminescence quenching should be mainly due to the resonance energy transfer from the excited MOF to Fe3+. This quenching mechanism is consistent with that proposed previously by others[29-30].
2.5 NACs sensing experiments
NACs are widely used in industries such as fireworks, pharmaceuticals, and dyes, but due to their explosive properties, they cause serious damage to the environment. So the effective detection of NACs has attracted widespread attention due to their importance to human health and national security. Therefore, a variety of NACs (TNP, TRI, DNP, 4 -NP, PNBA, 4-NpH, 3-NT, O -NT, 2-Np, and NB) was selected to evaluate the sensing ability of MOF 1. For all NACs, the fluorescence intensity of MOF 1 was quenched to a certain extent (Fig. 6a), and maximum quenching of the fluorescence intensity of MOF 1 was gained in the presence of TNP.
Figure 6
 Figure 6. (a) Fluorescence spectra of 1 with various NACs; (b) Fluorescence spectra of 1 in water with different concentrations of TNP; (c) Fluorescence Stern-Volmer equation and the linear relationship of I0/I-1 with TNP concentration; (d) Comparison of the luminescence intensity of 1 in presence of TNP-mixed NACs
Similarly, a similar concentration titration experiment demonstrated the sensitivity of MOF 1 to TNP. As expected, the decrease in emission intensity was related to the concentration of TNP (Fig. 6b). It showed a good linear relationship in the low concentration range (R2=0.991 5, Fig. 6c), and the calculated Ksv value of TNP was 7.068×10³ L·mol-1. In addition, the detection limit of TNP was 43.29 nmol·L-1, which is better than the value reported in the literature[31-34]. However, when TNP was gradually dropped and its volume reached 30 μL, the fluorescence of 1 was almost completely quenched, and the quenching efficiency (Q) reached 99.1% (Q=(I0-I)/I0×100%), which showed that 1 could detect trace amounts of TNP sensitively. In addition, interference experiments of other NACs on TNP sensing were also studied. It was observed that in the absence of TNP, the fluorescence intensity of MOF 1 dispersed with other NACs in water decreased to a certain extent, but after the addition of TNP to the above solution, the fluorescence intensity decreased sharply and almost completely extinguished (Fig. 6d). This excellent anti-interference capability provides the possibility for the detection of TNP in complex systems.
2.6 Antibiotic sensing experiments
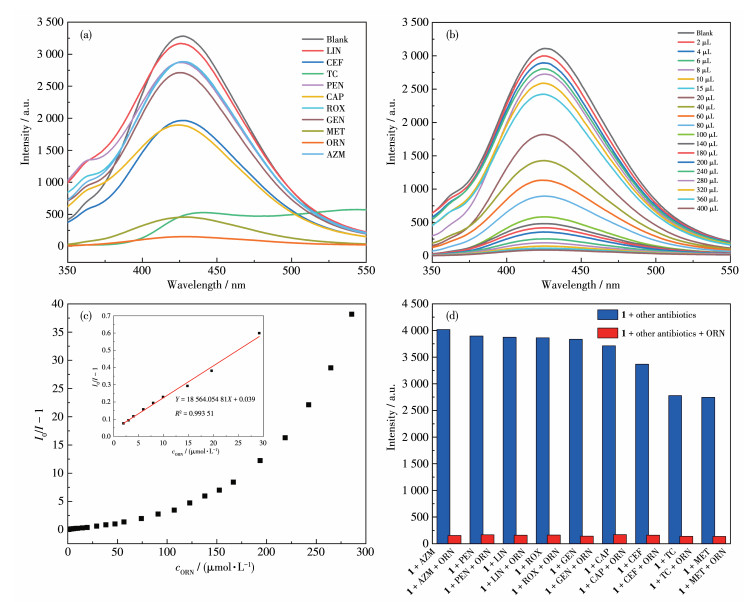
Although MOFs fluorescence sensors have important applications in many fields, few successful applications in antibiotic detection have been reported. In this experiment, ten kinds of commonly used antibiotics were selected to detect the sensing effect of MOF 1 on antibiotics in water, including LIN, CEF, TC, PEN, CAP, ROX, GEN, MET, AZM, and ORN. The emission spectra of 1 in various antibiotics are shown in Fig. 7a. The results show that 1 is a potential fluorescence sensor to identify ORN in water by fluorescence quenching.
Figure 7
 Figure 7. (a) Fluorescence spectra of 1 with various antibiotics; (b) Fluorescence spectra of 1 in water with different concentrations of ORN; (c) Fluorescence Stern-Volmer equation and the linear relationship of I0/I-1 with ORN concentration; (d) Comparison of the luminescence intensity of 1 in presence of ORN-mixed antibiotics
To further explore the detection sensitivity of 1 to ORN, we added ORN dropwise to 1 for a titration test. As shown in Fig. 7b, as the ORN concentration increased, the luminous intensity corresponding to 1 gradually decreased. In addition, the quenching effect can be quantitatively calculated by the Stern-Volmer equation when a low concentration of ORN was added. As shown in Inset of Fig. 7c, the Stern -Volmer plot showed a good linear relationship at a low concentration of ORN, and the corresponding Ksv value is 1.856×10⁴ L·mol-1 (R2= 0.993 51). But with the concentration of ORN gradually increasing, it no longer conformed to the linear equation, which is attributed to the self - absorption and energy transfer process[35]. The detection limit for ORN was calculated to be 16.02 nmol·L-1 (at 3σ level), which further demonstrates that MOF 1 is a very effective luminescence MOFs sensor for detecting ORN. In addition, the mixed antibiotics had little effect on the fluorescence detection of ORN, indicating that MOF 1 also shows good selectivity in mixed antibiotic systems (Fig. 7d).
3. Conclusions
In summary, a Zn - MOF has been hydrothermally synthesized based on H4bta and bpy ligands. Zn - MOF shows a 3D network, which is a high sensitivity, good selectivity and multi - response fluorescence sensor to be used for detection of Fe3+, 2, 4, 6-trinitrophenol (TNP), and ornidazole (ORN). It can also be used in the anti-interference test of Fe3+, TNP, and ORN. Among them, the detection limits of Zn-MOF in Fe3+, TNP, and ORN sensors are 5.750, 43.29, and 16.02 nmol·L-1, respectively.
-
-
[1]
Zhang Y M, Yuan S, Day G, Wang X, Yang X Y, Zhou H C. Luminescent Sensors Based on Metal-Organic Frameworks[J]. Coord. Chem. Rev., 2018, 354: 28-45. doi: 10.1016/j.ccr.2017.06.007
-
[2]
Yang X G, Ma L F, Yan D P. Facile Synthesis of 1D Organic-Inorganic Perovskite Micro-belts with High Water Stability for Sensing and Photonic Applications[J]. Chem. Sci., 2019, 10: 4567-4572. doi: 10.1039/C9SC00162J
-
[3]
Zhang X, Zhang Y, Shi P, Bi Z L, Shan Z X, Ren L J. The Deep Challenge of Nitrate Pollution in River Water of China[J]. Sci. Total Environ., 2021, 770: 144674-144678. doi: 10.1016/j.scitotenv.2020.144674
-
[4]
Chen Y Z, Wang Z U, Wang H W, Lu J L, Yu S H, Jiang H L. Singlet Oxygen-Engaged Selective Photo-Oxidation over Pt Nanocrystals/ Porphyrinic MOF: The Roles of Photothermal Effect and Pt Electronic State[J]. J. Am. Chem. Soc., 2017, 139: 2035-2039. doi: 10.1021/jacs.6b12074
-
[5]
Qiu S L, Xue M, Zhu G S. Metal-Organic Framework Membranes: From Synthesis to Separation Application[J]. Chem. Soc. Rev., 2014, 43: 6116-6140. doi: 10.1039/C4CS00159A
-
[6]
Han S D, Liu S J, Wang Q L, Miao X H, Hu T L. Synthesis and Magnetic Properties of a Series of Octanuclear[Fe6Ln2] Nanoclusters[J]. Cryst. Growth Des., 2015, 15: 2253-2259. doi: 10.1021/acs.cgd.5b00024
-
[7]
Ye Y, Du J F, Sun L B, Liu Y C, Wang S, Song X W, Liang Z Q. Two Zinc Metal-Organic Framework Isomers Based on Pyrazine Tetracarboxylic Acid and Dipyridinylbenzene for Adsorption and Separation of CO2 and Light Hydrocarbons[J]. Dalton Trans., 2020, 49: 1135-1142. doi: 10.1039/C9DT04305E
-
[8]
Liu L, Wang S M, Han Z B, Ding M, Yuan D Q, Jiang H L. Exceptionally Robust In-Based Metal-Organic Framework for Highly Efficient Carbon Dioxide Capture and Conversion[J]. Inorg. Chem., 2016, 55: 3558-3565. doi: 10.1021/acs.inorgchem.6b00050
-
[9]
Chai D F, Gómez-García C J, Li B, Pang H J, Ma H Y, Wang H M, Tan L C. Exceptionally Robust In-Based Metal-Organic Framework for Highly Efficient Carbon Dioxide Capture and Conversion[J]. Chem. Eng. J., 2019, 373: 587-597. doi: 10.1016/j.cej.2019.05.084
-
[10]
Wang G D, Li Y Z, Shi W J, Zhang B, Hou L, Wang Y Y. A Robust Cluster-Based Eu-MOF as Multi-functional Fluorescence Sensor for Detection of Antibiotics and Pesticides in Water[J]. Sens. Actuators B, 2021, 331: 129377-129384. doi: 10.1016/j.snb.2020.129377
-
[11]
Hou Y, Chai D F, Li B N, Pang H J, Ma H Y, Wang X M, Tan L C. Polyoxometalate-Incorporated Metallacalixarene@Graphene Composite Electrodes for High-Performance Supercapacitors[J]. ACS Appl. Mater. Interfaces, 2019, 11: 20845-20853. doi: 10.1021/acsami.9b04649
-
[12]
Zhao J, Wang Y N, Dong W W, Wu Y P, Li D S, Liu B, Zhang Q C. A New Surfactant-Introduction Strategy for Separating the Pure Single-Phase of Metal-Organic Frameworks[J]. Chem. Commun., 2015, 51: 9479-9482. doi: 10.1039/C5CC02043C
-
[13]
Li X Z, Li M, Li Z, Hou J Z, Huang X C, Li D. Concomitant and Controllable Chiral/Racemic Polymorphs: From Achirality to Isotactic, Syndiotactic, and Heterotactic Chirality[J]. Angew. Chem. Int. Ed., 2008, 47: 6371-6374. doi: 10.1002/anie.200801481
-
[14]
Cunha D, Yahia M B, Hall S, Miller S R, Chevreau H, Elkaim E, Maurin G, Horcajada P, Serre C. Rationale of Drug Encapsulation and Release from Biocompatible Porous Metal-Organic Frameworks[J]. Chem. Mater., 2013, 25: 2767-2776. doi: 10.1021/cm400798p
-
[15]
Li D S, Wu Y P, Zhao J, Lu J Y. Metal-Organic Frameworks Based upon Non-zeotype 4-Connected Topology[J]. Coord. Chem. Rev., 2014, 261: 1-27. doi: 10.1016/j.ccr.2013.11.004
-
[16]
Zhao B, Cheng P, Chen X Y, Cheng C, Shi W, Liao D J, Yan S P, Jiang Z H. Design and Synthesis of 3d-4f Metal-Based Zeolite-Type Materials with a 3D Nanotubular Structure Encapsulated"Water" Pipe[J]. J. Am. Chem. Soc., 2004, 126: 3012-3013. doi: 10.1021/ja038784e
-
[17]
Zeng M H, Feng X L, Chen X M. Crystal-to-Crystal Transformations of a Microporous Metal-Organic Laminated Framework Triggered by Guest Exchange, Dehydration and Readsorption[J]. J. Chem. Soc. Dalton Trans., 2004, : 2217-2223.
-
[18]
Patra R, Titi H M, Goldberg I. Coordination Polymers of Flexible Poly-carboxylic Acids with Metal Ions. Ⅳ. Syntheses, Structures, and Magnetic Properties of Polymeric Networks of 5-(3, 5)-(Dicarboxybenzyloxy)isophthalic Acid with Cd(Ⅱ), Cu(Ⅱ), Co(Ⅱ) and Mn(Ⅱ) Ions[J]. CrystEngComm, 2013, 15: 2853-2862. doi: 10.1039/c3ce27006h
-
[19]
Sun D, Han L L, Yuan S, Deng Y K, Xu M Z, Sun D F. Four New Cd(Ⅱ) Coordination Polymers with Mixed Multidentate N-Donors and Biphenyl-Based Polycarboxylate Ligands: Syntheses, Structures, and Photoluminescent Properties[J]. Cryst. Growth Des., 2013, 13: 377-385. doi: 10.1021/cg301573c
-
[20]
Sheldrick G M. Crystal Structure Refinement with SHELXL[J]. Acta Crystallogr. Sect. C, 2015, C71: 3-8.
-
[21]
Wang X T, Li R Y, Liu A G, Yue C P, Wang S M, Cheng J J, Li J P, Liu Z Y. Syntheses, Crystal Structures, Antibacterial Activities of Cu(Ⅱ) and Ni(Ⅱ) Complexes Based on Terpyridine Polycarboxylic Acid Ligand[J]. J. Mol. Struct., 2019, 1184: 503-511. doi: 10.1016/j.molstruc.2019.02.072
-
[22]
Dong X Y, Si C D, Fan Y, Hu D C, Yao X Q, Yang Y X, Liu J C. Effect of N-Donor Ligands and Metal Ions on the Coordination Polymers Based on a Semirigid Carboxylic Acid Ligand: Structures Analysis, Magnetic Properties, and Photoluminescence[J]. Cryst. Growth Des., 2016, 16: 2062-2073. doi: 10.1021/acs.cgd.5b01734
-
[23]
黄佳祥, 赵河, 刘淑芹, 张建军. 基于双核{Zn2(COO)4}次级构筑单元的二维发光配位聚合物的晶体结构和对Fe3+的检测[J]. 无机化学学报, 2021,37,(8): 1513-1518. HUANG J X, ZHAO H, LIU S Q, ZHANG J J. Two-Dimensional Luminescent Coordination Polymer Based on Dinuclear {Zn2(COO)4} Second Bulidings Units: Crystal Structure and Detection of Fe3+[J]. Chinese J. Inorg. Chem., 2021, 37(8): 1513-1518.
-
[24]
Xia J, Zhao B, Wang H S, Shi W, Ma Y, Song H B, Cheng P, Liao D Z, Yan S P. Two-and Three-Dimensional Lanthanide Complexes: Synthesis, Crystal Structures, and Properties[J]. Inorg. Chem., 2007, 46: 3450-3458. doi: 10.1021/ic061620p
-
[25]
Zhang L Y, Liu G F, Zheng S L, Ye B H, Zhang X M, Chen X M. Helical Ribbons of Cadmium(Ⅱ) and Zinc(Ⅱ) Dicarboxylates with Bipyridyl-Like Chelates-Syntheses, Crystal Structures and Photoluminescence[J]. Eur. J. Inorg. Chem., 2003, : 2965-2971.
-
[26]
Wang X L, Qin C, Wang E B, Xu L, Su Z M, Hu C W. Interlocked and Interdigitated Architectures from Self-Assembly of Long Flexible Ligands and Cadmium Salts[J]. Angew. Chem. Int. Ed., 2004, 43: 5036-5040. doi: 10.1002/anie.200460758
-
[27]
Xiao Q Q, Dong G Y, Li Y H, Cui G H. Cobalt(Ⅱ)-Based 3D Coordination Polymer with Unusual 4, 4, 4-Connected Topology as a Dual-Responsive Fluorescent Chemosensor for Acetylacetone and Cr2O72-[J]. Inorg. Chem., 2019, 58: 15696-15699. doi: 10.1021/acs.inorgchem.9b02534
-
[28]
Lv R, Li H, Su J, Fu X, Yang B Y, Gu W, Liu X. Zinc Metal-Organic Framework for Selective Detection and Differentiation of Fe(Ⅲ) and Cr(Ⅵ) Ions in Aqueous Solution[J]. Inorg. Chem., 2017, 56: 12348-12356. doi: 10.1021/acs.inorgchem.7b01822
-
[29]
Wen G X, Han M L, Wu X Q, Dong W W, Zhao J, Li D S, Ma L F. A Multi-responsive Luminescent Sensor Based on a Super-Stable Sandwich-Type Terbium(Ⅲ)-Organic Framework[J]. Dalton Trans., 2016, 45: 15492-15499. doi: 10.1039/C6DT03057B
-
[30]
Xiao J N, Liu J J, Liu M Y, Ji G F, Liu Z L. Fabrication of a Luminescence-Silent System Based on a Post-synthetic Modification Cd-MOFs: A Highly Selective and Sensitive Turn-On Luminescent Probe for Ascorbic Acid Detection[J]. Inorg. Chem., 2019, 58: 6167-6174. doi: 10.1021/acs.inorgchem.9b00420
-
[31]
Wiwasuku T, Boonmak J, Siriwong K, Ervithayasuporn V, Youngme S. Highly Sensitive and Selective Fluorescent Sensor Based on a Multi-responsive Ultrastable Amino-Functionalized Zn(Ⅱ)-MOF for Hazardous Chemicals[J]. Sens. Actuators B, 2019, 284: 403-413. doi: 10.1016/j.snb.2018.12.094
-
[32]
Senthilkumar S, Goswami R, Obasi N L, Neogi S. Construction of Pillar-Layer Metal-Organic Frameworks for CO2 Adsorption under Humid Climate: High Selectivity and Sensitive Detection of Picric Acid in Water[J]. ACS Sustainable Chem. Eng., 2017, 5: 11307-11315. doi: 10.1021/acssuschemeng.7b02087
-
[33]
Yang Y, Shen K, Lin J Z, Zhou Y, Liu Q Y, Hang C, Abdelhamid H N, Zhang Z Q, Chen H. A Zn-MOF Constructed from Electron-Rich π-Conjugated Ligands with an Interpenetrated Graphenelike Net as an Efficient Nitroaromatic Sensor[J]. RSC Adv., 2016, 6: 45475-45481. doi: 10.1039/C6RA00524A
-
[34]
Jia W, Ren S M, Xia H C, Zhang C, Zhang J F. An Ultra-stable Cd Coordination Polymer Based on Double-Chelated Ligand for Efficient Dual-Response of TNP and MnO4-[J]. Sens. Actuators B, 2020, 317: 128230-128240. doi: 10.1016/j.snb.2020.128230
-
[35]
Ren L L, Cui Y Y, Cheng A L, Gao E Q. Water-Stable Lanthanide-Based Metal-Organic Frameworks for Rapid and Sensitive Detection of Nitrobenzene Derivatives[J]. J. Solid State Chem., 2019, 270: 463-469. doi: 10.1016/j.jssc.2018.11.041
-
[1]
-
Figure 1 Coordination environment of Zn2+ ion in 1
All H atoms are omitted for clarity; Symmetry codes: A: -x, -y, 2-z, B: 1-x, -y, 2-z
Figure 2 View of 2D network of 1 based on (bta)4- ligand along b axis and 3D architecture along c axis
Figure 3 (a) TGA curve of MOF 1; (b) PXRD patterns of 1: simulated, experimental, and after selective experiments of Fe3+, TNP, and ORN
Figure 4 Emission spectra of H4bta, 4, 4′-bpy, and 1 in the solid-state at room temperature
Figure 5 (a) Fluorescence spectra of 1 with various metal ions; (b) Comparison of the luminescence intensity of 1 in presence of Fe3+-mixed metal ions; (c) Fluorescence spectra of 1 in water with different concentrations of Fe3+; (d) Fluorescence Stern-Volmer equation and the linear relationship of I0/I-1 with Fe3+ concentration; (e) Cycle stability of 1 for the detection of Fe3+; Pink square: 1, Blue square: 1+Fe3+; (f) Excitation spectra of 1 and UV-Vis absorption spectra of Fe3+ and other metal ions in water
Figure 6 (a) Fluorescence spectra of 1 with various NACs; (b) Fluorescence spectra of 1 in water with different concentrations of TNP; (c) Fluorescence Stern-Volmer equation and the linear relationship of I0/I-1 with TNP concentration; (d) Comparison of the luminescence intensity of 1 in presence of TNP-mixed NACs
Figure 7 (a) Fluorescence spectra of 1 with various antibiotics; (b) Fluorescence spectra of 1 in water with different concentrations of ORN; (c) Fluorescence Stern-Volmer equation and the linear relationship of I0/I-1 with ORN concentration; (d) Comparison of the luminescence intensity of 1 in presence of ORN-mixed antibiotics
Table 1. Crystal data and structure refinement parameters for MOF 1
Parameter 1 Empirical formula C20H16Zn2N2O11 Formula weight 591.09 Crystal system Triclinic Space group P1 a / nm 0.969 1(3) b / nm 1.074 8(3) c / nm 1.077 6(3) α/(°) 78.963(4) β/(°) 72.752(4) γ/(°) 83.752(5) V / nm3 1.050 5(5) Z 2 Dc / (g·cm-3) 1.869 θ range for data collection / (°) 2.53-28.35 Absorption coefficient / mm-1 2.352 Crystal size / mm 0.32×0.30×0.20 F(000) 596 Reflection collected 6 466 Limiting-indices -7 ≤ h ≤ 12, -14 ≤ k ≤ 14, -13 ≤ l ≤ 13 Goodness-of-fit (on F2) 1.004 R1, wR2* [I > 2σ(I)] 0.037 6, 0.114 9 R1, wR2 (all data) 0.049 3, 0.123 4 * R=∑||Fo|-|Fc||/∑|Fo|, wR2=[∑w(Fo2-Fc2)2/∑w(Fo2)2]1/2.  下载: 导出CSV
Table 2. Selected bond distances (nm) and bond angles (°) for MOF 1
Zn1—O8B 0.191 6(2) Zn1—O1 0.195 6(2) Zn1—O9 0.196 9(3) Zn1—N1 0.202 2(3) Zn2—O6A 0.191 4(2) Zn2—O2 0.199 7(3) Zn2—O4B 0.203 1(3) Zn2—N2 0.207 3(3) Zn2—O3B 0.254 3(2) Zn2—O10 0.241 0(2) O8B—Zn1—O1 110.98(10) O8B—Zn1—O9 111.44(14) O1—Zn1—O9 113.96(11) O8B—Zn1—N1 120.30(12) O1—Zn1—N1 97.74(11) O9—Zn1—N1 101.71(13) O6A—Zn2—O2 110.40(13) O6A—Zn2—O4 134.40(11) O2—Zn2—O4B 88.64(11) O6A—Zn2—N2 116.61(12) O2—Zn2—N2 94.47(11) O4B—Zn2—N2 101.97(11) O6A—Zn2—O10 77.5(5) O2—Zn2—O10 171.7(5) O4B—Zn2—O10 83.7(5) N2—Zn2—O10 83.9(6) O6A—Zn2—O10 81.9(5) O2—Zn2—O10 165.6(5) O4B—Zn2—O10 77.2(5) N2—Zn2—O10 86.2(5) Symmetry codes: A: -x, -y, 2-z; B: 1-x, -y, 2-z.
下载: 导出CSV
-


 扫一扫看文章
计量
- PDF下载量: 17
- 文章访问数: 1592
- HTML全文浏览量: 216
 下载:
下载:
