Scheme 1.
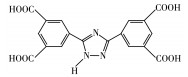
Structure of H4BDT
Heterometallic Ln(Na)-MOFs (Ln=Tb, Dy, Ho): Crystal Structures, Luminescent Sensing for Acetaldehyde, Fe3+, Cr2O72-, and Electrochemical Sensing for Catechol
Hong-Mei CHAI , Jia-Ling YAN , Yi-Xia REN , Lou-Jun GAO , Gang-Qiang ZHANG , Yan ZHANG , Shu-Yuan HAO

With the rapid development of industry, toxic and harmful substances (including heavy metal ions, toxic small molecules, etc.) are increasingly harmful to the environment and human health. Therefore, the detection of toxic and harmful substances plays an indispensable role in life sciences, biomedical and environmental science. Until now, various analytical techniques, such as atomic absorption spectrometry (AAS), atomic fluorescence spectrometry (AFS), inductively coupled plasma mass spectrometry (ICPMS), X-ray fluorescence spectroscopy (XRF), have been used for determination of toxic and harmful substances[1-2]. However, complicated sample preparation, expensive instruments and high cost make these analytical methods inconvenient[3]. Therefore, the detection of toxic and harmful substances in aqueous solutions by a simple method is significant for human health and ecological environment.
Compared with transition metals, lanthanide metals have unique properties of 4f orbitals. The electrons in the 4f orbital can undergo f-f or f-d transitions, presenting extremely rich energy level transitions and absorbing or emitting light of a very wide range of wavelengths from the ultraviolet to the infrared region[4]. So, the luminescent lanthanide MOFs (Ln - MOFs) have especial advantages in the field of fluorescence probes due to their excellent optical properties such as high color purity, large Stokes shift, sharp line emission and relatively long fluorescence lifetime, which can provide very favorable conditions for the design of modern high efficiency luminescent materials[5-7]. Until now, Ln-MOFs have been widely employed for the detection of inorganic ions and anions, organic (or inorganic) small molecules, antibiotics, neurotransmitters, explosives and temperature sensing[8-14].
In this study, we used 3, 5-bis(3', 5'-dicarboxylphe- nyl)-1H-1, 2, 4-triazole (H4BDT, Scheme 1) to design and construct three isostructural heterometallic MOFs (Ln(Na) - MOFs), namely {[LnNa(BDT) (H2O)3]·2H2O}n (Ln=Tb (1), Dy (2), Ho (3), by self-assembly under solvothermal conditions. Ln(Na)-MOFs were characterized by single crystal X-ray diffraction, elemental analysis, thermogravimetric analysis (TGA), IR and powder X - ray diffraction (PXRD). Because of the antenna effect of rare earth complexes and the synergetic effect of organic ligands and central metal ions, Tb(Na) - MOF (1) showed excellent luminescent properties, and can detect Fe3+, acetaldehyde molecules and Cr2O72-. In addition, 1 doped carbon paste electrode (1/CPE) had excellent electrochemical activity for sensing and identifying catechol.
Lanthanide metal salts (Tb(NO3)3·6H2O, DyCl3·6H2O, HoCl3-6H2O), H4BDT and other chemical reagents were commercially purchased and didn't require further purification. Elemental analyses of C, N, and H were performed on an Elementar Vario IE type element analyzer (Elementar Company in Germany). IR (KBr pellet) spectra were recorded on a Shimad- zu IRAFFINITY-1S spectrometer in a range of 4 000500 cm-1. Thermogravimetric measurements were performed on a ZPY-2P Thermal Analyzer (Shanghai Kaip- ing Instrument Factory) from 30 to 900 ℃ with a heating rate of 10℃•min-1 under N2 atmosphere. PXRD patterns were collected on a PANalytical X' Pert PRO instrument with Mo Ka radiation (A =0.154 06 nm, U= 45 kV, I=40 mA, 26 =5°-30°). Fluorescent data were collected on a Hitachi F-7000 fluorescence spectrometer at room temperature. Cyclic voltammetry (CV) measurements were performed on a CHI660D Electrochemical Workstation.
A mixture of lanthanide metal salts (0.05 mmol), H4BDT (0.05 mmol), 4, 4' - bipyridine (0.05 mmol), (CH3)2CHOH (1 mL) and HAc-NaAc buffer solution (5 mL, pH=6) were sealed in a 25 mL Teflon-lined stainless-steel autoclave. Then it was heated in an oven at 160 ℃ for 3 d, and was cooled to room temperature at a descent rate of 4℃•h-1. Colourless crystals of Tb (Na)-MOF (1) were obtained and washed with water and ethyl alcohol, then dried in air (63% yield based on Tb). Anal. Calcd. for C18H17O13N3NaTb(%): C, 32.48; H, 2.56; N, 6.32. Found(%): C, 32.88; H, 2.80; N, 6.30. FT-IR (KBr pellet, cm-1): 3 400(m), 1 629(m), 1 560(s), 1 413(s), 1 362(s), 1 120(w), 1 025(w), 929 (w), 875(w), 667(w), 600(w). The IR spectrum is shown in Fig.S1 (Supporting information).
Primrose yellow crystals of Dy(Na)-MOF (2) were obtained and washed with water and ethyl alcohol, then dried in air (78% yield based on Dy). Anal. Calcd. for C18H17O13N3NaDy(%): C, 32.31; H, 2.54; N, 6.28. Found (%): C, 32.82; H, 2.45; N, 6.33. FT-IR (KBr pellet, cm-1, Fig.S1): 3 391(m), 1 631(m), 1 560(s), 1 418(s), 1 364(s), 1 110(w), 1 024(w), 928(w), 877(w), 670(w), 602(w).
Light pink crystals of Ho(Na)-MOF (3) were obtained and washed with water and ethyl alcohol, then dried in air (86% yield based on Ho). Anal. Calcd. for C18H17O13N3NaHo(%): C, 32.19; H, 2.53; N, 6.26.Found(%): C, 32.52; H, 2.40; N, 6.32. FT - IR (KBr pellet, cm-1, Fig.S1): 3 384(m), 1 627(m), 1 559(s), 1 419(s), 1 363(s), 1 109(w), 1 022(w), 927(w), 878(w), 670(w), 599(w).
Single crystal with regular morphology and high crystallinity were selected by optical microscope. The single crystal diffraction data were collected by Bruker D8 Venture system with Mo Ka radiation (λ=0.071 073 nm) at 296 K. The collected diffraction data were absorption-corrected using SADABS program. The structure were solved by dual methods using SHELXT and refined by full-matrix least-squares methods against F2. Crystallographic data and structure refinement for 1 - 3 are displayed in Table 1. The selected bond lengths and bond angles for Ln(Na)-MOF are summarized in Table S1.
 下载:
导出CSV
下载:
导出CSV
| Parameter | 1 | 2 | 3 |
| Empirical formula | C18H17O13N3TbNa | C18H17O13N3DyNa | C18H17O13N3HoNa |
| Formula weight | 665.25 | 668.83 | 671.26 |
| Crystal system | Monoclinic | Monoclinic | Monoclinic |
| Space group | P21/n | P21/n | P21/n |
| a/nm | 0.743 72(19) | 0.748 82(6) | 0.749 78(12) |
| b/nm | 1.824 1(5) | 1.830 81(14) | 1.833 1(3) |
| c/nm | 1.538 4(4) | 1.546 83(12) | 1.547 3(3) |
| β/(°) | 93.711(4) | 93.596 2(12) | 93.473(2) |
| Volume/nm3 | 2.082 7(9) | 2.116 4(3) | 2.122 8(6) |
| Z | 4 | 4 | 4 |
| Dc/(g.cm-3) | 2.122 | 2.099 | 2.100 |
| Absorption coefficient/mm-1 | 3.498 | 3.632 | 3.828 |
| F(000) | 1 304 | 1 308 | 1 312 |
| θ range for data collection/(°) | 1.734-26.540 | 1.725-27.628 | 1.724-27.485 |
| Reflection collected | 4 335 | 4 849 | 4 844 |
| Reflection unique (Rinl) | 4 335 (0.027 3) | 4 849 (0.025 7) | 4 844 (0.021 9) |
| Data, restraint, parameter | 4 335, 0, 326 | 4 849, 0, 326 | 4 844, 13, 326 |
| Goodness-of-fit on F 2 | 0.863 | 1.134 | 1.227 |
| Final R indices [I > 2σ(I)]a, b | R1=0.022 8, wR2=0.055 7 | R1=0.027 1, wR2=0.060 8 | R1=0.022 9, wR2=0.063 1 |
| R indices (all data) | R1=0.026 1, wR2=0.069 3 | R1=0.039 4, wR2=0.074 7 | R1=0.029 3, wR2=0.074 0 |
CCDC: 2077995, 1; 2083696, 2; 2083700, 3.
3 mg powders of 1 ground with an agate mortar were dispersed into 3 mL different solvents or different nitrate aqueous solution (M(NO3)x) or different potassium solution (KyX) with a concentration of 0.01 mol·L-1. Among them, the solvents included N, N -dimethylfor- mamide (DMF), dimethyl sulfoxide (DMSO), ethanol (EA), formaldehyde (HCHO), isopropanol (IPA), ethyl acetate (EAC), n - butanol (NBA), methanol (MT), trichloromethane (CHCl3) glycol ether (GE), normal hexane (Hex), acetic acid (HAc), hexamethylene (CYH), acetaldehyde (AH), acetone (CP), and water(H2O). The metal ions in M(NO3)T were Sr3+, Zn2+, Mg2+, K+, Ag+, Na+, Pb2+, Bi3+, Cd2+, Al3+, Co2+, Hg2+, Ni2+, Fe3+, andCu2+; and the anions in KyX were Br-, I-, SCN-, Cl-, C2O42-, h2po4-, so42-, no2-, CO32-, ClO4-, S2-, SO32-, IO3-, PO43-, CH3COO- (Ac-), and Cr2O72-. Before fluorescence measurement, the suspension was ultrasonically for 30 min and allowed to rest at room temperature for 3 d.
MOF 1 was ground into fine powder using an agate mortar. Accurately obtained 10 mg powder of 1, 3 g graphite powder, 0.5 g liquid paraffin were thoroughly mixed. Then, the 1/CPE electrode was prepared by filling the polyvinyl chloride (PVC) pipe with an inner diameter of 3 mm with compacting and inserting copper wire as the conductor. It was left at room temperature for a week and the CPE electrode was polished to a mirror surface on the weighing paper before it was used. In phosphate buffered saline (pH=7), the electrochemical activity of 1/CPE was investigated by CV (sweep rate: 0.02 mV·s-1) to detect the o-dihydroxy- benzene (catechol) in water with different concentrations (c=0.02-0.085 mmol·L-1).
Crystallographic analyses show that complexes 1-3 crystallize in the monoclinic system with the space group of P2i/n (Table 1). Because the complexes exhibit isomorphic 3D coordination frameworks with heteronuclear bimetallic units, so only the structure of 1 is described herein as a representative. The asymmetric unit of 1 contains one Tb3+ ion, one Na+ ion, one BDT4- ligand, three coordinated water molecules, and two lattice water molecules with the formula of [TbNa(BDT) (H2O)3]-2H2O. One Tb3+ ion in the complex coordinates with seven oxygen atoms (O1, O3c, O4c, O5a, O6a, O7b, O8b) of four BDT4- ligands and two oxygen atoms (O9 and O10) from two water molecules to form a nine- coordinated configuration (Fig. 1a). Among them, O4c, O5a and O8b are located at the caps of the three flanks of the distorted triangular prism, respectively, O1, O7b and O9 are the three vertices of the upper surface, and O3c, O6a and O10 are the three vertices of the lower surface of the triangular prism. Six carboxylic oxygens (O3c and O4c, O5a and O6a, O7b and O8b) are the chelating coordination, respectively, while an oxygen atom (O1) is the bridging coordination. At the same time, O5a and O7b also coordinate with Na+ ion as bridging oxygen, connectting Tb3+ and Na+ into a heteronuclear bimetallic unit (the distance of Tb…Na ions is 0.383 77 nm). Na+ ion forms a five-coordinated configuration with an oxygen (O5a) in a water molecule and four atoms in BDT4- ligands, among them, the carboxyl oxygen O2d, O7b and O11 of three BDT4- ligands and the N atom of one BDT4- are all bridging coordination. And O1 on the carboxyl group acts as a bridging carboxyl group to connect the heteronuclear bimetallic units into a 1D chain (Fig. 1b). The 1D chain is connected by the flexible BDT4- to form a 2D two-layer plane structure (Fig. 1c), then it expands into a 3D microporous structure (Fig. 1d). The bond lengths and bond angles of 1 are shown in Table S1. The Tb—O and Na—O bond lengths are in the ranges of 0.232 5(4)- 0.252 1(3) nm and 0.223 4(4)-0.247 3(6) nm, respectively. The Na —N bond length is 0.251 6(5) nm, and the O—Tb—O and O—Na—N bond angles are in the rangesof 76.11(13)0 - 162.57(19)0 and89.41(19)0- 108.98(16)°, respectively. These bond lengths conform to the reported ranges of Tb—O bond length and O— Tb—O bond angle[15]. In 1-3, with the increase of atomic number from Tb to Ho, the average Ln—O bond lengths decreased from 0.243 7 to 0.242 9 nm gradually due to the lanthanide contraction effect[16]. So the average Na—O and Na—N bond lengths increased gradually from 0.234 9 to 0.236 9 nm and from 0.251 6 to 0.252 4 nm, respectively (Fig. 1d-1f).

Symmetry codes: a: 1-x, 1-y, 1-z; b: 1.5-x, -0.5+y, 0.5-z; c: 1.5-x, -0.5+y, 1.5-z; d: -0.5+x, 0.5-y, -0.5+z
The TGA curves of 1-3 have been recorded (Fig.S2-1f). The first weight loss of the MOFs ranging from 30 to 200 ℃ were 13.0% for 1 (Calcd. 13.5%), 13.46% for 2 (Calcd. 13.46%), 13.46% for 3 (Calcd. 13.4%), which should be attributed to the weight loss for all the coordination and lattice water molecules. The second weight loss of MOFs 1 -3 correspond to the slow decomposition of the framework over 470 ℃. PXRD patterns of 1 -3 are shown in Fig.S3. Most peak positions in simulated and experimental patterns were consistent with each other, indicating that 1-3 have good phase purity.
The solid state fluorescence spectra of H4BDT and 1-3 has been measured at room temperature under the excitation of 325 nm (slits: 5 nm, PMT voltage: 350 V) (Fig. 2). Only MOF 1 showed four well resolved characteristic emission peaks at 490.6, 544.6, 584.8, and 621.6 nm, corresponding to typical f - f transitions of Tb3+ ions, namely 5D4→7F6, 5D4→7F5, 5D4→7F4, and 5D4→7F3. Under the same condition, compared with 1, the fluorescence intensity of H4BDT, 2, and 3 were negligible. Therefore, the intensity change of the strongest emission peak (544.6 nm) was used as the detection index for analysis.
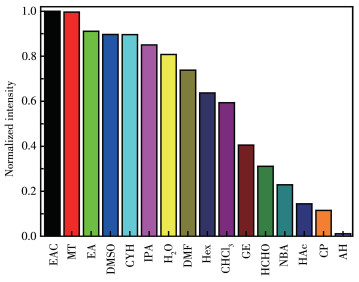
The fluorescence spectra of 1 in different solvents showed that the luminescence intensity of 1 was different (Fig.S4), and the fluorescence quenching phenomenon took place in AH (Fig. 3). The UV-Vis absorption of 1 in different solvents was recorded (Fig. S5). Compared to other solvents, the UV-Vis absorption band of AH had an obvious peak at 278 nm. Therefore, the fluorescence quenching of 1 by AH may be caused by competitive absorption.
To better understand the luminescence responses of AH to 1, the relationships between the concentrations of AH and the luminescence intensities were studied as shown in Fig. 4. The luminescence intensity of 1 gradually decreased with the increase of AH concentration, presenting a first order exponential relationship: y= 3 966.35exp(-x/83.837) + 327.699 (R2=0.993 94). When the concentration of AH was in a range of 5-100 μmol·L-1, there was a linear relationship (Fig. 4 inset) between the concentration of AH and the luminescence intensity of 1: y= 3 970.5 - 26.57x (R2=0.998 16); at the same time the detection limit (LOD) calculated was 0.125 μmol·L-1 calculated by formula 3σ/k. Compared with reported documents for detection AH by luminescent MOFs (LOD: 0.000 58%, about 102.7 μmol·L-1)[17], MOF 1 showed more excellent characteristics in terms of sensitivity.
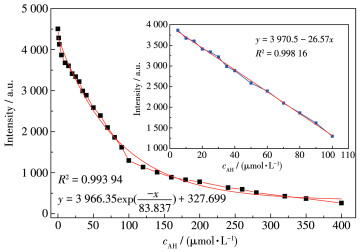
Inset: linear fitting graph for 1 sensing AH
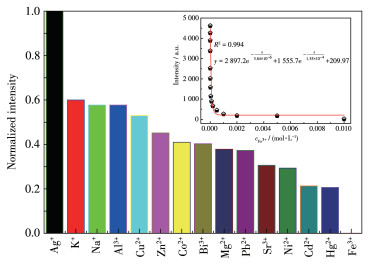
The fluorescence spectra of 1 in the presence of different metal ions are shown in Fig. S6. It is found that different metal ions had different effects on the fluorescence intensity of 1. Especially in the solution of Fe3+, the phenomenon of fluorescence quenching was most obvious. Therefore, MOF 1 may be a good sensing material for detecting Fe3+ ion (Fig. 5). To better know the fluorescence quenching mechanism, the UV - Vis absorption spectra of different metal ions was recorded (Fig. S7). Compared to other metal ions, the UV -Vis absorption band of Fe3+ had an obvious peak at 325 nm. Therefore, the fluorescence quenching of 1 by Fe3+ may be caused by competitive absorption[18].
Inset: nonlinear fitting graph for 1 sensing Fe3+
The luminescence intensity of 1 decreased gradually when the concentration of Fe3+ was changed from 10-11 to 10-2 mol·L-1 (Fig. 5, inset), and there was a good nonlinear relationship between the luminescence intensity of 1 and the concentration of Fe3+, y=2 897.2exp[-x/(3.84x10-6)] +1 555.7exp[-x/(1.35x 10-4)]+209.97 (R2=0.994).
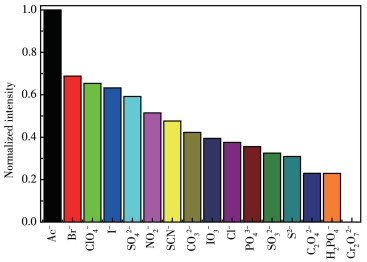
The fluorescence spectra of 1 in different anion aqueous solutions was recorded (Fig. S8). The most interesting feature was that the fluorescence intensity of the inorganic anions incorporated 1 suspension was heavily dependent on the species of inorganic anions. Especially, Cr2O72- anion showed a drastic quenching effect on the luminescence of 1. While other inorganic anions have no significant quenching effect, indicative of the fact that 1 can be considered as a promising luminescent probe for Cr2O72- anion (Fig. 6). The UV - Vis spectra of different inorganic anions was recorded (Fig. S9). Compared to other inorganic anions, the UV- Vis absorption band of Cr2O72- had an obvious peak between 310 and 400 nm. Therefore, this unique quenching effect for 1 possibly results from competitive absorption[19].
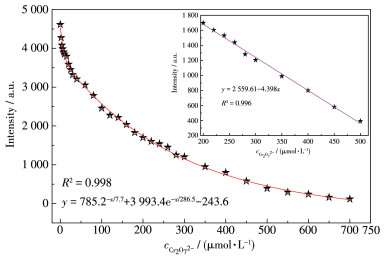
Quantitatively, the fluorescence spectra of 1 in Cr2O72- aqueous solutions with different concentrations (0-700 μmol·L-1) are shown in Fig. 7. There was the first-order derivative relationship between the fluorescence intensity of 1 and the concentration of Cr2O72-: y=785.2exp(-x/7.7)+3 993.4exp(-x/285.6)-243.6 (R2= 0.998). When the concentration of Cr2O72- was in a range of 200 - 500 pmol·L-1, there was a good linear relation (Fig. 7, inset). The linear equation was y= -4.398x+2 559.61 (R2=0.996), and the LOD was 6.72 μmol·L-1 (3σ/k). It was shown that MOF 1 had a lower LOD and good selectivity for Cr2O72-.
Inset: linear fitting graph for 1 sensing Cr2O72-
Catechol as an important phenolic compound is widely used in pharmaceutical industry and organic chemical industry, which has been identified as a highly toxic environmental pollutant because of its serious harm to the environment and organisms[20]. Therefore, how to fastly detect catechol with low cost, high sensitivity, high reproducibility has been widely concerned.
As an excellent multifunctional material, MOFs have gradually attracted more and more attention in electrochemical fields such as capacitors and catalytic hydrolysis[21]. However, there are no reports on the direct detection of catechol by electrochemical method.
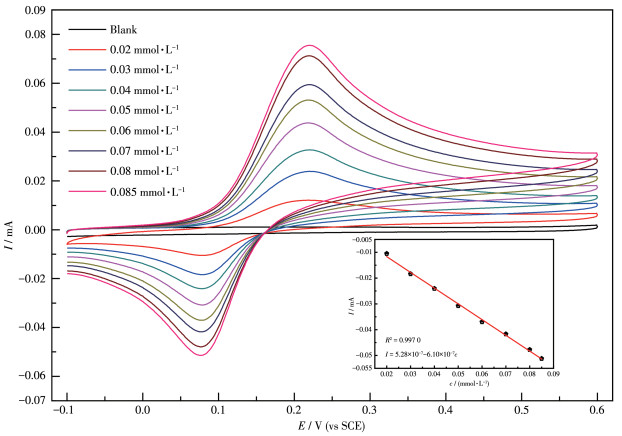
The results of catechol detection of 1 by CV are shown in Fig. 8. It can be seen from Fig. 8 that the reduction current gradually increased with the increase of catechol concentration, and they were linearly related (Fig. 8, inset): I=5.28x10⁻⁷-6.10x10⁻⁷c(R2=0.997 0). This indicates that Tb(Na)-MOF has a broad prospect in electrochemical sensing materials.
In summary, three novel luminescent 3D microporous heterometallic MOFs (Ln(Na) - MOFs, Ln=Tb (1), Dy (2), Ho (3)) were successfully constructed. Fluorescence analysis revealed that Tb(Na)-MOF could act as a fluorescent probe for highly sensitive induced Fe3+ and Cr2O72- (LOD of Cr2O72-: 6.72 μmol·L-1) in aqueous solutions and could detect the environmental pollutants acetaldehyde molecules (LOD: 0.125 μmol·L-1) efficiently and high sensitively. In addition, 1/CPE for detection of catechol showed a good electrochemical activity. Finally, the multifunctional sensing properties of Tb(Na) - MOF may make it expected to be further developed as a potentially valuable detection material for environmental pollutants.
Conflicts of interest: The authors declare no competing financial interest.
Acknowledgments: This work was supported by National Natural Science Foundation of China (Grants No. 22063010, 21763028) and College Students Innovation and Entrepreneurship Programme (Grants No.YCX2021101, D2020037).
Supporting information is available at http://www.wjhxxb.cn
Kumar S, Islam A, Ahmad H, Zaidi N. Graphene Oxide Supported on Amberlite Resin for the Analytical Method Development for Enhanced Column Preconcentration/Sensitive Flame Atomic Absorption Spectrometric Determination of Toxic Metal Ions in Environmental Samples.[J]. Ind. Eng. Chem. Res., 2019, 58: 8309-8316. doi: 10.1021/acs.iecr.9b00576
He J, Xu J L, Yin J C, Li N, Bu X H. Recent Advances in Luminescent Metal-Organic Frameworks for Chemical Sensors.[J]. Sci China Mater., 2019, 62: 1655-1678. doi: 10.1007/s40843-019-1169-9
Xu N, Zhang Q H, Hou B S, Cheng Q, Zhang G A. A Novel Magnesium Metal-Organic Framework as a Multiresponsive Luminescent Sensor for Fe(Ⅲ) Ions, Pesticides, and Antibiotics with High Selectivity and Sensitivity.[J]. Inorg. Chem., 2018, 57: 13330-13340. doi: 10.1021/acs.inorgchem.8b01903
Moore E G, Samuel A P S, Raymond K N. From Antenna to Assay: Lessons Learned in Lanthanide Luminescence.[J]. Acc. Chem. Res., 2009, 42(4): 542-552. doi: 10.1021/ar800211j
Cui Y J, Yue Y F, Qian G D, Chen B L. Luminescent Functional Metal-Organic Frameworks.[J]. Chem. Rev., 2012, 112(2): 1126-1162. doi: 10.1021/cr200101d
Du Y, Yang H Y, Liu R J, Shao C Y, Yang L R. Multi-responsive Chemosensor for Highly Sensitive and Selective Detection of Fe3+, Cu2+, Cr2O72- and Nitrobenzene Based on Luminescent Lanthanide Metal-Organic Framework.[J]. Dalton Trans., 2020, 49(37): 13003-13016. doi: 10.1039/D0DT02120B
Moradi E, Rahimi R, Farahani Y D, Safarifard V. Porphyrinic Zirconium -Based MOF with Exposed Pyrrole Lewis Base Site as a Luminescent Sensor for Highly Selective Sensing of Cd2+ and Br- Ions and THF Small Molecule.[J]. J. Solid State Chem., 2020, 282: 121103. doi: 10.1016/j.jssc.2019.121103
Ge K M, Wang D, Xu Z J, Chu R Q. A Luminescent Eu(Ⅲ)-MOF for Selective Sensing of Ag+ Solution.[J]. J. Mol. Struct., 2020, 1208: 127862. doi: 10.1016/j.molstruc.2020.127862
Yu H H, Fan M Y, Liu Q, Su Z M, Li X, Pan Q Q, Hu X L. Two Highly Water-Stable Imidazole-Based Ln-MOFs for Sensing Fe3+, Cr2O72-/CrO42- in a Water Environment.[J]. Inorg. Chem., 2020, 59: 2005-2010. doi: 10.1021/acs.inorgchem.9b03364
Huang S Z, Liu S S, Zhang H J, Han Z, Zhao G, Dong X Y, Zang S Q. Dual-Functional Proton-Conducting and pH-Sensing Polymer Membrane Benefiting from an Eu-MOF.[J]. ACS Appl. Mater. Interfaces, 2020, 12: 28720-28726. doi: 10.1021/acsami.0c08103
Liu W, Chen C Y, Wu Z L, Pan Y F, Ye C H, Mu Z R, Luo X L, Chen W M, Liu W S. Construction of Multifunctional Luminescent Lanthanide MOFs by Hydrogen Bond Functionalization for Picric Acid Detectionand Fluorescent Dyes Encapsulation.[J]. ACS Sustainable Chem. Eng., 2020, 8: 13497-13506. doi: 10.1021/acssuschemeng.0c04713
Yi K Y, Li H, Zhang X T, Zhang L. Designed Tb(Ⅲ)-Functionalized MOF-808 as Visible Fluorescent Probes for Monitoring Bilirubin and Identifying Fingerprints.[J]. Inorg. Chem., 2021, 60: 3172-3180. doi: 10.1021/acs.inorgchem.0c03312
Qin Z S, Dong W W, Zhao J, Wu Y P, Zhang Q C, Li D S. A Water-Stable Tb (Ⅲ)-Based Metal-Organic Gel (MOG) for Detection of Antibiotics and Explosives.[J]. Inorg. Chem. Front., 2018, 5: 120-126. doi: 10.1039/C7QI00495H
He H M, Xue Y Q, Wang S Q, Zhu Q Q, Chen J, Li C P, Du M. A Double-Walled Bimetal-Organic Framework for Antibiotics Sensing and Size-Selective Catalysis.[J]. Inorg. Chem., 2018, 57: 15062-15068. doi: 10.1021/acs.inorgchem.8b01898
Duan L J, Zhang C C, Cen P P, Jin X Y, Liang C, Yang J H, Liu X Y. Stable Ln-MOFs as Multi-responsive Photoluminescence Sensors for Sensitively Sensing Fe3+, Cr2O72-, and Nitrofuran.[J]. CrystEngComm, 2020, 22(10): 1695-1704. doi: 10.1039/C9CE01995B
Wang X R, Huang Z, Du J, Wang X Z, Gu N, Tian X, Li Y, Liu Y Y, Huo J Z, Ding B. Hydrothermal Preparation of Five Rare-Earth (Re=Dy, Gd, Ho, Pr, and Sm) Luminescent Cluster-Based Coordination Materials: The First MOFs-based Ratiometric Fluorescent Sensor for Lysine and Bifunctional Sensing Platform for Insulin and Al3+.[J]. Inorg. Chem., 2018, 57: 12885-12899. doi: 10.1021/acs.inorgchem.8b02123
Min J, Qu X L, Yan B. Tb Post-Functionalized La(Ⅲ) Metal Organic Framework Hybrid Probe for Simple and Highly Sensitive Detection of Acetaldehyde.[J]. Sens. Actuators B, 2019, 300: 126985. doi: 10.1016/j.snb.2019.126985
Jing T, Chen L, Jiang F L, Yang Y, Zhou K, Yu M X, Cao Z, Li S C, Hong M C. Fabrication of a Robust Lanthanide Metal-Organic Framework as a Multifunctional Material for Fe (Ⅲ) Detection, CO2 Capture, and Utilization.[J]. Cryst. Growth Des., 2018, 18(5): 2956-2963. doi: 10.1021/acs.cgd.8b00068
Li Z Y, Cai W Y, Yang X M, Zhou A L, Zhu Y, Wang H, Zhou X, Xiong K C, Zhang Q F, Gai Y L. Cationic Metal-Organic Frameworks Based on Linear Zwitterionic Ligands for Cr2O72- and Ammonia Sensing.[J]. Cryst. Growth Des., 2020, 20(5): 3466-3473. doi: 10.1021/acs.cgd.0c00247
Chetankumar K, Swamy B E K, Sharma S C. Poly(benzoguanamine) Modified Sensor for Catechol in Presence of Hydroquinone: a Voltammetric Study.[J]. J. Electroanal. Chem., 2019, 849: 113365. doi: 10.1016/j.jelechem.2019.113365
Liu S, Wang X, Yu H G, Wu Y P, Li B, Lan Y Q, Wu T, Zhang J, Li D S. Two New Pseudo-isomeric Nickel(Ⅱ) Metal-Organic Frameworks with Efficient Electrocatalytic Activity Toward Methanol Oxidation.[J]. Rare Met., 2021, 40(2): 489-498. doi: 10.1007/s12598-020-01596-x

Figure 1 (a) Coordination environment of 1; (b) 1D chains of heteronuclear bimetallic 1; (c) 2D plane of 1; (d-f) 3D structures of 1-3, respectively
Symmetry codes: a: 1-x, 1-y, 1-z; b: 1.5-x, -0.5+y, 0.5-z; c: 1.5-x, -0.5+y, 1.5-z; d: -0.5+x, 0.5-y, -0.5+z

Figure 4 Nonlinear fitting graph for 1 sensing AH
Inset: linear fitting graph for 1 sensing AH

Figure 5 Relative fluorescence intensity of 1 in the presence of different metal ions
Inset: nonlinear fitting graph for 1 sensing Fe3+

Figure 7 Nonlinear fitting graph for 1 sensing Cr2O72-
Inset: linear fitting graph for 1 sensing Cr2O72-
Table 1. Crystallographic data for 1-3
| Parameter | 1 | 2 | 3 |
| Empirical formula | C18H17O13N3TbNa | C18H17O13N3DyNa | C18H17O13N3HoNa |
| Formula weight | 665.25 | 668.83 | 671.26 |
| Crystal system | Monoclinic | Monoclinic | Monoclinic |
| Space group | P21/n | P21/n | P21/n |
| a/nm | 0.743 72(19) | 0.748 82(6) | 0.749 78(12) |
| b/nm | 1.824 1(5) | 1.830 81(14) | 1.833 1(3) |
| c/nm | 1.538 4(4) | 1.546 83(12) | 1.547 3(3) |
| β/(°) | 93.711(4) | 93.596 2(12) | 93.473(2) |
| Volume/nm3 | 2.082 7(9) | 2.116 4(3) | 2.122 8(6) |
| Z | 4 | 4 | 4 |
| Dc/(g.cm-3) | 2.122 | 2.099 | 2.100 |
| Absorption coefficient/mm-1 | 3.498 | 3.632 | 3.828 |
| F(000) | 1 304 | 1 308 | 1 312 |
| θ range for data collection/(°) | 1.734-26.540 | 1.725-27.628 | 1.724-27.485 |
| Reflection collected | 4 335 | 4 849 | 4 844 |
| Reflection unique (Rinl) | 4 335 (0.027 3) | 4 849 (0.025 7) | 4 844 (0.021 9) |
| Data, restraint, parameter | 4 335, 0, 326 | 4 849, 0, 326 | 4 844, 13, 326 |
| Goodness-of-fit on F 2 | 0.863 | 1.134 | 1.227 |
| Final R indices [I > 2σ(I)]a, b | R1=0.022 8, wR2=0.055 7 | R1=0.027 1, wR2=0.060 8 | R1=0.022 9, wR2=0.063 1 |
| R indices (all data) | R1=0.026 1, wR2=0.069 3 | R1=0.039 4, wR2=0.074 7 | R1=0.029 3, wR2=0.074 0 |
 下载: 导出CSV

 扫一扫看文章

扫一扫关注我们


 下载:
下载: