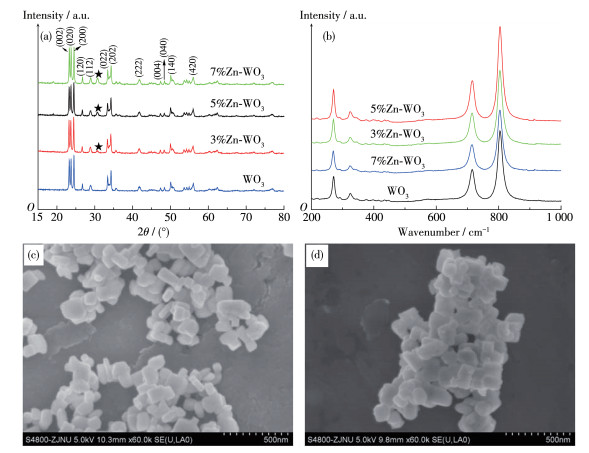
Figure 1.
XRD patterns (a) and Raman spectra (b) of WO3, 3%Zn-WO3, 5%Zn-WO3, and 7%Zn-WO3; SEM images of WO3 (c) and 5%Zn-WO3 (d)
Effect of Zn on Photocatalytic Activity of Block-Shaped Monoclinic WO3
Zhong-Lian XIAO , Xuan-Yi WU , He-Yun TAN , Aprea Paolo , Shi-You HAO

It is well known that the pollution resulting from dye wastewater has become one of the most serious environmental problems due to the wide usage of dyes in textiles, leather, papermaking, food additives, cosmetics, etc[1]. These dye wastewater may cause direct severe damage to the liver system, digestive system, and human beings because toxic by - products can be produced from the discharged dyes via oxidation, hydrolysis, and other chemical reactions[2-3]. Therefore, the wastewater containing dyes must be eliminated before being discharged into the environment. At present, many methods such as physical adsorption[4], chemical precipitation[5], and photocatalytic degradation[6], have been used to remove dyes from wastewater. Among these approaches, semiconductor-based photocatalysis is considered as a highly effective technology for the removal of organic dyes because organic pollutants can be degraded into H2O and CO2 over the semiconductor photocatalyst. As is reported that WO3 play an important role in the field of photocatalysis due to its narrow band gap of about 2.8 eV[7] and hence potentially efficient visible light absorbance. Generally, WO3 possesses monoclinic, triclinic, orthogonal or hexagonal crystal structure at different temperatures[8]. It can be concluded that monoclinic WO3 has efficiently phothocatalytic performance because of its lowest band gap (about 2.65 eV at room temperature[9]). Recently, we found that the photocatalytic efficiency of monoclinic WO3 was greatly affected by its morphology, and a block-shaped morphology was beneficial for the improvement of its photo-catalysis[10]. However, the photocatalytic activity of pure WO3 is not satisfactory because of its inherent defects such as relatively low conduction-band level[11]. In order to improve the photocatalytic efficiency of WO3, doping with metal and nonmetal elements is often used to form WO3 based composite structure such as WO3/ TiO2 [12], WO3/CuO[13], and WO3/C3N4[14]. As a promising alternative semiconductor, ZnO has attracted wide attention in the field of photocatalysis[15-17] because of potentially photocatalytic activity, low - cost and environmentally friendly feature. Because of the similar ionic radius of Zn2+ to that of W6+, it can be concluded that Zn2+ may penetrate into the WO3 crystal lattice or substitute the W6+ position in the crystal, resulting in easy generation of lattice defects and hence improvement of WO3 photocatalysis. Recently, Zn doped WO3 with different morphologys such as spherical, rod shaped or nanoporous morphology were synthesized and the photocatalytic activity of the resulted samples was also investigated[18-19]. However, to the best of our knowledge, there have no study investigating the photocatalytic property of Zn doped monoclinic WO3 with a block-shaped morphology.
Herein, Zn doped block- shaped monoclinic WO3 was prepared via a facile method and the photocatalytic degradation of rhodamine (RhB) was carried out. The photocatalytic results show that appropriate amount of Zn doping can improve the photocatalytic activity of block-shaped monoclinic WO3 due to the formation of oxygen vacancy and the increase of hydroxyl groups number.
Na2WO4·2H2O, Zn(NO3)2·6H2O, polyvinylpyrrolidone (PVP), absolute ethanol, sodium hydroxide (NaOH), 37% fuming hydrochloric acid (concentrated HCl), RhB, terephthalic acid (TPA), 1, 4-benzoquinone (BQ) and KI were purchased from Sinopharm Chemical Reagent Co. All the chemical reagents were used without further purification. Deionized water, with a resistivity larger than 18.2 MΩ, was obtained from Millipore Milli-Q® ultrapure water purification systems and used to prepare 0.1 mol·L-1 HCl and 0.1 mol·L-1 NaOH solutions (diluting the fuming hydrochloric acid and dissolving solid NaOH, respectively).
Typically, solution A was prepared by dissolving 4 g of PVP in 10 mL H2O at room temperature under stirring for 10 min, by adding 10 mL of concentrated HCl, and then by aging the solution for 60 min. Similarly, solution B was prepared by dissolving 3.3 g of Na2WO4·2H2O in 10 mL H2O at room temperature. Afterwards, solution B was slowly added to solution A under stirring for 30 min to form a yellow precipitate (H2WO4). The mixed solution was stirred for another 30 min, transferred into a Teflon autoclave, and the synthesis was carried out without agitation in oven at 180 ℃ for 12 h. The product was filtered and the solid was washed three times with deionized water, followed by washing for another three times with absolute ethanol. The washed solid was then dried at 60 ℃ overnight and a pale-yellow pre-product (a mixture of H2WO4 and WO3) was obtained.
A typical synthesis of Zn(OH)2 was performed as follows: at room temperature, 1 g of Zn(NO3)2·6H2O was added to 60 mL H2O under stirring for 30 min, and then 2 mol·L-1 NaOH was added dropwise until no formation of white precipitant. Afterwards, Zn(OH)2 was obtained by filtration, washed for 3 times with water and ethanol, respectively, and then dried at 60 ℃.
Zn - doped WO3 was synthesized by the following procedure. 0.5 g of the resulted mixture of H2WO4 and WO3 and x g (x=0.015, 0.025, 0.035) of Zn(OH)2 placed in the agate mortar were grinded for 30 min, and then calcined at 550 ℃ for 2 h. Finally, different amounts of Zn doped WO3 samples were obtained, and the samples were denoted as 3%Zn-WO3, 5%Zn-WO3, and 7%Zn-WO3, respectively. For comparison purposes, WO3 was synthesized under the same experimental conditions, except that no Zn(OH)2 was added.
The X-ray diffraction (XRD) patterns were collect- ed on a Philips PW3040/60 powder diffractometer using Cu Kα radiation (λ=0.154 nm). The X-ray tube was operated at 40 kV and 40 mA, and scanning interval ranged from 10° to 80°. Raman scattering analysis was performed on a Renishaw RM1000 Raman spectrometer with a 514 nm excitation laser light. Scanning electron microscope (SEM) images were obtained using a Hitachi S - 4800 instrument under an accelerating voltage of 20~40 kV, 0.2~5 kV in 100 V steps, and 5~ 40 kV in 1 kV steps. The UV-Vis diffuse reflectance (DRS) spectra of the samples over a range of 200~ 1 000 nm were recorded by a Nicolet Evolution 500 Scan UV - Vis system with a scanning rate of 60 nm· min-1. The FT - IR spectra were recorded by a Nicole Nexus 670 spectrometer with a resolution of 4 cm-1 using KBr pellet method. The photoluminescence (PL) spectra of the samples were obtained at room temperature by a spectrofluorometer (NanoLOG-TCSPC, Horiba Jobin Yvon, USA) with an excitation wavelength of 325 nm. X - ray photoelectron spectroscopy (XPS) measurement was carried out on a RBO upgraded PHI - 5000 C ESCA system (Perkin Elmer) using monochromated Al Kα X-rays (E=1 486.6 eV) as a radiation at 250 W operating at an accelerating voltage of 15 kV. All binding energies were calibrated using carbon (C1s, 284.6 eV) as a reference.
The photocatalytic activities of WO3, 3%Zn-WO3, 5%Zn - WO3, and 7%Zn - WO3 were evaluated by the photodegradation of RhB under visible light irradiation. In a typical experiment, 50 mg of photocatalyst (WO3, 3%Zn-WO3, 5%Zn-WO3 or 7%Zn-WO3) was dispersed into 50 mL of RhB solution (5 mg·L-1) under magnetic stirring for 15 min. The pH of all the solutions containing RhB used for the photocatalytic experiments was adjusted to the desired value using 0.1 mol· L-1 HCl and/or NaOH solutions. Afterwards, the suspensions were stirred in the dark for 30 min to reach the equilibrium. At given time intervals, a small amount of suspension was withdrawn and centrifuged to remove the photocatalyst. The residual RhB levels in the filtrates were then analyzed by recording the variations of the absorbance at 552 nm with a UV-Vis spectrophotometer (Evolution 500LC). The removal efficiency of RhB was evaluated as η:
|
|
(1) |
Where A0 is the initial absorbance of RhB and A is the absorbance of RhB in the filtrates.
The crystalline structure of WO3 and the samples prepared with different Zn amounts were characterized by XRD technique, which is presented in Fig. 1a. It can be seen from Fig. 1a that the XRD patterns of all the samples can be identified as monoclinic WO3 (PDF No.46-1096), whose characteristic peaks are located at 23.1°, 23.6°, 24.4°, 33.3°, 34.2° which corresponding to (002), (020), (200), (120), (202)[20]. It is obvious from Fig. 1a that the characteristic peak located at about 30.68° (marked with five pointed star) can be detected for the Zn-doped samples, which is the (100) reflection of ZnO. It also can be found from Fig. 1a that the intensity of (100) reflection increased with the increasing of Zn doping amount, implying that Zn can effectively entry into WO3 lattice, in good agreement with our above inference. The Raman spectra of as-prepared Zn-doped WO3 were also recorded and compared with that of WO3 in the range of 200~1 000 cm-1 (Fig. 1b). The peaks at around 270.4, 715.8 and 805.8 cm-1 are typical features of the monoclinic structure of WO3 [21], which is consistent with the XRD results. The lack of the peak at approximately 950 cm-1 attributed to the stretching mode of W6+=O[22], confirms the crystallinity of the catalysts. After Zn doping, the two most intense peaks at 715.8 and 805.8 cm-1, corresponding to O—W—O vibration mode, became wider. Furthermore, the Raman band at about 325 cm-1 assigned to 2E2 (M) vibration mode of hexagonal wurtzite ZnO[23] was observed in Zn doped WO3 samples, confirming the presence of Zinc in the catalyst. The result (Fig.S1) further prove the presence of Zinc in the synthesized samples. It can be seen from Fig. 1c and 1d that WO3 and 5%Zn-WO3 have a block-shaped morphology. Oth- er Zn doped samples also have similar structures to that of WO3, indicating that Zn doping amount arrang- ing from 3% to 7% can not change the block- shaped morphology of initial WO3.
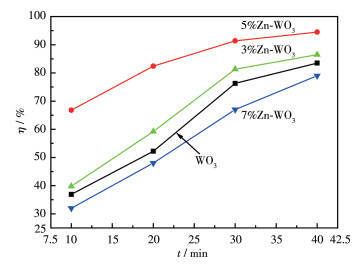
The photocatalytic activities of WO3, 3%Zn-WO3, 5%Zn-WO3, and 7%Zn-WO3 are showed in Fig. 2. It is clear that the photocatalytic efficiency of WO3 increased when Zn doping amount increased from 3% to 5%, but decreased when the doping amount exceeded 5%. Fig. 3 can explain the above experimental results. The photocatalytic results show that an appropriate amount of Zn doping is good for the improvement of WO3 photo-catalysis performance. It can be concluded from Fig.S2 that RhB was actually degraded over 5%Zn-WO3.
In order to explain the above photocatalytic results, UV - Vis DRS and PL spectra of WO3, 3%Zn-WO3, 5%Zn-WO3, and 7%Zn-WO3 were recorded and the results are shown in Fig. 3. It can be seen from Fig. 3a that the light (especially visible light) absorption efficiency of 5%Zn-WO3 was higher than that of WO3, resulting in efficient generation of photogenerated electrons and holes over 5%Zn-WO3 under the irradiation of visible light. The PL spectra of pure WO3 and Zn doped WO3 are shown in Fig. 3b. It is obvious that the position and pattern of the emission peaks of all samples were almost similar, but the PL intensities of the samples were noticeably different. Generally, the lower the PL intensity, the higher the separation efficiency for photogenerated electron-hole pairs[24]. From Fig. 3b, it is easy to find that the PL intensity of 5%Zn - WO3 was the lowest, indicating that the charge separation efficient in 5%Zn - WO3 was better than that in WO3. This may be due to the fact that the photogenerated electrons and holes are separated by the charge transfer at the heterojunction interfaces of 5%Zn-WO3. Consequently, the photocatalytic activity of 5%Zn - WO3 was higher than that of WO3. It can be seen that the light absorption efficiency of 7%Zn - WO3 was lower than those of other samples, and the PL intensity of it was the highest one, resulting in the lowest photocatalytic activity.
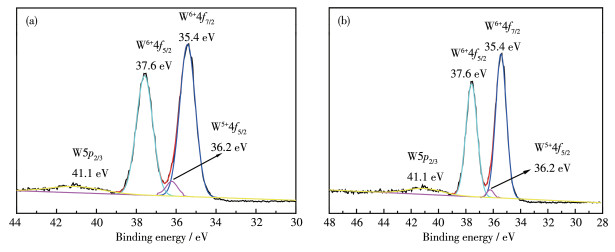
In order to study the reason why 5%Zn-WO3 had higher separation efficiency of photogenerated electron-hole pairs, W4f XPS spectra for 5%Zn-WO3 and WO3 were carried out (Fig. 4). It is clear from Fig. 4 that the W4f7/2 and W4f5/2 peaks centered at 35.4 and 37.6 eV are typical binding energies corresponding to W6+ oxidation state[25]. Moreover, the peak at about 36.2 eV corresponding to orbital spin of W5+4f5/2[26] was detected in 5%Zn-WO3 and WO3, but the peak intensity of the former was higher than that of the latter, implying that Zn doping is beneficial for the formation of W5+. The possible reason is that Zn2+ is beneficial to the interaction between WO3 precursor (H2WO4) and PVP. Therefore, the W6+ is easier to be reduced by PVP in 5%Zn-WO3 precursor than in the WO3 precursor, resulting in a larger number of oxygen vacancies arising from the replacement of W6+ by W5+ in 5%Zn-WO3, as expressed by the following equation:
|
|
(2) |
Where VO·· represents an oxygen vacancy. From our previous report[27], it can be concluded that the photo-generated electrons can be easily captured by oxygen vacancy, which can cause efficient separation efficiency for photogenerated electron - hole pairs. Therefore, the photocatalytic efficiency of 5%Zn-WO3 was higher than that of WO3.
Besides the above factor affecting the photocatalytic activity, the adsorption ability of dyes on the surface of photocatalyst also play an important role. It is reported that the content of hydroxyl groups on the surface of photocatalyst can greatly influence the adsorption ability of RhB and hence the photocatalytic efficiency[28]. Generally, the content of hydroxyl groups can be reflected by the O1s XPS spectra[29]. In order to invest the effect of Zn doping on the content of hydroxyl groups on the surface of WO3, the O1s XPS spectra of 5%Zn-WO3 and WO3 were obtained (Fig. 5). According to Han et al., the peak at about 530.5 eV is related to oxygen in the lattice (O2-, O Ⅱ), and another peak, located at about 531.5 eV, corresponds to adsorbed oxygen (O Ⅰ) in the form of O—H on the surface[30]. Generally, the content of hydroxyl groups can be reflected by the ratio of SOⅠ (the peak area of adsorbed oxygen in the form of O—H) to SOⅡ (the peak area of oxygen in the lattice). The higher the value of SOⅠ/SOⅡ, the richer the content of hydroxyl groups in the prepared sample. It can be found from Fig. 5 that the value of SOⅠ/SOⅡ for 5%Zn - WO3 was higher than that for WO3, implying that the content of hydroxyl groups in 5%Zn -WO3 was higher than that in WO3. The reason may be that Zn2+ is easy to combined with OH- to form [Zn(OH)4]2- coordination ion, which is good for the improvement of hydroxyl content in the precursor of 5%Zn-WO3. Consequently, the adsorbed amount of RhB on 5%Zn-WO3 was higher than that on WO3, resulting in a higher photocatalytic activity. The results of Fig. S3 show that ·O2- and h+ are the main active species to degrade RhB.
In summary, Zn-doped WO3 was synthesized by a facile method. The photocatalytic results show that the photocatalytic activity of WO3 is enhanced after doping of Zn because the photoelectrons and holes can be efficiently separated due to the formation of oxygen vacancies. Furthermore, Zn doping can improve the content of hydroxyl groups, which is beneficial for the improvement of RhB adsorption ability and hence the photocatalytic efficiency.
Kim K H, Ihm S K. J. Hazard. Mater., 2011, 186: 16-34 doi: 10.1016/j.jhazmat.2010.11.011
Liu X D, Yan L, Yin W Y, Zhou L J, Tian G, Shi J X, Yang Z Y, Xiao D B, Gu Z J, Zhao Y L. J. Mater. Chem. A, 2014, 2: 12296-12303 doi: 10.1039/C4TA00753K
Salleh M A M, Mahmoud D K, Karim W A, Idris A. Desalination, 2011, 280: 1-13 doi: 10.1016/j.desal.2011.07.019
Koyuncu, D D E, Okur M. Sep. Purif. Technol., 2021, 257: 117657 doi: 10.1016/j.seppur.2020.117657
Liu Y, Xu D L, Wang P, Dong Y H. Desalin. Water Treat., 2016, 57: 6772-6780 doi: 10.1080/19443994.2015.1010232
Wang Y F, Geng Q J, Yang J M, Liu, Y, Liu C. ACS Omega, 2020, 5: 31137-31145 doi: 10.1021/acsomega.0c04285
Malato S, Fernandez-Ibanez P, Maldonado M I, Blanco J, Gernjak W. Catal. Today, 2009, 147: 1-60
Roussel P, Labbe P, Groult D. Acta Crystallogr. Sect. B: Struct. Sci., 2000, 56: 377-399 doi: 10.1107/S0108768199016195
Gillet M, Aguir K, Lemire C, Gillet E, Schierbaum K. Thin Solid Films, 2004, 467: 239-246 doi: 10.1016/j.tsf.2004.04.018
Shang J, Xiao Z L, Yu L X, Aprea P, Hao S Y. Nanotechnology, 2020, 31: 125603 doi: 10.1088/1361-6528/ab5c4f
Xi G C, Yue B, Cao J Y, Ye J H. Chem. Eur. J., 2011, 17: 5145-5154 doi: 10.1002/chem.201002229
Odhiambo V O, Ongarbayeva A, Keri O, Simon L, Szilagyi I M. Nanomaterials, 2020, 10: 882 doi: 10.3390/nano10050882
Dursun S, Koyuncu S N, Kaya I C, Kaya G G, Kalem V, Akyildiz H. J. Water Process Eng., 2020, 36: 101390 doi: 10.1016/j.jwpe.2020.101390
Truong H B, Huy B T, Ray S K, Lee Y I, Cho J, Hur J. Chem. Eng. J., 2020, 399: 125733 doi: 10.1016/j.cej.2020.125733
Zeng W, Ren Y F, Zheng Y Y, Pan A Q, Zhu T. ChemCatChem, 2021, 13: 564-573 doi: 10.1002/cctc.202001407
Lin Y, Hu H Y, Hu Y H. Appl. Surf. Sci., 2020, 502: 144202 doi: 10.1016/j.apsusc.2019.144202
Chen J, Xiong Y, Duan M, Li X, Li J, Fang S W, Qin S, Zhang R. Langmuir, 2020, 36: 520-533 doi: 10.1021/acs.langmuir.9b02879
Arshad M, Ehtisham-ul-Haque S, Bilal M, Ahmad N, Ahmad A, Abbas M, Nisar J, Khan M I, Nazir A, Ghaffar A, Iqba M. Mater. Res. Express, 2020, 7: 015407 doi: 10.1088/2053-1591/ab6380
Santhi K, Rani C, Kumar R D, Karuppuchamy S. J. Mater. Sci. : Mater. Electron., 2015, 26: 10068-10074 doi: 10.1007/s10854-015-3689-5
Chen S H, Xiao Y, Xie W, Wang Y H, Hu Z F, Zhang W, Zhao H. Nanomaterials, 2018, 8: 1-13
Djaoued Y, Balaji S, Bruning R. J. Nanomater., 2012, 2012: 674168
Huang Y S, Zhang Y Z, Zeng X T, Hu X F. Appl. Surf. Sci., 2002, 202: 104-109 doi: 10.1016/S0169-4332(02)00943-1
Akira S, Hamdi A, Addad A, Coffinier Y, Boukherroub R, Omrani A D. Appl. Surf. Sci., 2017, 400: 461-470 doi: 10.1016/j.apsusc.2016.12.212
Samanta S, Martha S, Parida K. ChemCatChem, 2014, 6: 1453-1462
Annanouch E F, Roso S, Haddi Z, Vallejos S, Umek P, Bittencourt C, Blackman C, Vilic T, Llobe E. Thin Solid Films, 2016, 618: 238-245 doi: 10.1016/j.tsf.2016.08.053
Ozin G A, Prokopowicz R A, Ozkar S. J. Am. Chem. Soc., 1992, 114: 8953-8963 doi: 10.1021/ja00049a028
Hao S Y, Hou J, Aprea P, Pepe F. Appl. Catal. B, 2014, 160-161: 566-573
Hao S Y, Hou J, Aprea P, Lv T X. Ind. Eng. Chem. Res., 2014, 53: 14617-14622
Wang Y G, Li B, Zhang C L, Cui L F, Kang S F, Li X, Zhou L H. Appl. Catal. B, 2013, 130-131: 277-84
Han H G, Li H P, Fu L, Yang J, Liu Z. Chem. Phys. Lett., 2016, 651: 183-187

Figure 1 XRD patterns (a) and Raman spectra (b) of WO3, 3%Zn-WO3, 5%Zn-WO3, and 7%Zn-WO3; SEM images of WO3 (c) and 5%Zn-WO3 (d)

Figure 2 Photodegradation of 5 mg·L-1 RhB in the presence of different photocatalysts under visible light irradiation at pH of 6 (VRhB=50 mL, mphotocatalyst =0.05 g)

 扫一扫看文章

扫一扫关注我们
 下载:
下载:


 下载:
下载:


 下载:
下载: