
Figure 1.
SEM images of Mn-FSD with different sizes and morphologies: (A) Mn-FSD-1, (B) Mn-FSD-2, (C) Mn-FSD-3, (D) Mn-FSD-4

Metal-organic frameworks (MOFs) are fascinating porous materials self-assembled from inorganic nodes and organic ligands, which attracted extensive attentions owing to their tunable porous structures, designable structure, large surface area, customizable chemistry, biodegradable and biocompatibility[1-5]. Benefiting from these intriguing properties, metal-organic frameworks (MOFs) have been widely used in various fields, such as luminescence, sensing, batteries, supercapacitors, gas storage, gas separation, catalysis, drug delivery and bioimaging[6-10]. For bioimaging, several MOFs have been constructed and explored for optical imaging (OI) and magnetic resonance imaging (MRI). For example, Chen group fabricated a novel core-shell PB@MIL-100 (Fe) with magnetic resonance and optical dualmodel imaging capabilities[11]. Tang group designed and introduced an UCNP@Fe-MIL-101-NH2@PEG@FA core-shell structure that are certainly capable of fluorescent/magnetic dual-modal imaging[12]. Our group also fabricated a smart MOF platform (Fe-MIL-53-NH2-FA-5-FAM/5-FU) for magnetic resonance/optical imaging and targeted drug delivery[13]. However, such materials usually have complicated structure and require multi-step synthesis. Combining MRI and OI into one MOFs via one-pot method remains challenging and relatively unexplored.
In this study, micro-nano Mn-FSD was achieved successfully by one-pot method using glucose and polyvinyl pyrrolidone (PVP) as modulators. It is important to note that MRI and OI capacities are integrated into a simple MOFs firstly in this work, which is self-assembled from Mn2+ and fluorescein (FSD). As we know, Mn2+ based contrast agents are commonly used T1 contrast agents, which are able to increase the longitudinal water proton relaxation rates, producing brighter image signals[14-16]. FSD can emit strong green fluorescence with high fluorescence quantum yield in aqueous media and has been widely used as a fluorescent probe[17-19]. Based on this, the Mn-FSD has the potential for MRI and OI. In the presence of PVP and glucose, the size of Mn-FSD can be adjusted into micro-nano range for biological application. As expected, Mn-FSD exhibited excellent fluorescence imaging capabilities in the cell and in vivo. Besides, Mn-FSD also displayed ideal magnetic resonance imaging abilities with high relaxivity values. All in all, this work integrated MRI and OL in one MOFs for the first time.
All the starting reagents and solvents were acquired from commercial sources and used directly without further purification. Powder X-ray diffraction (XRD) patterns over the 2θ range from 5° to 80° were performed on an EMPYREAN PANALYTICAL apparatus using the Cu Kα radiation (λ=0.154 059 8 nm) at a scanning rate of 2 (°) ·min-1. The voltage was 60 kV and the current was 55 mA. The morphology of the products was obtained using HITACHI-SU8220 scanning electron microscope (SEM) and FEI Tecnai G2 F20 high-resolution transmission electron microscope (HRTEM). The accelerating voltage during testing is 20 and 200 kV, respectively. Energy-dispersive X-ray (EDX) mapping analysis was carried out on TEM. Photoluminescence (PL) spectra were collected on a Hitachi F-7000 fluorescence spectrophotometer. NEXUS-670 Fourier transform infrared spectrophotometer was used to record fourier transform infrared spectroscopy (FTIR) spectra. Thermogravimetric analysis (TGA) was performed from 0 to 800 ℃ using STA 449F3-QMS 402D-IS50 thermal analyser under N2 atmosphere. A laser scanning confocal microscope (Zeiss LSM 710) was used to bioimaging. UV-Vis spectra were recorded on a UV-3150 UV-visible spectrophotometer.
The Mn-FSD were prepared according to the previous work with some modifications[20]. In a normal procedure, 0.122 5 g Mn(OAc)2·4H2O, 0.8 g PVP and 0.8 g glucose were dissolved in 5 mL H2O to obtain solution A, and 0.188 g fluorescein sodium salt (Na2FSD) was dissolved in 4 mL methanol to obtain solution B. Subsequently, solution B was added to solution A and the mixture was heated at 90 ℃ for 24 h under hydrothermal condition. After that the mixture was cooled to room temperature and the product was collected and washed by centrifugation for several times as well as dried at 60 ℃. The obtained product was marked as Mn-FSD-1. 0.122 5 g Mn(OAc)2·4H2O and 0.15 g PVP were dissolved in 5 mL H2O to obtain solution A, and 0.188 g Na2FSD and 0.15 g glucose were dissolved in 4 mL methanol to obtain solution B. Subsequently, solution B was added to solution A and the mixture was heated at 90 ℃ for 24 h under oil bath condition. The obtained product was marked as Mn-FSD-2. 0.122 5 g Mn(OAc)2·4H2O, 0.2 g PVP and 0.2 g glucose were dissolved in 5 mL H2O to obtain solution A, and 0.188 g Na2FSD was dissolved in 4 mL methanol to obtain solution B. Subsequently, solution B was added to solution A and 4 mL DMF was added to the mixture. The mixture was heated at 90 ℃ for 24 h under hydrothermal condition. The obtained product was marked as Mn-FSD-3. 0.122 5 g Mn(OAc)2 ·4H2O and 0.15 g PVP were dissolved in 5 mL H2O to obtain solution A, and 0.188 g Na2FSD and 0.15 g glucose were dissolved in 4 mL methanol to obtain solution B. Subsequently, solution B was added to solution A and the mixture was heated at 90 ℃ for 24 h under hydrothermal condition. The obtained product was marked as Mn-FSD-4.
MTT method was used to evaluate the cell cytotoxicities of Mn-FSD-4. Briefly, HL-7702 cells and A549 cells were added to a 96-well plate for adherent growth. Mn-FSD-4 with different concentrations (0, 1.562, 3.125, 6.25 and 12.5 µg·mL-1) were added to the wells. After incubating for 24 h, staining HL-7702 cells and A549 cells with MTT. At last, the absorbance (A) of each well was monitored at 570 nm on a microplate reader. The cell viability was expressed as follows: cell viability=Asample/Acontrol×100%. All experiments were performed in triplicate.
In the experiment, HL-7702 cells and A549 cells were seeded into a 6-well plate and cultured with Mn-FSD-4 (4 mg·mL-1) for 4 h. Before the confocal imaging, the cells were washed with phosphatebuffered saline (PBS) for three times. Confocal fluorescence imaging was performed on a laser scanning confocal microscope (Zeiss LSM 710).
Nude mice were purchased from Charles River Laboratories in Beijing. All animals were kept in a constant temperature environment of 22 ℃ and keep plenty of food and water. The nude mice were injected with Mn-FSD-4 solution (total dose=100 µL, cMn-FSD-4=4 mg· mL-1) via intratumoral injection. After treatment for 1 h, in vivo fluorescence imaging was performed on an IVIS imaging system (Iumina Ⅱ)
Shortly, athymic nude mice were injected with Mn-FSD-4 (4 mg·mL-1) by intraperitoneal and sacrificed at time intervals of 0, 15 and 30 h. Lastly, the fluorescence signal intensities of the tissues were collected and imaged on an IVIS imaging system (Iumina Ⅱ)
In vitro and in vivo MRI was performed on a Siemens Prisma 3.0 T MR scanner (Erlangen, Germany) with gradient strength up to 80 mT·m-1. For in vitro measurements, solutions with different Mn2+ concentrations (0, 0.062 5, 0.125, 0.25, 0.5 mmol·L-1) were tested. For in vivo MRI, all mice were kept in a constant temperature environment of 22 ℃ and kept plenty of food and water. The nude mice were injected with Mn-FSD-4 solution (total dose=200 µL, cMn-FSD-4=5 mg· mL-1) via intratumoral injection. After treatment for 4 h, in vivo MRI was performed.
This study was performed in strict accordance with the Helsinki Declaration of 1975, as revised in 2008 (5) concerning Human and Animal Rights. All animal experiments were carried out according to the Ethical Committee of Inner Mongolia Medical University. All animal experiments were approved by Inner Mongolia Medical University.
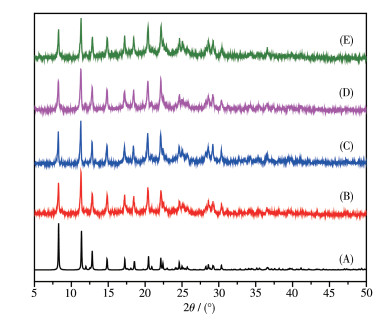
In general, the particle size can be adjusted via altering the reaction conditions. In this study, Mn-FSD with different sizes and morphologies were achieved under different reaction conditions. PVP and glucose was applied to control over the size and morphology of Mn-FSD. Apparently, the morphology was tuned from rodlike to irregular sphere and the sizes of Mn-FSD decreased from 10 µm to 500 nm (Fig. 1). As we know, PVP and glucose are able to cover the surface of Mn-FSD. Additionally, the attachment of PVP and glucose can be acted as a structure-directing agent, inducing Mn-FSD to grow in different directions and resulting in Mn-FSD with different morphologies[21-22]. Meanwhile, XRD patterns of Mn-FSD-1, Mn-FSD-2, Mn-FSD-3 and Mn-FSD-4 were matched well with the simulated one and the sharp peaks of all the products indicate they have excellent crystallinity, as shown in Fig. 2. Thus, the decrease of the particle size did not cause the change of the Mn-FSD. The FTIR spectra of Na2FSD and Mn-FSD-1~Mn-FSD-4 are displayed in Fig. S1 (Supporting information). Apparently, Mn-FSD-1 ~Mn-FSD-4 exhibited almost consistent characteristic bands. Compared with Na2FSD, the absorption bands at 1 610~1 560 cm-1 and 1 440~1 360 cm-1 attributed to —COO- became sharp, which may be due to coordination between Mn2+ and —COO- in FSD. Besides, the TGA curves of Mn-FSD-1~Mn-FSD-4 were similar. As depicted in Fig. S2, the weight loss (about 3%) occurring at 45~157 ℃ originates from the loss of solvent molecules. The significant weight loss around 330 ℃ corresponds to the collapse of frameworks of Mn-FSD-1 ~Mn-FSD-4. The solid-state UV-Vis absorption spectra are also shown in Fig.S3. Mn-FSD-1~Mn-FSD-4 exhibited an absorption maximum at 440 nm with a few shoulder peaks at 336, 500 and 613 nm. Meanwhile, fluorescence spectra are depcited in Fig. S5 and S6. Clearly, Mn-FSD-1~Mn-FSD-4 displayed emission with a maximum at 520 nm upon excitation at 445 nm, respectively. Na2FSD exhibited a broad emission band with a maximum at 529 nm when the excitation was 361 nm as shown in Fig. S4. Obviously, the fluorescence properties of Mn-FSD-1~Mn-FSD-4 are mostly attributed to FSD. Meanwhile, the quantum efficiency of Mn-FSD-4 was 3.55%, which was higher than Na2FSD (2.28%) due to the charge transfer interaction between Mn2+ and FSD[20].
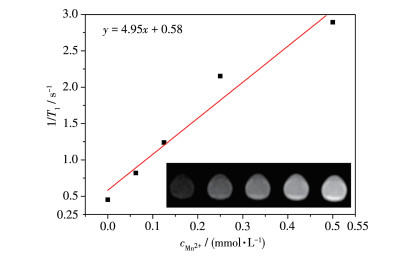
Besides, it is well known that the Mn2+ is able to serve as T1 contrast agent and the micro-nanoscale Mn-FSD-4 was selected to confirm the MRI ability. T1-weighted MRI of the fabricated Mn-FSD-4 are shown in inset of Fig. 3. With the concentration of Mn-FSD-1 increasing, the MRI of Mn-FSD-1 gradually became brighter, demonstrating concentration-dependent signal enhancement effects. Further, the transverse relaxivity (r1) for Mn-FSD-1 can be calculated to be 4.95 L· mmol-1·s-1 according to the linear concentration-dependent effect in Fig. 3. This value was relatively high compared with the relaxivities for most Mn-based MRI agents shown in Table S1. This may be attributed to the 2D network structure of as-prepared Mn-FSD-4, which allows the direct interaction between the Mn2+ and surrounding water protons and is beneficial to T1 relaxivity. The result indicates that Mn-FSD-4 is a good T1-weighted contrast agent for MRI. Inspired by these properties, the cell viability of Mn-FSD-4 was further explored. As shown in Fig.S7, Mn-FSD-4 displayed low cytotoxicity to HL-7702 cells and A549 cells. When the concentration was 12.5 µg·mL-1, the cell viability of A549 cells and HL-7702 cells was over 80% and 70%, respectively.
Inset: T1-weighted MRI of Mn-FSD-4 with diverse Mn concentrations in vitro
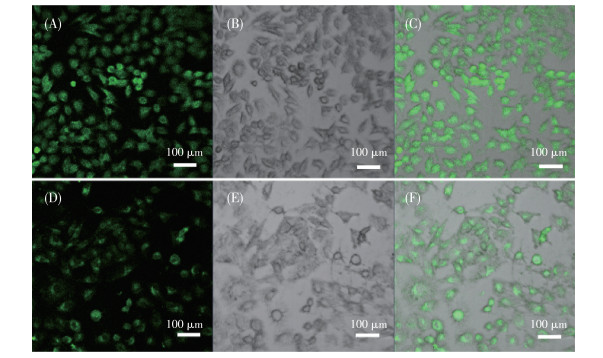
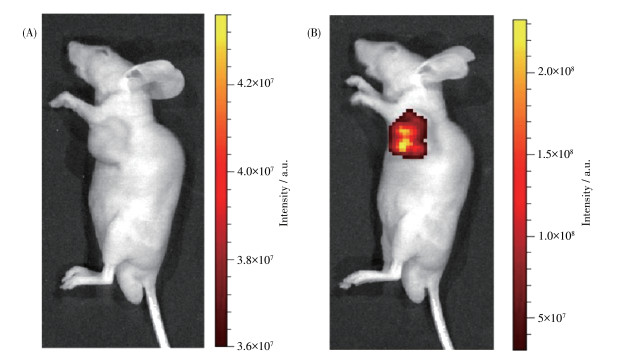
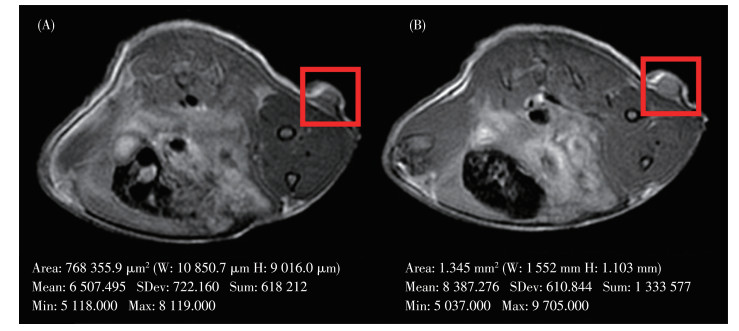
Given their favorable in vitro cytotoxicity, we carried out fluorescence imaging tests on HL-7702 cells and A549 cells. As shown in Fig. 4, bright green fluorescence can be observed in both HL-7702 cells and A549 cells after incubating with Mn-FSD-4 for 4 h, confirming that Mn-FSD-4 can enter into HL-7702 cells and A549 cells for fluorescence imaging. The bioimaging capability of Mn-FSD-4 was further investigated on the tumor bearing mice. As expected, after intratumoral injection, the tumor exhibited strong fluorescence (Fig. 5). Furthermore, in vivo MRI is shown in Fig. 6. Apparently, after intratumoral injection, T1-weighted MRI displayed intense contrast enhancement and the tumor became brighter. Briefly, Mn-FSD-4 displays good OI and T1-weighted MRI ability.
The left panels show dark-field fluorescence images, the middle panels show the corresponding bright-field images and the right panels are overlays of the left and middle panels
The biodistribution of Mn-FSD-4 in major organs were also investigated and are shown in Fig. 7, which have a decisive influence on the possible side effects. Apparently, Mn-FSD-4 were heavily distributed in liver and kidney after intraperitoneal injection for 15 h. It is worth noting that the fluorescence intensity at liver and kidney site significantly decreased after 30 h, indicating that almost all Mn-FSD-4 were metabolized. Thus, Mn-FSD has good dispersion and fast metabolism in vivo applications. And the XRD of Mn-FSD after soaking for 24 h in PBS with different pH values are shown in Fig.S8. Clearly, XRD patterns of Mn-FSD after soaking in PBS with different pH values (3, 5, 7 and 8) for 24 h agreed well with the original Mn-FSD, suggesting that Mn-FSD is stable under physiological conditions.
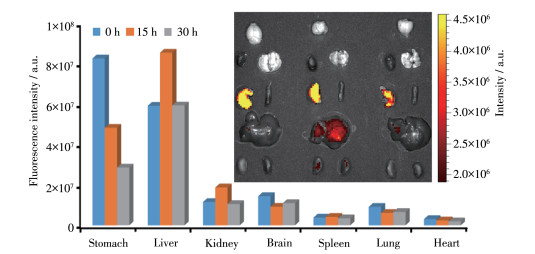
Inset: ex vivo fluorescence imaging of different organs at 15 and 30 h point post-injection
In summary, this work shows that a novel MRI and OI bimodal probe can be developed via a simple onepot method through the combination of metal ions with ligand for the first time. The size of Mn-FSD can be controlled to 100 nm for biological application. As expected, micro-nanoscale Mn-FSD displayed good biocompatibility. More importantly, the Mn-FSD showed high fluorescence emission at around 520 nm under the excitation of about 445 nm, effectively realizing fluorescence imaging in cell and in vivo. Additionally, micro-nanoscale Mn-FSD also showed high relaxivity values, exhibiting good performance in MRI. Overall, this work integrated a MOF as a novel MRI and OI dual-mode imaging reagent via a simple and gentle process. It is also expected that the methods in this work paves the way for self-assembly of multifunctional MOFs based on metal ions and organic ligands for using in biomedicine.
Liu Y L, Tang Z Y. Adv. Mater. , 2013, 25: 5819-5825 doi: 10.1002/adma.201302781
He L C, Liu Y, Liu J Z, Xiong Y S, Zheng J Z, Liu Y L, Tang Z Y. Angew. Chem. Int. Ed. , 2013, 52: 3741-3745 doi: 10.1002/anie.201209903
Zhao M T, Deng K, He L C, Liu Y, Li G D, Zhao H J, Tang Z Y. J. Am. Chem. Soc. , 2014, 136: 1738-1741 doi: 10.1021/ja411468e
Cohen S M. Chem. Rev. , 2012, 112: 970-1000 doi: 10.1021/cr200179u
Ryder M R, Tan J C. Mater. Sci. Technol. , 2014, 30: 1598-1612 doi: 10.1179/1743284714Y.0000000550
An H D, Li M M, Gao J, Zhang Z J, Ma S Q, Chen Y. Coord. Chem. Rev. , 2019, 384: 90-106 doi: 10.1016/j.ccr.2019.01.001
Lian X B, Xu L L, Chen M D, Wu C E, Li W J, Huang B B, Cui Y. J. Nanosci. Nanotechnol. , 2019, 19: 3059-3078 doi: 10.1166/jnn.2019.16647
Lin R B, Xiang S C, Li B, Cui Y J, Qian G D, Zhou W, Chen B L. Coord. Chem. Rev. , 2019, 384: 21-36 doi: 10.1016/j.ccr.2019.01.009
Seetharaj R, Vandana P V, Arya P, Mathew S. Arabian J. Chem. , 2019, 12: 295-315
Zhang Z, Sang W, Xie L S, Dai Y L. Coord. Chem. Rev. , 2019, 399: 213022
Wang D D, Zhou J J, Chen R H, Shi R H, Zhao G Z, Xia G L, Li R, Liu Z B, Tian J, Wang H J, Guo Z, Wang H B, Chen Q W. Biomaterials, 2016, 100: 27-40 doi: 10.1016/j.biomaterials.2016.05.027
Li Y T, Tang J L, He L C, Liu Y, Liu Y L, Chen C Y, Tang Z Y. Adv. Mater. , 2015, 27: 4075-4080 doi: 10.1002/adma.201501779
Gao X C, Zhai M J, Guan W H, Liu J J, Liu Z L, Damirin A. ACS Appl. Mater. Interfaces, 2017, 9: 3455-3462 doi: 10.1021/acsami.6b14795
Parrott D, Fernando W S, Martins A F. Inorganics, 2019, 7: 18-39 doi: 10.3390/inorganics7020018
Erstad D J, Ramsay I A, Jordan V C, Sojoodi M, Fuchs B C, Tanabe K K, Caravan P, Gale E M. Invest. Radiol. , 2019, 54: 697-703 doi: 10.1097/RLI.0000000000000593
Gale E M, Atanasova I P, Blasi F, Ay I, Caravan P. J. Am. Chem. Soc. , 2015, 137: 15548-15557 doi: 10.1021/jacs.5b10748
Arhangelskis M, Eddleston M D, Reid D G, Day G M, Bučar D K, Morris A J, Jones W. Chem. Eur. J. , 2016, 22: 10065-10073 doi: 10.1002/chem.201601340
Zhuang J, Kuo C H, Chou L Y, Liu D Y, Weerapana E, Tsung C K. ACS Nano, 2014, 8: 2812-2819
Gedrich K, Heitbaum M, Notzon A, Senkovska I, Frohlich R, Getzschmann J, Mueller F, Glorius F, Kaskel S. Chem. Eur. J. , 2011, 17: 2099-2196
Maity K, Mukherjee D, Sen M, Biradha K. ACS Appl. Nano Mater. , 2019, 2: 1614-1620
Jiang D L, Xing C S, Liang X M, Shao L Q, Chen M. J. Colloid Interface Sci. , 2016, 461: 25-31
Bhattarai R M, Pandiyarajan S M S, Saud S, Kim S J, Mok Y S. Dalton Trans. , 2020, 49: 14506-14519

Figure 1 SEM images of Mn-FSD with different sizes and morphologies: (A) Mn-FSD-1, (B) Mn-FSD-2, (C) Mn-FSD-3, (D) Mn-FSD-4

Figure 2 XRD patterns of Mn-FSD with different sizes and morphologies: (A) simulated, (B) Mn-FSD-1, (C) Mn-FSD-2, (D) Mn-FSD-3, (E) Mn-FSD-4

Figure 3 Relaxation rate 1/T1 vs concentration of Mn-FSD-4 at 3.0 T and 25 ℃
Inset: T1-weighted MRI of Mn-FSD-4 with diverse Mn concentrations in vitro

Figure 4 Fluorescence imaging of HL-7702 cells (A~C) and A549 cells (D~F) after being incubated with Mn-FSD-4 for 4 h
The left panels show dark-field fluorescence images, the middle panels show the corresponding bright-field images and the right panels are overlays of the left and middle panels

Figure 5 Fluorescence imaging of tumor-bearing athymic nude mice without Mn-FSD-4 (A) and with Mn-FSD-4 after intratumoral injection for 1 h (B)

Figure 6 T1-weighted MRI of tumor-bearing athymic nude mice without Mn-FSD-4 (A) and with Mn-FSD-4 after intratumoral injection for 4 h (B)

 扫一扫看文章

扫一扫关注我们
 下载:
下载:
 下载:
下载:

 下载:
下载: