
Figure 1.
SEM images of Ag3PO4 (a), MoSe2 (b), MoSe2/Ag3PO4 (c) and the used MoSe2/Ag3PO4 (d)
MoSe2/Ag3PO4 Composites: Preparation and Photocatalytic Properties for Degradation of Rhodamine B under Visible Light
Xin-Gang WANG , Kai LIU , Hui ZHU , Chong-Yu LI , Lei-Lei LIN , Feng GUO , Hong-Liang DAI

With rapid industrialization and growing population, environment pollution has become the greatest challenge for human being in modern society. Sunlightdriven semiconductor photocatalysis is a"green"and promising environmental remediation technology. Semiconductor photocatalysis technology uses sunlight as an energy source and semiconductor materials as a photocatalyst[1-3]. Converting light energy into other energy, oxygen and water molecules stimulate city free radicals[4-5]. The free radical has high oxidizing property and can effectively degrade organic pollutants adsorbed on the surface of the catalyst[6-7]. It is a novel and environmentally friendly treatment technology, and has potential application prospects in the degradation of dye wastewater in recent years[8-9].
In 2010, Ye′s research group reported that silver phosphate (Ag3PO4) can absorb sunlight with a wavelength of less than 520 nm and has a quantum yield more than 90%[10]. Although Ag3PO4 shows strong advantages in terms of catalysis, it still has a series of drawbacks including higher cost of Ag3PO4 preparation and poor photocatalytic stability. The photocatalytic effect of Ag3PO4 decreases significantly restricting its development in the field of photocatalysis with the increase of cycle times[11-13]. Photoelectrons are generated due to the microscopic Ag3PO4 in water when the catalyst is exposed to light. The dissolved Ag+ will be reduced to Ag, and Ag deposits on the surface of the catalyst, which hinders the light absorption of the catalyst. Therefore, the modification of Ag3PO4 has become a research hotspot[14].
The transition metal chalcogenide is a generic term for compounds composed of transition metal atoms and chalcogenide atoms. Many of them have a structure similar to graphite[15]. Studies have shown that transition metal chalcogenide nanomaterials have a narrow band gap. Therefore, they have a wide range of applications in catalysis, battery electrodes, lubrication, sensors and water treatment[16-17]. At present, a variety of ligands and Ag3PO4 compound materials have been prepared because they have excellent effects in the field of photocatalytic degradation. Such as Ag3PO4/MoO3 [18], BiVO4/RGO/Ag3PO4[19], Ag3PO4/GO[20], g-C3N4/Carbon nanotubes/Ag3PO4 (g-C3N4/CNTs/Ag3PO4) [21]. Layer-structured transition metal dichalcogenides like MoS2 and MoSe2 have been tested as photocatalysts, due to their unique structures, narrow band gaps and weak Van der Waals interactions between neighboring layers[22-23]. Molybdenum selenide (MoSe2) is composed of Mo atoms sandwiched between two layers of hexagonally close-packed Se atoms in a layered structure with a band gap of 1.7~1.9 eV. Furthermore, MoSe2 possesses a high resistance to photocorrosion, as the optical transitions are between nonbonding metal states. MoSe2 is a semiconductor material with good electron mobility, which can combine with Ag3PO4 to transfer electrons using the high electron mobility of MoSe2 to reduce the formation of Ag element, thus improving the recycling capacity of the catalyst[24].
In this work, we aimed to synthesize a novel MoSe2/Ag3PO4 photocatalyst through a facile and mild hydrothermal approach. The photocatalytic activity was evaluated by the degradation of RhB under the visible light (λ > 420 nm) irradiation. Scan electron microscope (SEM), X-ray diffraction (XPS), X-ray photoelectron spectroscopy (XRD) and UV-Vis was used to detect the characteristics of the as-prepared materials. The photocatalytic mechanism of the MoSe2/Ag3PO4 was investigated by the radical trapping experiments. The photogeneration intermediates products were analyzed using liquid chromatography/mass spectrometry (LC/MS) technology. The photocatalytic cycling experiments were employed to assess the stability of photocatalysts.
All chemicals in this study were of analytical grade without any further purification. Selenium powder (Se), sodium molybdate (Na2MoO4·2H2O), silver nitrate (AgNO3), sodium hydroxide (NaOH), hydrochloric acid (HCl, mass fraction of 36%), absolute ethanol (C2H6O), dibasic sodium phosphate (Na2HPO4) were obtained from Sino Pharm Chemical Reagent. Sodium borohydride (NaBH4) was obtained from Rich Joint Co., Ltd.
Synthesis of MoSe2 by hydrothermal method. In a typical synthesis, 0.225 g NaBH4, 0.476 5 g Na2MoO4 and 0.311 g Se powder dissolved into 80 mL deionized water stirring for 60 min to produce a uniform dispersion. The resulting solution was poured into a 100 mL Teflon-lined stainless-lsteel reactor and treated at 220 ℃ for 24 h. The upper liquid was poured out, and the bottom black product was collected, centrifuged and washed multiple times, in order to remove the excess selenium in the reaction, and the dried black powder was added to 60 mL NaOH solution and treated at 80 ℃ for 2 h. After cooling naturally to room temperature, the supernatant liquid was poured off, and the bottom product was collected, washed 6 times with deionized water and anhydrous alcohol, and finally dried at 80 ℃ for 24 h to obtain MoSe2[25-28].
A typical MoSe2/Ag3PO4 heterojunction was prepared as follows: 20 mg as-prepared MoSe2 was dispersed in 30 mL deionized water and the solution was sonicated for 30 min to obtain a uniform black dispersion. The AgNO3 solution was magnetically stirred and added dropwise to the dispersion. After the addition was completed, the solution was stirred for 60 min, so that Ag+ can be fully absorbed on the surface of MoSe2, and then the Na2HPO4 solution was added drop by drop. Magnetic stirring continued for 2 h after the addition was completed, then the supernatant was decanted, and the bottom product was collected. The product was washed three times with alcohol and dried in the dark at 60 ℃ for 12 h to obtain the MoSe2/Ag3PO4 complex, prepared according to the amount of control AgNO3 and Na2HPO4 solution. The mass ratios of MoSe2 and Ag3PO4 were 1:20, 1:10, 1:5, 1:1 and 2:1. The color of the complex gradually deepened with increasing MoSe2 content. As a comparison, pure Ag3PO4 was prepared without addition of MoSe2.
MoSe2/Ag3PO4 composite (1:5) was used in the characterization. The photocatalysts were analyzed by XRD on a Bruker D8 diffractometer employing Cu Kα radiation (λ=0.154 07 nm, 40 kV, 40 mA, 5 (°)·min-1 from 10° to 80°). Elemental compositions were determined by XPS on an ESCALAB 250 Xi X-ray photoelectron spectrometer employing Mg Kα radiation. The morphology and structure of as-prepared samples were analyzed using a SU 8220 field emission SEM and an S-4800 (Hitachi, Japan) operating at 30 kV. UV-Vis absorption spectra of the samples were measured on a UV-Vis spectrophotometer (Shimadzu UV-2450, Japan) in a range of 200~800 nm with fine BaSO4 powder as reference.
MoSe2/Ag3PO4 hybrid materials samples have been evaluated under the visible light irradiation for RhB degradation. Before the irradiation, the solutions have been stirred to achieve absorption-desorption equilibrium in the dark. At the setting intervals, 5 mL suspension has been taken out and analyzed with an UV-Vis spectrophotometer (Shimadzu UV-2450) at 554 nm.
The photocatalytic degradation efficiency (E) was obtained by the following formula:
|
|
(1) |
The kinetic constant (k) was obtained by the following formula:
|
|
(2) |
Where c is the concentration of RhB at different times, c1 is the initial concentration of RhB, c0 is the initial concentration of RhB after adsorption equilibrium, A and A1 are the corresponding absorbances.
Scavengers were added in the photocatalytic degradation process of RhB, where 2-propanol, ammonium oxalate and benzoquinone were added into the photocatalytic test to capture hydroxyl radicals (·OH), holes (h+) and superoxide radicals (·O2-), respectively.
LC/MS technology was used to identify intermediates in the photocatalytic oxidation of RhB. The photogeneration intermediates in the RhB solution were separated by high-performance liquid chromatography (Ultimate 3000 UHPLC-Q Exactive, Thermo Scientific, USA), using a C18 reversed phase column (100 mm× 4.6 mm, 5 μm) at 40 ℃ with an injection volume of 5 μL. The mobile phase composition was formic acid/methanol (40:60, V/V) at a flow rate of 0.6 mL·min-1.
Fig. 1 shows the morphology and structure of the Ag3PO4, MoSe2, MoSe2/Ag3PO4 and the used MoSe2/Ag3PO4, respectively. Fig. 1a shows the well-dispersed Ag3PO4 particles with average size of 50 nm. Fig. 1b displays the MoSe2 micro-flower balls. It is clearly showing that the micro-flower ball was composed of sheet structure. Fig. 1c reveals the SEM image of MoSe2/Ag3PO4 binary composites containing the Ag3PO4 nanoparticles and MoSe2 micro-flowers. After the introduction of MoSe2 in the system, the Ag3PO4 particles size was 40 nm, which would be attributed to hydroxyl and carboxyl groups on MoSe2 basal planes and edges that could easily confine the nucleation of Ag3PO4 nanoparticles and the growth of Ag3PO4 nanoparticles on its surface. The size of composite was reduced, thereby the specific surface area was increased and the contact area with the catalyst was expanded, which increased the photocatalytic efficiency. Fig. 1d indicates that the composite material had no obvious change after use.
Fig. 2 shows the XRD patterns of MoSe2, Ag3PO4, MoSe2/Ag3PO and the used MoSe2/Ag3PO4, respectively. As shown in curve (a), characteristic peak at 13.7°, 31.9°, 38.0° and 56.2° correspond to (002), (100), (103) and (110) crystal planes of MoSe2[29]. As shown in curve (c), the characteristic peak at 21.9°, 29.7°, 33.3°, 36.6°, 42.5°, 47.8°, 52.7°, 55.2°, 57.3°, 62.1°, 69.9°, 71.9° and 73.9° correspond to (110), (200), (210), (211), (220), (310), (222), (320), (321), (400), (420), (421) and (332) crystal planes of Ag3PO4, respectively[30-33]. All peaks of Ag3PO4 correspond to the cubic crystal structure according to the standard card (PDF No. 06-0505). There was no impurity peak indicating that the Ag3PO4 prepared by this method was very pure. As shown in Fig. 2, the characteristic peak of MoSe2 was not obvious, while that of Ag3PO4 was obvious. Therefore, the peak of Ag3PO4 was dominant in the composites, and the weaker MoSe2 was covered by Ag3PO4. So, no obvious characteristic peak of MoSe2 can be seen in the XRD patterns of binary complexes. The XRD patterns can confirm that the introduction of MoSe2 made little difference on Ag3PO4 crystalline structure. The well-dispersed Ag3PO4 particle, both in the pristine and nanocomposite samples, exhibited a high degree crystallinity.
Fig. 3a shows the XPS survey spectrum of MoSe2/Ag3PO4, and peaks of Ag, P, Mo, Se and O element appeared in the binary MoSe2/Ag3PO4 composites. The binding energy of O1s in Fig. 3b was 531.7 eV, corresponding to the valence of -2, which indicated that O was derived from Ag3PO4. In Fig. 3c, the binding energy of P2p was 132.9 eV, and the corresponding element valence is +5. As exhibited in Fig. 3d, the characteristic peak at 54.2 and 55.3 eV could be seen, corresponding to Se3d3/2. The corresponding element valence is -2. In Fig. 3e, Mo3d5/2 and Mo3d3/2 are corresponded to 228.7 and 231.5 eV, respectively, which indicated that Mo is +4. The appearance of valences indicated the presence of MoSe2 in the complex. In Fig. 3f, the binding energies of Ag3d2/3 and Ag3d5/2 were located at 373.5 and 367.5 eV, respectively, indicating that the valence of the Ag ion is +1[34-35]. The above results proved the formation of MoSe2/Ag3PO4.

Fig. 4a shows the UV-Vis spectra of MoSe2, Ag3PO4 and MoSe2/Ag3PO4, to study their optical absorption properties, respectively. The light absorbing boundary of single Ag3PO4 was located at 543 nm. When the MoSe2 was introduced in the system to form the binary MoSe2/Ag3PO4, the light absorption range was obviously enhanced that accounted for excellent visible light absorption of MoSe2, which significantly improved the visible light adsorption for effective target pollute degradation. To gain some insights into the migration and separation of photogenerated carriers in the photocatalyst, photo-electrochemical characterizations (photocurrent responses and electrochemical impedance spectra, EIS) were carried out[36]. As shown in Fig. 4b, the MoSe2/Ag3PO4 performed the highest photocurrent intensity. For semicircle diameter in EIS Nyquist plot, the smaller semicircle diameter shows the lower resistance. In Fig. 4c, we can see that the MoSe2/Ag3PO4 had more efficient photogenerated electron transfer.

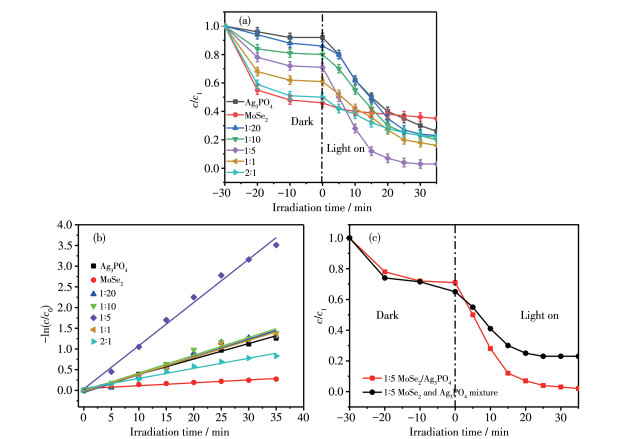
Fig. 5a shows the catalytic activity of binary MoSe2/Ag3PO4 with different mass ratios for RhB (10 mg·L-1) degradation under visible light irradiation. We found that the introduction of MoSe2 could enhance the RhB degradation efficiency, and the champion combination of the MoSe2 and Ag3PO4 (1:5) could reach to 98% for RhB degradation under visible light irradiation within 30 min. The photocatalytic efficiencies of the composites were greater than those of the pure Ag3PO4, demonstrating that the photocatalytic performance of the composites is better than that of the monomer Ag3PO4[37]. When the dark reaction occurred for the first 30 min, pure Ag3PO4 had almost no effect on the removal of RhB, and all proportions of MoSe2/Ag3PO4 materials had obvious adsorption effect on RhB. The reason was that the prepared Ag3PO4 had a smooth surface and poor adsorption performance, when the content of MoSe2 increased, the flower-like structure of MoSe2 showed good adsorption performance, and the adsorption of dye molecules on the surface was very good. After the adsorption tended to balance, the photocatalysis played a major role. However, when the MoSe2 ratio was too large, MoSe2 could wrap on the surface of Ag3PO4, resulting in a decrease in light transmission performance, which affected degradation efficiency. When the mass ratio of MoSe2 to Ag3PO4 was 1:5, the complex degraded the target pollutant at the highest rate. Fig. 5b shows the kinetic constants (k) of the as prepared products. The k value of MoSe2/Ag3PO4 composite (1:5) (0.122 5 min-1) was 3.1 times higher than that of pristine Ag3PO4 (0.039 5 min-1). As shown in Fig. 5c, the photocatalytic reduction of RhB by MoSe2/Ag3PO4 composite was better than that by mechanical mixing. In the dark reaction stage, due to the complex of MoSe2 and Ag3PO4, the adsorption sites of MoSe2 became less and the adsorption effect became worse.
Quality of catalyst: 10 mg; initial concentration of RhB: 10 mg·L-1; volume of solution: 100 mL; pH: neutral; temperature: room temperature
The pH in the printing and dyeing wastewater is not a fixed value in actual use. By changing the pH of the RhB, the degradation effect in the actual use process was simulate. The pH of the dye solution was adjusted to 5, 6, 7, 8, and 9 using hydrochloric acid and sodium hydroxide. In Fig. 6a, the final photocatalytic efficiency was 98% at any pH. However, with the decrease of pH, it took longer to reach the photocatalytic endpoint (pH < 7). The degradation rate was faster, and the degradation end could reach about 30 min of light when pH > 7. The reason is that the solution is acidic and contains a large amount of H+ when pH < 7, which makes MoSe2 surface presence a large number of cations. RhB is a cationic type of dye, which also has a positive charge in the solution. The molecules and the adsorbent will repel each other, and the presence of H+ will compete with the dye for adsorption, so the enrichment of the dye molecules on the catalyst surface will be reduced, so it takes longer to reach the end of degradation. The H+ concentration in the liquid gradually decreases when pH > 7, the electrostatic effect gradually weakens, and the competitive adsorption slowly weakens, so the photocatalytic degradation end will come earlier than before. Fig. 6b shows the fitted linear equations for the different pH values of RhB, and the variations of k value was similar to photocatalytic efficiency.

Quality of catalyst:10 mg; initial concentration of RhB: 10 mg·L-1; volume of solution: 100 mL; temperature: room temperature
The initial concentration of pollutants has a great impact on the degradation efficiency. We have configured dyes with a concentration of 5, 10, 15, 20 and 25 mg·L-1, respectively. MoSe2/Ag3PO4 composite (1:5) was used for degradation experiments. As shown in Fig. 7a, when the dye concentration was low (5 mg·L-1), the dark reaction part removed most of the dye molecules. After 30 min of visible light irradiation that the final degradation rate was above 99%. As the dye concentration increased, the degradation rate dropped dramatically. When the RhB dye concentration was as high as 25 mg·L-1, only 34% of the dye degraded after 30 min of light exposure. Since the dye concentration was too large, the chromaticity of the solution increased, resulting in a decrease in the transmittance of the solution, hindering the transmittance of light, resulting in a decrease in photocatalytic efficiency. The linear fitting equation and kinetic constants (k) of MoSe2/Ag3PO4 obtained with different RhB concentrations are shown in Fig. 7b, and the k value of 10 mg·L-1 (0.122 5 min-1) was 11.67 times higher than that of 25 mg·L-1 (0.010 5 min-1).

Quality of catalyst:10 mg; volume of solution: 100 mL; pH: neutral; temperature: room temperature
The temperature of printing and dyeing wastewater is generally very high, but temperature has a great influence on photocatalytic system. If the temperature of the water is too low, it will cause the company′s cooling equipment to occupy too much space and increase the treatment cost. By changing the water temperature (15, 20, 25, 30, 35 and 40 ℃) of RhB dye, the degradation effect in actual use was simulated. MoSe2/Ag3PO4 composite (1:5) was used for degradation experiments. In Fig. 8a, the degradation rate of RhB (10 mg·L-1) could reach 98% at different temperatures, which was consistent with the previous experimental results, but the time to reach the end of degradation was different. When the reaction temperature was 15 ℃, it took 35 min to complete the reaction, but when the temperature was increased, the degradation end came early, only 25 min at 20 ℃. When the temperature continued to rise, the reaction rate continued to decline. When the water temperature reached 40 ℃, it took more than 45 min to degrade 98.2% of the dye. Although it is conducive to the photocatalytic reaction, too low temperature could also cause the thermal motion of the molecules to slow down when the water temperature was lower than room temperature. The stirring speed must also be increased accordingly to ensure that the dye molecules and the photocatalyst were in full contact. When the temperature was too high, the speed of molecular thermal motion was accelerated, but the dissolved oxygen content in water could be reduced, and the amount of ·O2- generated by light excitation could be reduced accordingly, affecting the photocatalytic efficiency. Most of the dye wastewater is high temperature, and the discovery of this experimental phenomenon has practical application value. Based on this phenomenon, we can appropriately increase the temperature of the photocatalytic reaction and reduce the area and cost of the cooling equipment. Fig. 8b shows the fitted linear curves at different temperatures of RhB, and the k value at 20 ℃ (0.145 3 min-1) was 2.02 times higher than that of 40 ℃ (0.072 min-1).

Quality of catalyst:10 mg; initial concentration of RhB: 10 mg·L-1; volume of solution: 100 mL; pH: neutral
It is worth to point out that the stability of the photocatalysts plays a significant role in its practical application. Since Ag3PO4 is unstable and can be easily corroded by visible-light irradiation because of the reduction of silver ions (Ag+) to silver (Ag) by the photogenerated electrons if no sacrificial reagent is involved. As shown in Fig. 9a, the pure Ag3PO4 catalyst showed poor stability for RhB degradation after 4 cycles run (cumulative use of 280 min), only remaining 5% of the degradation rate. At the same time, the binary composite obtained with the mass ratio of 1:5 came with no apparent decline, and the degradation rate remained 89%. It is implied that the composite photocatalysis had good cycle stability. From Fig. 9b, it can be seen that there was no obvious change in the XRD pattern of the MoSe2/Ag3PO4 composite before and after use except at 37°. The impurity peak of the composite at about 37° was the peak of Ag produced by Ag3PO4 in the case of illumination.

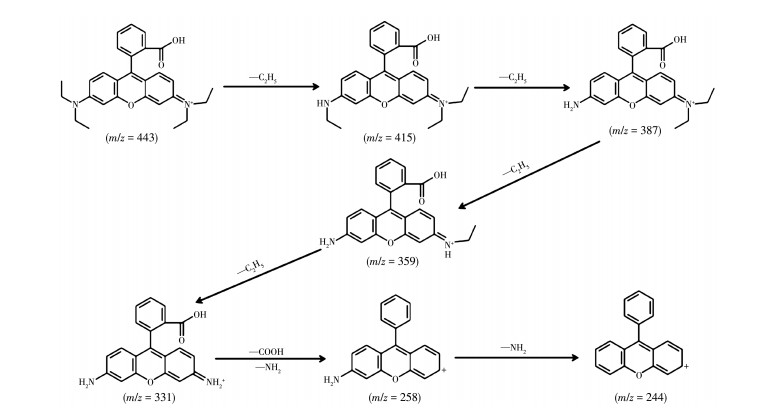
To explore the photodegradation products of RhB, the reaction intermediates during the photocatalytic process were detected by LC/MS technique. The absorption spectrum changed with time evolution during the photocatalytic degradation of RhB in MoSe2/Ag3PO4 composites obtained with the mass ratio of 1:5 is illustrated in Fig. 10. It was found that in the presence of the MoSe2/Ag3PO4 photocatalyst, the color of the suspension became colorless after 35 min. To further explore the degradation process of RhB, the main intermediate products of RhB degradation were identified by LC/MS technology, and the molecular-ion and fragment-ions of N-de-ethylated intermediates are shown in Table S1 and Fig. S1. Combining the measured intermediate products, a possible degradation pathway of RhB is demonstrated in Fig. 11. The photocatalytic degradation of RhB dyes mainly included two competitive pathways: N-de-ethylation and the cleavage of the conjugated structure[38-40]. Firstly, RhB (m/z= 443) was readily attacked by h+ and ·O2- free radicals, so that the ethyl group was broken and converted into N-(9-(2-carboxyphenyl)-6-(ethylamino)-3H-xanthen-3ylidene)-N-ethylethanaminium (m/z=415) and N-(6-amino-9-(2-carboxyphenyl)-3H-xanthen-3-ylidene) N-ethylethanaminium (m/z=387). As the decomposed carbon-nitrogen bond splits further, it formed 9-(2-carboxyphenyl)-6-(ethylamino)-3H-xanthen-3-iminium (m/z=359) and 6-amino-9-(2-carboxyphenyl)-3H-xanthen-3-iminium (m/z=331). Subsequently, 6-amino-9-(2carboxyphenyl)-3H-xanthen-3-iminium (m/z=331) was decomposed into smaller molecules (6-amino-9-phenylcyclopenta-chromenylium, m/z=258) by that the carboxyl group immediately fell off and the conjugated structure quickly collapsed. Eventually, the intermediate product was broken down into smaller molecules ((cyclohexa-2, 5-dien-1-ylidenemethylene) dibenzene, m/z=244). As chromophores such as azo bond presented in RhB gradually cleaved completely, the solution changed from rose red to colorless.

The active species in the degradation of RhB could be determined by trapping experiments in MoSe2/Ag3PO4. Ammonium oxalate, benzoquinone and 2propanol were employed to capture holes (h+), superoxide radical (·O2-) and hydroxyl radical (·OH), respectively. As shown in Fig. 12, after adding ammonium oxalate, the final degradation rate decreased to 39.7%. When benzoquinone was present, the degradation rate was still 61.5%. When 2-propanol was added to the system, the degradation rate was as high as 89.4%. Thus, we can draw a conclusion that h+ plays the main role in RhB degradation, immediately followed by ·O2- and ·OH active species. We utilize electronspinresonance spectroscopy (ESR) to verify the ·O2- generated in the photocatalytic process. In Fig. 12b, no ESR signals could be found under dark condition. However, under visible light irradiation, the characteristic signal of ·O2- appeared, and with the increase of irradiation time (from 3 to 8 min), the signal intensity gradually increased, which revealed that ·O2- could be generated in the photocatalytic degradation reaction and participate in the photocatalytic degradation reaction[41-43].

Based on the results of the reactive-speciestrapping experiments and ESR spectra, the possible degradation mechanisms of the MoSe2/Ag3PO4 composite was studied and shown in Fig. 13. Owing to different potentials of MoSe2 (ECB=-0.93 eV and EVB=0.98 eV) and Ag3PO4 (ECB=0.29 eV and EVB=2.64 eV), where ECB and EVB are the conduction and valance band edge potentials, it is obvious that the CB and VB of MoSe2 were higher than that of Ag3PO4, respectively. Normally, two photo-degradation mechanisms may be proposed (conventional type Ⅱ mechanism and Z-scheme mechanism). However, the charge transfer pathway of this work does not conform to the type Ⅱ mechanism. This is because the electrons on the CB of Ag3PO4 cannot reduce O2 to yield ·O2- (more positive potential of the CB of Ag3PO4 than O2/·O2-, -0.33 eV). Conversely, ·O2- is the main active species, implying the electrons on the CB of MoSe2 react with O2 to produce·O2-. Therefore, Z-scheme mechanism is more reasonable for the prepared composite. As shown in Fig. 13, under the excitation of visible light, the electrons present in the VBs of MoSe2 and Ag3PO4 are excited to their CBs, respectively, leaving h+ on their VBs. For one thing, the electrons in the CB of Ag3PO4 combine with the holes on the VB of MoSe2. For another, the electrons in the CB of MoSe2 readily move to its surface to reduce O2 to ·O2-, and holes leaving in the VB of Ag3PO4 will directly oxidize RhB to form corresponding degradation products.
Successfully synthesized binary MoSe2/Ag3PO4 composite photocatalyst was employed for RhB degradation under visible light irradiation. Ag3PO4 acted as the photosensitizer for visible light adsorption and MoSe2 was introduced to protect Ag3PO4 from photocorrosion and simultaneously acted as electron acceptor favorable for effective e--h+ separation. The catalytic capability of binary MoSe2/Ag3PO4 composite was evaluated by degradation of RhB and the degradation rate could reach to 98% after 30 min under visible light irradiation. MoSe2/Ag3PO4 achieved 89% of the degradation under visible light irradiation after four regenerations. The active species in the degradation process were studied by trapping experiments, and it was found that both h+ and ·O2- play important roles in the degradation process. Overall, this work not only provides an effective and simple approach to fabricate an Ag3PO4-based binary heterojunction system, but also gives deeper insight into the mechanism for efficient visible-light photodegradation, which enables us to establish a strategy to design better photocatalysts.
Supporting information is available at http://www.wjhxxb.cn
Fujishima A, Honda K. Nature, 1972, 238:37-38 doi: 10.1038/238037a0
Harir M, Gaspar A, Kanawati B, Fekete A, Frommberger M, Martens D, Kettrup A, El Azzouzi M, Schmitt-Kopplin P. Appl. Catal. B, 2008, 84:524-532 doi: 10.1016/j.apcatb.2008.05.010
杨传锋, 腾伟, 宋艳华, 崔言娟.催化学报, 2018, 39:1615-1624YANG C F, TENG W, SONG Y H, CUI Y J. Chin. J. Chem., 2018, 39:1615-1624
Montoya J F, Velásquez J A, Salvador P. Appl. Catal. B, 2009, 88:50-58 doi: 10.1016/j.apcatb.2008.09.035
Lin Y X, Ferronato C, Deng N S, Chovelon J M. Appl. Catal. B, 2011, 104:353-360 doi: 10.1016/j.apcatb.2011.03.006
Wang H J, Chen X Y. J. Hazard. Mater., 2011, 186:1888-1892 doi: 10.1016/j.jhazmat.2010.12.088
Vaiano V, Iervolino G. J. Colloid Interface Sci., 2018, 518:192-199 doi: 10.1016/j.jcis.2018.02.033
Baia L, Orbán E, Fodor S, Hampel B, Kedves E Z, Saszet K, Szekely I, Karacsonyi E, Reti B, Berki P, Vulpoi A, Magyari K, Csavdari A, Bolla C, Cosoveanu V, Hernadi K, Baia M, Dombi A, Danciu V, Kovacs G, Pap Z. Mater. Sci. Semicond. Process, 2015, 42:66-71
Kalikeri S, Kamath N, Gadgil D J. Environ. Sci. Pollut. Res., 2017, 25:3731-3744
Yi Z G, Ye J H, Kikugawa N, Kako T, Ouyang S, Stuart-Williams H, Yang H, Cao J Y, Luo W J, Li Z S. Nat. Mater., 2010, 9:559-564 doi: 10.1038/nmat2780
Wang H, Bai Y S, Yang J T, Lang X F, Li J H, Lin G. Chem. Eur. J., 2012, 18:5524-5529 doi: 10.1002/chem.201103189
Ge M, Zhu N, Zhao Y P, Li J, Liu L. Ind. Eng. Chem. Res., 2012, 51:5167-5173 doi: 10.1021/ie202864n
Wang K, Hua X, Xu J. J. Mol. Catal. A:Chem., 2014, 393:302-308 doi: 10.1016/j.molcata.2014.06.026
Bian L L, Liu Y J, Zhu G X, Yan C, Zhang J H, Yuan A H. Ceram. Int., 2018, 44:7580-7587 doi: 10.1016/j.ceramint.2018.01.172
Yang J H, Yao H X, Liu Y Q, Zhang Y J. Nanoscale Res. Lett., 2008, 3:481-485 doi: 10.1007/s11671-008-9183-8
Voiry D, Yamaguchi H, Li J W, Silva R, Alves D C B, Fujita T S, Chen M W, Asefa T, Shenoy V B, Eda G. Nat. Mater., 2013, 12:850-855 doi: 10.1038/nmat3700
Li X, He X Y, Shi C M, Liu B, Zhang Y Y, Wu S Q, Zhu Z Z, Zhao J B. ChemSusChem, 2014, 7:3328-3333 doi: 10.1002/cssc.201402862
Teng W, Tan X J, Li X Y, Tang Y B. Appl. Surf. Sci., 2017, 409:250-260
Li Y, Xiao X Y, Ye Z H. Appl. Surf. Sci., 2019, 468:902-911
Liu R D, Li H, Duan L B, Shen H, Zhang Q, Zhao X R. Appl. Surf. Sci., 2018, 462:263-269 doi: 10.1016/j.apsusc.2018.07.173
Wang W W, Wang L, Li W B, Feng C, Qiu R, Xu L K, Cheng X D, Shao G Q. Mater. Lett., 2019, 234:183-186 doi: 10.1016/j.matlet.2018.09.098
Song H J, You S S, Jia X H. Appl. Phys. A:Mater. Sci. Process., 2015, 121:541-548
Shi W L, Guo F, Li M Y, Shi Y, Shi M J, Yan C. Appl. Surf. Sci., 2019, 473:928-933 doi: 10.1016/j.apsusc.2018.12.247
Qi S Y, Liu X H, Zhao B C. 2014 International Conference on Computer Science and Electronic Technology. Guilin:Atlantis Press, China, 2015:136-139
Shaw J C, Zhou H L, Chen Y, Weiss N O, Liu Y, Huang Y, Duan X F. Nano. Res., 2014, 7:511-517
Bougouma M, Batan A, Guel B, Segato T, Legma J B, Reniers F, Ogletree M P D, Herman C B Doneux T. J. Cryst. Growth, 2013, 363:122-127
Helmly B C, Lynch W E, Nivens D A. Spectrosc. Lett., 2007, 40:483-492
Zhang X H, Xue H X, Wang J T. Nano-Micro Lett., 2015, 10:339-342
Kou S F, Guo X, Xu X F, Yang J. Catal. Commun., 2018, 106:60-63
Liu R D, Li H, Duan L B, Shen H, Zhang Q, Zhao X R. Appl. Surf. Sci., 2018, 462:263-269
Yan J, Song Z L, Wang X, Xu Y G, Pu W J, Xu H, Yuan S Q, Li H M. Appl. Surf. Sci., 2019, 466:70-77
Shi Y, Tang Y B, Chen F Y, Shi W L, Guo F, Wang X G. Desalin. Water Treat., 2019, 170:287-296
Song Y H, Zhao H Z, Chen Z G, Wang W R, Huang L Y, Xu H, Li H M. Phys. Status Solidi A, 2016, 213:2356-2363
Kim Y G, Jo W K. J. Hazard. Mater., 2019, 361:64-72
Tang Y B, Yang H J, Chen F Y, Wang X G. Desalin. Water Treat., 2018, 110:144-153
Guo F, Li M Y, Ren H Q, Huang X L, Wang C, Shi W L, Lu C Y. Appl. Surf. Sci., 2019, 491:88-94
Dinh C T, Nguyen T D, Kleitz F, Do T O. Chem. Commun., 2011, 47:7797-7799
Rasheed T, Bilal M, Iqbal H M N, Shah S Z H, Hu H B, Zhang X H, Zhou Y F. Environ. Technol., 2018, 39:1533-1543
Zhang L, He Y M, Wu Y, Wu T H. Mater. Sci. Eng. B, 2011, 176:1497-1504
Martínez-de la Cru A, GarcíaPérez U M. Mater. Res. Bull., 2010, 45:135-141
Shi W L, Li M Y, Huang Q L, Ren H J, Guo F, Tang Y B, Lu C Y. Chem. Eng. J., 2020, 394:125009
Guo F, Huang Q L, Chen Z H, Sun H R, Shi W L. Sep. Purif. Technol., 2020, 253:117518
Guo F, Sun H R, Cheng L, Shi W L. New J. Chem., 2020, 44:11215-11223

Figure 1 SEM images of Ag3PO4 (a), MoSe2 (b), MoSe2/Ag3PO4 (c) and the used MoSe2/Ag3PO4 (d)

Figure 3 XPS spectra of MoSe2/Ag3PO4: survey (a), O1s (b), P2p (c), Se3d (d), Mo3d (e) and Ag3d (f)

Figure 4 UV-Vis diffuse absorption spectra (a), photocurrent response density (b) and EIS spectra of MoSe2, Ag3PO4 and MoSe2/Ag3PO4 under visible light (c)

Figure 5 Photocatalytic reduction of RhB by Ag3PO4 and different mass ratios of MoSe2/Ag3PO4 (a), fitted linear equations (b) and comparison of degradation of MoSe2/Ag3PO4 (1:5) and mechanical mixture of MoSe2 and Ag3PO4 (1:5) (c)
Quality of catalyst: 10 mg; initial concentration of RhB: 10 mg·L-1; volume of solution: 100 mL; pH: neutral; temperature: room temperature

Figure 6 Degradation effect of different pH values (a) and fitted linear equations (b)
Quality of catalyst:10 mg; initial concentration of RhB: 10 mg·L-1; volume of solution: 100 mL; temperature: room temperature

Figure 7 Effect of different concentrations on degradation (a) and fitted linear curves (b)
Quality of catalyst:10 mg; volume of solution: 100 mL; pH: neutral; temperature: room temperature

Figure 8 Effect of different temperatures on degradation (a) and fitted linear curves (b)
Quality of catalyst:10 mg; initial concentration of RhB: 10 mg·L-1; volume of solution: 100 mL; pH: neutral

Figure 9 Photo-stability of Ag3PO4 and MoSe2/Ag3PO4 by investigating its photocatalytic activity with three times of cycling use (a) and XRD comparison of MoSe2/Ag3PO4 before and after use (b)

Figure 10 UV-Vis absorption spectrum of the RhB degradation over the as-synthesized MoSe2/Ag3PO4 nanospheres under visible light irradiation

Figure 12 Reactive-species-trapping experiments (a) and ESR spectra of MoSe2/Ag3PO4 for detecting ·O2- under the visible light irradiation (b)

 扫一扫看文章

扫一扫关注我们
 下载:
下载:


 下载:
下载:


 下载:
下载: