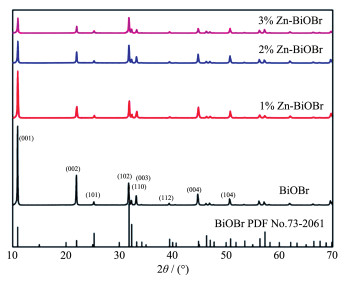
Figure 1.
XRD patterns of BiOBr and x% Zn-BiOBr

With the progress of human society, more and more attention has been paid to environmental and energy issues[1]. Photocatalytic conversion of CO2 into energy compound is a very promising approach to solve the energy crisis and environmental problems[2]. For example, conversion of carbon dioxide with pure water into carbon oxide is one of the most challenging reactions[3]. Lots of oxide semiconductors materials, as well as their composites, have been applied to photocatalytic CO2 reduction. Most of the investigated photocatalytic materials (e. g., TiO2[4], ZnO[5], ZrO2[6], Ga2O3[7]) can only be excited by ultraviolet light, which severely limits the conversion of solar energy. Therefore, it is very important and urgent to develop visible light driven and highly efficient photocatalyst.
The unique layered structure and anisotropic property of bismuth oxyhalide (BiOX) semiconductor, such as BiOBr, consisting of tetragonal [Bi2O2] positively charged[8-9], bring about the big advantage to regulate their band and energy structures. The self-built electric field between [Bi2O2] and Br layers would effectively separate the photoinduced electron-hole pairs, and transfer the electrons and holes to the surface of BiO-Br, which would enhance the photocatalytic activity[10]. The band gap of BiOBr is about 2.8 eV and can be excited by visible light theoretically[11]. Recent studies have demonstrated that BiOBr can be used as a photocatalyst for CO2 reduction to solar fuels. The product of CO2 photoreduction through BiOBr photocatalyst is usually CO (sometimes with a small amount of CH4), which is an industrial gas that has many applications in bulk chemicals manufacturing. Therefore, BiOBr is a very promising photocatalyst for CO2 reduction. Some strategies, such as size and morphology control[12], developing oxygen-deficient defects[13] and noble metal modified[14], have been used for developing BiOBr photocatalyst in recent years. Nevertheless, BiOBr showed inappreciable active for CO2 reduction under visible light, even the light sources on BiOBr were simulated sunlight irradiation in many reports. All of these revealed that the BiOBr photocatalyst is inefficient in the visible light region, which seriously limits the conversion utilization of solar energy.
In this paper, we reported a novel and unique Zn doped BiOBr micro sheets photocatalyst for CO2 photo-reduction to CO. The CO evolution was studied under visible light without sacrificial reagents H2O. A possible catalytic mechanism has been suggested, and the excellent photocatalytic efficiency can be attributed to the following characteristics: (1) the conduction band (CB) bottom level of 2% Zn-BiOBr was more negative than the redox potentials of CO2/CO; (2) the photogenerated holes on the valence band (VB) could be consumed by H2O; (3) the lattice defects caused by zinc may accelerate separation and transfer of photoinduced charge carriers.
All the chemical reagents were of analytical grade and purchased from Aladdin Industrial Corporation without further purification before use. Deionized water was used throughout the work.
Zn doped BiOBr photocatalysts were synthesized by a onestep hydrothermal method. First, 0.01 mol bismuth nitrate pentahydrate (Bi(NO3)3·5H2O) and proper amount of zinc nitrate were dissolved in 20 mL of 10% (w/w) diluted HNO3 solution under vigorous stirring to obtain a transparency liquid. In addition, 0.02 mol potassium bromide (KBr) were dissolved in 20 mL deionized water, and the obtained solution was added quickly into the above mixed solution. Then, the suspension was transferred into Teflon-lined stainless steel autoclaves (100 mL) and kept at 160 ℃ for 8 h. After reaction, the complex precursors precipitate was obtained by centrifugation, and then washed with deionized water. Finally, it was dried at 60 ℃ under air atmosphere. Through changing the molar ratio (x%) of Zn(NO3)2 to Bi(NO3)3, x% Zn doped BiOBr samples (labeled as x% Zn-BiOBr) were obtained.
X-ray diffraction (XRD) patterns were recorded on a diffractometer (D8 Advanced, Bruker Co., Germany) operated at 40 kV and 40 mA for Cu Kα (λ =0.154 06 nm). The data were recorded in a 2θ range of 10°~70° with a step width of 0.02. Scanning electron microscope (SEM) images were collected on a JSM-6700F microscope (JEOL Ltd., Japan) operated at 15 kV. Transmission electron microscopy (TEM) images, high resolution TEM (HRTEM) were performed with and a JEM-2100 microscope (JEOL Ltd., Japan) at 160 kV. The Brunauer-Emmett-Teller (BET) specific surface areas of the samples were investigated according to N2 adsorption-desorption data obtained by a Quantachrome Autosorb IQ-C nitrogen adsorption apparatus.X-ray photoelectron spectroscopy (XPS) was recorded using an X-ray photoelectron spectrometer (Kratos Axis Ultra) which uses Al Kα (1 486.6 eV) X-ray source. The curve fitting was done using Casa XPS software by means of least square peak fitting procedure using a Gaussian-Lorentzian function. Ultraviolet-Visible (UV-Vis) diffuse reflectance spectra (DRS) of the samples were recorded on a UV-3600 spectrophotometer (Shimadzu, Japan).
Photocatalytic reduction of CO2 in the presence of H2O was carried out as a gas-solid heterogeneous reaction in a 40 mL Schlenk flask with a silicone rubber septum under atmospheric pressure at ambient temperature (298 K). A xenon lamp (300D, Perfectlight, China) with a 420 nm cutoff filter was used to simulate sunlight. 10 mg of photocatalyst was placed into the reaction tube. Then, this system was evacuated by a mechanical pump and filled with pure CO2 gas. This evacuation-filling operation was repeated three times. Finally, 20 μL of pure water was introduced into the reactor via the silicone rubber septum. The photocatalytic reaction was typically performed for 3 h, while the stability test was performed 5 h per cycle. The reaction system was evacuated after each 4 h and refilled with CO2 and pure water. After the irradiation, the production amount of CO, CH4, H2 and O2 was analyzed using the Agilent GC-7890B gas chromatograph equipped with a FID detector, a TCD detector and a chromatographic column (TDX-01). The CO gas produced from 13CO2 isotope experiments was examined by a gas chromatograph-mass spectrometer (GC-MS, HP 5973). The equipped column in GC-MS analysis was HP-MOLE-SIEVE (Agilent Technologies, 30 m×0.32 mm, serial number: USD 130113H).
Photoelectrochemical measurements were carried out with a BAS Epsilon workstation using a standard three-electrode electrochemical cell with a working electrode, a platinum foil as the counter electrode, and a saturated Ag/AgCl electrode as the reference. A sodium sulfate solution (0.2 mol·L-1) was used as the electrolyte. The working electrode was prepared by FTO glass pieces, which was cleaned by sonication in cleanout fluid, acetone and ethanol in sequence. The photocatalyst was dispersed in ethanol under sonication to form a suspension. A photocatalyst film was fabricated by spreading the suspension onto the conductive surface of the FTO glass. Periodic photocurrent response was measured by introducing a 300 W Xe lamp as the light source. Mott-Schottky experiments were also carried out with the three-electrode system. The potential window ranged from-1 to 0 V, and the perturbation signal was 10 mV with the frequency at 1.0 kHz.
Fig. 1 showed the XRD patterns of pure BiOBr and x% Zn-BiOBr. The pure BiOBr's XRD pattern is in evidently agreement with BiOBr (PDF No. 73-2061), which is of tetragonal phase (Lattice constant: a=b= 0.392 nm, c =0.808 nm). In the case of x% Zn-BiOBr, no apparent peaks of zinc oxide or other phases were detected, which suggested that the doping of Zn hardly affected the crystallization properties of BiOBr. For Zn-BiOBr photocatalysts, obvious shifts in the XRD peaks of (001), (002) and (102) were observed (Fig. 2), due to the smaller radius of Zn2+ (0.074 nm) than that of Bi3+ (0.103 nm)[15-16]. The results imply that Zn2+ cations are incorporated into the BiOBr lattice, while the valence of Zn ion has not changed.
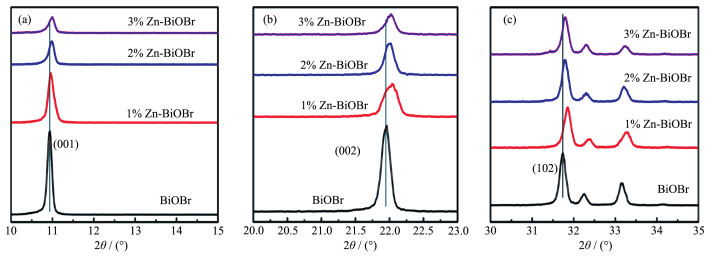
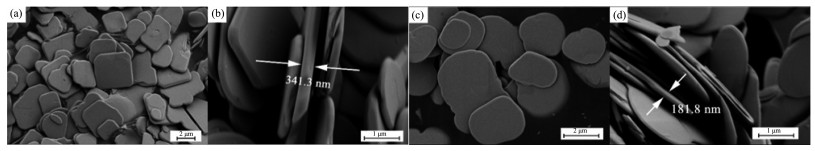
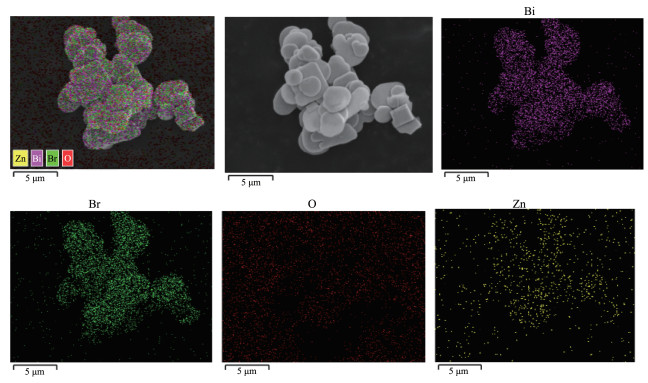
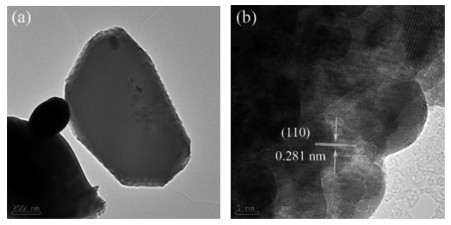
Fig. 3 presents SEM images of BiOBr and 2% Zn-BiOBr. The pure BiOBr was composed of micro sheets of 1~4 μm (Fig. 3a) and the thickness of the micro sheet is about 341.3 nm (Fig. 3b). As-prepared 2% Zn-BiOBr revealed similar micro sheets structures and the sheet thickness decreased to about 181.8 nm (Fig. 3d). The SEM results show that Zn2+ doping has no effect on the micromorphology of BiOBr. EDX was used to verify whether Zn is present in the sample. Zn, Bi, O and Br all existed in 2% Zn-BiOBr, as shown in Fig. 4. It indicated that Zn had been successfully doped into the crystal lattice of BiOBr. The specific surface areas of BiOBr and 2% Zn-BiOBr were further characterized, which were 12 and 14 m2·g-1, respectively. The TEM and HRTEM images of 2% Zn-BiOBr are shown in Fig. 5. The TEM image of 2% Zn-BiOBr further confirmed its lamellar morphology. The clear lattice fringes could be observed and the distance of the lattice fringes are 0.281 nm, consistent with (110) facet of tetragonal BiOBr.
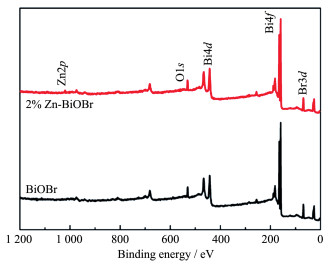
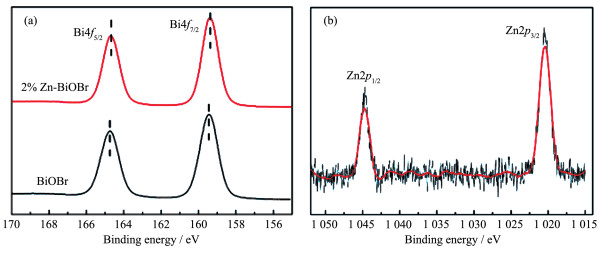
To confirm the chemical element compositions and states of the as-prepared Zn-BiOBr, XPS analysis was performed. Fig. 6 is the XPS survey spectra of the as-prepared BiOBr and 2% Zn-BiOBr. Fig. 7a shows the Bi4f XPS spectrum. The two main peaks are corresponding to Bi4f7/2 and Bi4f5/2 of Bi3+ with binding energies at 164.75 and 159.45 eV, respectively. Compared with BiOBr, there is a downshift of the Bi4f level binding energy in 2% Zn-BiOBr, owing to changes of crystal structure and coordination environment resulting from the substitution of Zn2+ for Bi3+. The peaks at 1 020.9 and 1 044.7 eV are attributed to Zn2p3/2 and Zn2p1/2, suggesting that Zn is doped in the BiOBr crystal in the form of Zn2+ (Fig. 7b).
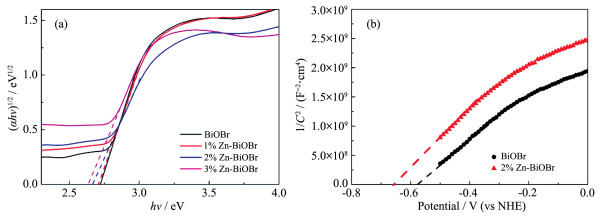
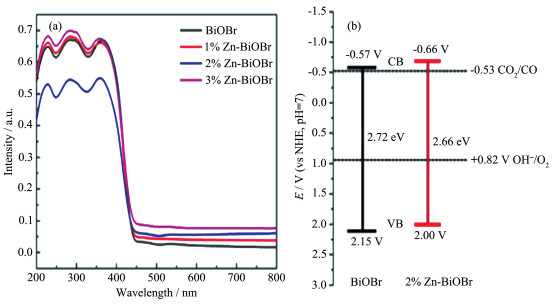
Fig. 8a displays the UV-Vis DRS spectra of pure BiOBr and Zn-BiOBr samples at room temperature. BiOBr exhibited a sharp absorption edge respectively at 455 nm due to the band gap transition. Zn-BiOBr displayed a slight broader light absorption from the UV to the visible light region as the Zn2+ ion content increased. With Zn doped, the fabricated Zn-BiOBr samples, especially 2% Zn-BiOBr, showed obvious blue shift in absorption threshold. The optical band gap is calculated to be about 2.72, 2.70, 2.66 and 2.62 eV for BiOBr, 1% Zn-BiOBr, 2% Zn-BiOBr and 3% Zn-BiOBr, respectively (Fig. 9a). The positive slope of the Mott-Schottky plots indicate that BiOBr and Zn-BiOBr are n-type semiconductors[17], as shown in Fig. 9b. According to the calculation result from the Mott-Schottky plot, the CB position of 2% Zn-BiOBr was-0.66 eV. According to DRS results, the VB of BiOBr was calculated to be 2.00 V. In similar way, the CB and VB positions of BiOBr were calculated to be ca.-0.57 and 2.15 eV, respectively. The band positions of pure BiOBr and Zn-BiOBr could also be calcu-lated by the formula: EVB=X-Ee+0.5Eg, ECB=EB-Ee-0.5 Eg, where EVB and ECB are the VB edge potential and the CB edge potential, respectively, X is the absolute electro-negativity of the semiconductor (the X for BiOBr is 6.45 eV), Ee is the energy of free electrons on the hydrogen scale (the value of Ee is 4.5 eV), and Eg is the band gap energy of the semiconductor. Consequently, we determined the band structures of BiOBr and 2% Zn-BiOBr (Fig. 8b) as follows: (1) 2% Zn-BiOBr's CB bottom level is more negative than the redox potentials of CO2/CO[18]; (2) the light generated holes on the VB can be consumed by H2O. 2% Zn-BiOBr fulfills the above tow demands and can be used as a suitable catalyst for CO2 reduction.
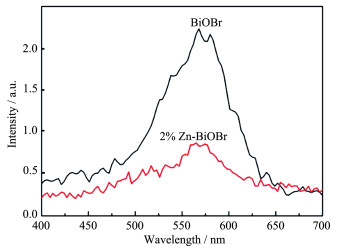
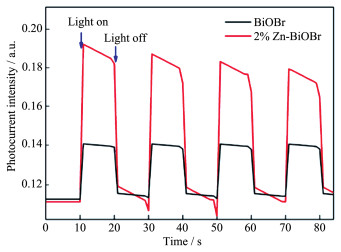
The separation rate of the photogenerated electrons and holes is the key factor for photocatalytic process. As shown in Fig. 10 and 11, PL and photocurrent response of BiOBr and 2% Zn-BiOBr were detected. In the PL spectra (Fig. 10), 2% Zn-BiOBr showed greatly reduced fluorescence intensity, which turns out that the recombination of photogenerated electron-hole pairs is greatly prevented. The doping of Zn in the BiO-Br provided an electron trap to promote charge transfer[19]. The charge separation of 2% Zn-BiOBr is further demonstrated by photocurrent response analysis. As displayed in Fig. 11, the current intensity of 2% Zn-BiOBr was visibly higher than that of pure BiOBr. PL and photocurrent response analysis strongly indicate that Zn doping can enhance separation velocity of charge carriers of photocatalytic material[20].
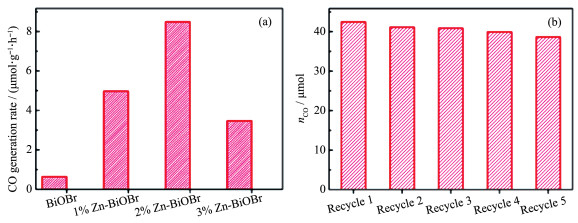
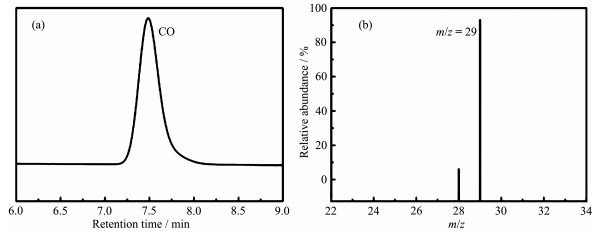
The photocatalytic CO2 reduction over the Zn doped BiOBr photocatalyst was performed under visible light irradiation with H2O. The photocatalytic rates of CO over BiOBr and Zn-BiOBr are shown in Fig. 12a.2% Zn-BiOBr exhibited the best CO generation rate of 8.49 μmol·h-1, which is 13-fold conversion activity compared to the pure BiOBr. Comparison with the recent reports on BiOBr photocatalyst for CO2 reduction is showed in Table 1. Furthermore, 2% Zn-BiOBr kept its high production rate of CO after five cycle reaction during total 25 h, as shown in Fig. 12b. 13C-labelled isotopic experiment was performed to confirm the carbon origin in CO generation process. The GC-MS results are shown in Fig. 13. In GC spectrum (Fig. 13a), the CO peak was at 7.5 min and the m/z value of 29 (Fig. 13b) is assigned to 13CO. The results suggest that CO comes from the reduced CO2, not other carbon substances in the reaction system. Furthermore, CO was major product, and only negligible CH4 was detected.
 下载:
导出CSV
下载:
导出CSV
| Photocatalyst | Product | Rate / (μmol·h-1) | Light source | Reference |
| BiOBr | CO | 4.45 | Under xenon light irradiation | [12] |
| Oxygen-deficient BiOBr | CH4 | 0.958 | Under solar light irradiation | [13] |
| Ultrathin BiOBr | CO | 2.67 | Under visible light irradiation | [21] |
| CH4 | 0.16 | |||
| g-C3N4/BiOBr/Au | CO | 6.67 | Under 380 nm monochromatic light | [14] |
| CH4 | 0.92 |
The effect of different conditions on the conversion of CO2 to CO was studied (Table 2). Obviously, when there is no visible light illumination or no catalyst in the reaction mixture, the CO evolution was greatly suppressed, implying that both light illumination and catalyst are necessary conditions for CO2 photoreduction reaction. What's important is that no CO was detected in the case of Ar rather than CO2 after light irradiation for 5 h.
下载:
导出CSV
| Entry | Condition | Rate of CO / (μmol·h-1) | Rate of oxygen / (μmol·h-1) |
| 1 | Visible light+Catalyst+CO2 | 8.49 | 4.05±0.03 |
| 2 | No visible light | 0 | 0 |
| 3 | No catalyst | 0 | 0 |
| 4 | Ar instead of CO2 | 0 | 0 |
| 5 | No H2O | 0.34 | 0.12 |
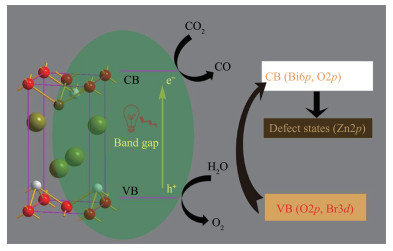
From what has been discussed above, we can infer that 2% Zn doped BiOBr has suitable band gap and band-edge positions for photocatalytic CO2 reduction. Moreover, the substitution of Zn2+ for Bi3+ provides the defect states in BiOBr band structure (Fig. 14), resulting in the low recombination rate of photogenerated electrons and holes, which are favorable for the photocatalytic process[22]. In the end, a probable mechanism of enhanced photocatalytic CO2 reduction rate over the Zn doped BiOBr is proposed. Under visible light illumination, Zn-BiOBr semiconductors are excited, causing the creation of photo-induced electron-hole pairs. Then photoinduced electrons could effectively improve the conversion of CO2 into CO. Meanwhile, photoinduced electrons are electronegative and exhibit high reducibility, which are helpful to the conversion. And the holes in the valence band of Zn-BiOBr could be scavenged by H2O to generate O2 and other oxidation products.
In conclusion, Zn doped BiOBr photocatalysts was successfully synthesized using a simple hydrothermal method. And the prepared catalysts were first used for photocatalytic CO2 reduction under visible light illumination at room temperature. The doping of Zn2+ changed the band structure of BiOBr. 2% Zn doped BiOBr has a smaller band gap and the suitable CB and VB position for photocatalytic CO2 reduction. Furthermore, Zn doped BiOBr has better separation efficiency of light-generated electrons and holes. As a result, the 2% Zn-BiOBr exhibited the best photocatalytic rate of 8.49 μmol·h-1, which was 13-fold conversion activity compared to the pure BiOBr materials. All the results show that Zn2+ doping in the BiOBr photocatalyst can substantially enhance the CO2 conversion efficiency. This work provided a new way for discovering new materials and new methods for renewable energy conversion.
Kong Z C, Liao J F, Dong Y J, et al. ACS Energy Lett., 2018, 3:2656-2662 doi: 10.1021/acsenergylett.8b01658
Zhou M, Wang S B, Yang P J, et al. ACS Catal., 2018, 8:4928-4936 doi: 10.1021/acscatal.8b00104
Wang Y X, Zhang Z Y, Zhang L R, et al. J. Am. Chem. Soc., 2018, 140:14595-14598 doi: 10.1021/jacs.8b09344
Liu Y N, Miao C L, Yang P F, et al. Appl. Catal. B, 2019, 244:919-930 doi: 10.1016/j.apcatb.2018.12.028
Ren S J, Shoemaker Weston R, et al. Fuel, 2019, 239:1125-1133 doi: 10.1016/j.fuel.2018.11.105
García-López E, Marcì G, Pomilla F R, et al. Catal. Today, 2018, 313:100-105 doi: 10.1016/j.cattod.2018.01.030
Kikkawa S, Teramura K, Asakura H, et al. J. Phys. Chem. C, 2018, 122:2132-2139
Li R P, Ren H J, Ma W H, et al. Catal. Commun., 2018, 106:1-5 doi: 10.1016/j.catcom.2017.11.015
Gao M C, Yang J X, Sun T, et al. Appl. Catal. B, 2019, 243:734-740 doi: 10.1016/j.apcatb.2018.11.020
Gao M C, Zhang D F, Pu X P, et al. Mater. Lett., 2015, 140:31-34 doi: 10.1016/j.matlet.2014.10.032
Wu D, Yue S T, Wang W, et al. Appl. Catal. B, 2016, 192:35-45 doi: 10.1016/j.apcatb.2016.03.046
Wu D, Ye L Q, Ho Y Y, et al. Catal. Sci. Technol., 2017, 7:265-271 doi: 10.1039/C6CY02040B
Kong X Y, Lee W P C, Ong W J, et al. ChemCatChem, 2016, 8:3074-3081 doi: 10.1002/cctc.201600782
Bai Y, Chen T, Wang P Q, et al. Sol. Energy Mater. Sol. Cells, 2016, 157:406-414 doi: 10.1016/j.solmat.2016.07.001
Liu Z L, Jin Y J, Teng F, et al. Catal. Commun., 2015, 66:42-45 doi: 10.1016/j.catcom.2015.03.017
Guo J Q, Liao X, Lee M H, et al. Appl. Catal. B, 2019, 243:502-512 doi: 10.1016/j.apcatb.2018.09.089
Jia H M, He W W, Zhang B B, et al. Appl. Surf. Sci., 2018, 441:832-840 doi: 10.1016/j.apsusc.2018.02.030
Wang X Y, Zhang Z G, Huang Z F, et al. Mater. Res. Bull., 2019, 118:110-115
Subha N, Mahalakshmi M, Myilsamy M, et al. Appl. Catal. A, 2018, 553:43-51 https://www.sciencedirect.com/science/article/abs/pii/S0926860X18300176
Zhang G J, Su A T, Qu J W, et al. Mater. Res. Bull., 2014, 55:43-47 doi: 10.1016/j.materresbull.2014.04.012
Ye L Q, Jin X L, Liu C, et al. Appl. Catal. B, 2016, 187:281-290 doi: 10.1016/j.apcatb.2016.01.044
Djurišić A B, Leung Y H, Ching A M, et al. Mater. Horiz., 2014, 1:400-410 doi: 10.1039/c4mh00031e

Figure 2 (a~c) XRD patterns corresponding enlarged view for (001), (002) and (102) facets of BiOBr and x% Zn-BiOBr

Figure 9 (a) UV-Vis DRS spectra corresponding (αhν)1/2-(hν) curves of BiOBr and Zn-BiOBr; (b) Mott-Schottky plots

Figure 12 (a) CO generation rate of BiOBr and Zn-BiOBr; (b) Stability tests of 2% Zn-BiOBr sample
Table 1. Recent reports on BiOBr photocatalyst for CO2 reduction
| Photocatalyst | Product | Rate / (μmol·h-1) | Light source | Reference |
| BiOBr | CO | 4.45 | Under xenon light irradiation | [12] |
| Oxygen-deficient BiOBr | CH4 | 0.958 | Under solar light irradiation | [13] |
| Ultrathin BiOBr | CO | 2.67 | Under visible light irradiation | [21] |
| CH4 | 0.16 | |||
| g-C3N4/BiOBr/Au | CO | 6.67 | Under 380 nm monochromatic light | [14] |
| CH4 | 0.92 |
 下载: 导出CSV
Table 2. CO evolution of 2% Zn-BiOBr detected under different conditions
| Entry | Condition | Rate of CO / (μmol·h-1) | Rate of oxygen / (μmol·h-1) |
| 1 | Visible light+Catalyst+CO2 | 8.49 | 4.05±0.03 |
| 2 | No visible light | 0 | 0 |
| 3 | No catalyst | 0 | 0 |
| 4 | Ar instead of CO2 | 0 | 0 |
| 5 | No H2O | 0.34 | 0.12 |
下载: 导出CSV

 扫一扫看文章

扫一扫关注我们


 下载:
下载: