Table 1.
Crystal data and structure refinement for complexes 1~3
Citation:
ZHOU Meng-Xue, REN Ning, ZHANG Jian-Jun. Four Rare Earth Complexes with Chlorinated Carboxylic Acids and Bipyridine Ligands: Crystal Structures, Thermal Analysis and Luminescence Properties[J]. Chinese Journal of Inorganic Chemistry,
2020, 36(12): 2349-2358.
doi:
10.11862/CJIC.2020.258

氯代芳香羧酸与联吡啶配体构筑的四种稀土配合物的晶体结构、热分析和荧光性质
摘要:
利用2种氯代芳香羧酸(3,4-二氯苯甲酸和3,5-二氯苯甲酸,分别简写为3,4-HDClBA和3,5-HDClBA)与5,5'-二甲基-2,2'-联吡啶(5,5'-DM-2,2'-bipy)配体在溶剂热或常温反应的条件下成功地合成了4种稀土配合物[Ln2(5,5'-DM-2,2'-bipy)2(3,4-DClBA)6(H2O)(C2H5OH)](Ln=Sm(1),Eu(2))和[Ln(5,5'-DM-2,2'-bipy)(3,5-DClBA)3]2(Ln=Sm(3),Eu(4))。配合物1和2是同构的,每个中心离子是八配位的扭曲四方反棱柱的几何构型,分子与分子之间通过C-H…Cl氢键和π-π堆积作用形成二维的超分子结构。配合物3的几何构型为九配位的单帽四方反棱柱体,分子与分子之间通过不同的π-π堆积作用形成二维的超分子结构。利用热重红外联用技术研究了配合物1~4的热稳定性和热分解机理。对配合物2和4进行了荧光以及荧光寿命研究,结果表明2个配合物都能发射Eu3+离子的特征荧光。
English
Four Rare Earth Complexes with Chlorinated Carboxylic Acids and Bipyridine Ligands: Crystal Structures, Thermal Analysis and Luminescence Properties
Abstract:
Four new complexes were successfully synthesized by solvothermal method or conventional solution method, namely [Ln2(5, 5'-DM-2, 2'-bipy)2(3, 4-DClBA)6(H2O)(C2H5OH)] (Ln=Sm (1), Eu (2)) and [Ln(5, 5'-DM-2, 2'-bipy) (3, 5-DClBA)3]2 (Ln=Sm (3), Eu (4); 3, 4-HDClBA=3, 4-dichlorobenzoic acid, 3, 5-HDClBA=3, 5-dichlorobenzoic acid, 5, 5'-DM-2, 2'-bipy=5, 5'-dimethyl-2, 2'-bipyridine). Complexes 1 and 2 are isostructure and each metal center is eight-coordinated forming a distorted square antiprismatic. Complexes 1 and 2 are connected to form 2D supermolecular structure by C-H…Cl hydrogen bonding and π-π interactions. The geometry of complex 3 is a nine coordinated distorted monocapped square antiprismatic, and the two-dimensional supramolecular structure is formed by different π-π stacking interactions between molecules. Thermogravimetric-infrared combined technology revealed the thermal stability and thermal decomposition mechanism of complexes 1~4. The fluorescence and lifetime of complexes 2 and 4 were studied. The results showed that both complexes could emit the characteristic fluorescence of Eu3+ ions. CCDC: 1939324, 1; 1939325, 2; 1939326, 3.
-
Key words:
- rare earth complexes
- / synthesis
- / crystal structures
- / thermal analysis
- / luminescent properties
-
0. Introduction
Lanthanide coordination polymers are a unique class of crystalline materials that are widely used in many fields, such as luminescence, sensors, singlemolecular magnet, storage and separation of small molecules, catalysis[1-10]. Recently, lanthanide elements have been extensive used as luminescent materials for their fascinating optical properties. Since the 4f electron layer is shielded by the filled 5p66s2 orbitals, lanthanide ions have the advantages of high luminescence intensity, good color purity and long lifetimes[11-12]. It is well known that the molar absorption coefficient of direct excitation of trivalent metal ions is very low, so we need to introduce aromatic carboxylic acid ligands and neutral ligands as antenna ligands to enhance light emission[13]. The introduction of halogenated aromatic carboxylic acid ligands and bipyridine ligands not only serves as antenna ligands to increase the luminescence intensity of lanthanide ion, but also enhances the stability of lanthanide complex. The carboxyl group of aromatic carboxylic acid ligand can bond to the lanthanide ion by multitudes of coordination modes, thus forming lanthanide complexes with various structures[14-15]. In general, the research on lanthanide complexes mainly focuses on the construction of compounds with various topological structures. However, most of the assembly is done by covalent coordination ions with ligands. What we are exploring is another model for generating extended structures through noncovalent supramolecules[16-18].
Therefore, we chose 3, 4-dichlorobenzoic acid (3, 4-HDClBA) and 3, 5-dichlorobenzoic acid (3, 5-HDClBA=3, 5 - dichlorobenzoic acid) as carboxylic acid ligands, and 5, 5′-dimethyl-2, 2′-bipyridine(5, 5′-DM-2, 2′-bipy) as auxiliary ligands to assemble four novel complexes by different synthesis methods. The one-dimensional and two - dimensional structures of the complexes are also assembled by C-H…Cl hydrogen bonding and π-π interactions. The pyrolysis process of the complexes has been studied by the TG-FTIR technology. Further- more, the fluorescence spectra of 2 and 4 were studied at room temperature.
1. Experimental
1.1 Materials and methods
3, 4 - HDClBA (Alfa Aesar, 99%), 3, 5 - HDClBA (Alfa Aesar, 99%), Ln(NO3)3·6H2O (Ln=Sm, Eu) (Alfa Aesar, 99.9%), 5, 5′-DM-2, 2′-bipy (Alfa Aesar, 98%) were used without any treatment. Elemental analysis of C, H and N were measured on a Vario-EL Ⅱ element analyzer. The powder X-ray diffraction patterns (PXRD) data were obtained from a Bruker D8 Advance X -ray diffraction at a working voltage of 40 kV and a working current of 40 mA in a 2θ range of 5°~45° with Cu Kα radiation (λ=0.154 18 nm) at 298 K. In the atmosphere of simulated air, TG/FTIR spectra were recorded on a NETASCH STA 449 F3 instrument with a Bruker TENSOR 27 FTIR with approximately 3 mg compounds. Fluorescence spectra of complexes 2 and 4 were studied on a Fluorescence spectrum (FS5) spectrofluorophotometer.
1.2 Synthesis of the complexes
1.2.1 Synthesis of 1 and 2 (Ln=Sm (1), Eu (2))
The pH value of the mixture of 3, 4-HDClBA (0.6 mmol) and 5, 5′-DM-2, 2′-bipy (0.2 mmol) in 8 mL ethanol was adjusted to 5~7 by 1.0 mol·L-1 NaOH. This mixture was mixed with an aqueous solution of lanthanide nitrate for 40 min, and then filled into an autoclave and heated at 393 K for a week, then cooled to 298 K gradually. The resulting translucent crystal were obtained. Elemental analyses Calcd. for C68H50Cl12N4O14Sm2(%): C, 43.60; N, 2.99; H, 2.69. Found(%): C, 43.62; N, 2.97; H, 2.68. Calcd. for C68H50Cl12N4O14Eu2(%): C, 43.52; N, 2.99; H, 2.69. Found(%): C, 43.50; N, 2.98; H, 2.67.
1.2.2 Synthesis of 3 and 4 (Ln=Sm (3), Eu (4))
The pH value of the mixture of 0.6 mmol 3, 5-HDClBA and 0.2 mmol 5, 5′-DM-2, 2′-bipy in 8 mL ethanol was adjusted to 5~7 with 1.0 mol·L-1 NaOH. This mixture was mixed with an aqueous solution of lanthanide nitrate for 6 h and held for 12 h, then the powder was filtered to obtain the filtrate. The crystals of 3 were acquired after about a week. Elemental analyses Calcd. for C66H42Cl12N4O12Sm2(%): C, 43.82; N, 3.10; H, 2.34. Found(%): C, 43.85; N, 3.08; H, 2.35. Calcd. for C66H42Cl12N4O12Eu2(%): C, 43.74; N, 3.09; H, 2.34. Found(%): C, 43.75; N, 3.08; H, 2.31.
1.3 Crystal structure determination
The diffraction of the complexes was performed on a Smart-1000 diffractometer using graphite-monochromated with Mo Kα radiation (λ =0.071 073 nm). The data of complexes 1~3 was collected at 298(2) K and solved by direct methods. All crystal structures were refined using SHELXL-97 program. Data collection and refinements of 1~3 are shown in Table 1 and primary bond length parameters are presented in Table S1 (Supporting information).
Table 1

 下载:
导出CSV
下载:
导出CSV
Complex 1 2 3 Empirical formula C68H50Cl12N4O14Sm2 C68H50Cl12N4O14Eu2 C66H42Cl12N4O12Sm2 Formula weight 1 873.22 1 876.44 1 809.14 Crystal system Triclinic Triclinic Triclinic Space group P1 P1 P1 a/nm 1.266 00(11) 1.260 68(12) 1.164 60(11) b/nm 1.392 01(12) 1.383 31(12) 1.214 30(12) c/nm 2.354 0(2) 2.340 4(2) 1.340 00(13) α/(°) 90.850 0(10) 90.707 0(10) 104.511(3) β/(°) 91.270 0(10) 91.398 0(10) 92.930 0(10) γ/(°) 113.210(3) 113.189(4) 98.252(2) Volume/nm3 3.810 5(6) 3.749 5(6) 1.808 0(3) Z 2 2 1 Dc/(g·cm-3) 1.633 1.662 1.662 Absorption coefficient/mm-1 2.009 2.149 2.112 F(000) 1 852 1 856 890 Crystal size/mm 0.25×0.13×0.11 0.17×0.12×0.10 0.16×0.12×0.10 θ range for data collection/(°) 2.32~25.02 2.34~25.02 2.26~25.02 Limiting indices -14 ≤ h ≤ 14, -14 ≤ h ≤ 13, -13 ≤ h ≤ 13, -16 ≤ k ≤ 15, -16 ≤ k ≤ 13, -14 ≤ k ≤ 12, -28 ≤ l ≤ 23 -27 ≤ l ≤ 27 -15 ≤ l ≤ 15 Reflection collected, unique Completeness to θ=25.02°/% 19 489, 13 257(Rint=0.038 9) 19 159, 13 034(Rint=0.037 5) 9 237, 6 291(Rint=0.028 8) 98.5 98.5 98.5 Max. and min. transmission 0.809 2 and 0.633 5 0.813 8 and 0.711 5 0.816 6 and 0.728 7 Data, restraint, parameter 13 257, 2, 906 13 034, 2, 906 6 291, 0, 435 Goodness-of-fit on F2 1.021 1.033 1.018 Final R indices [I > 2σ(I)] R1=0.057 4, wR2=0.138 5 R1=0.048 7, wR2=0.091 5 R1=0.037 5, wR2=0.060 7 R indices (all data) R1=0.089 5, wR2=0.151 8 R1=0.089 0, wR2=0.101 3 R1=0.051 3, wR2=0.064 0 Largest diff. peak and hole/(e·nm-3) 1 570 and -1 728 1 394 and -696 1 159 and -540 CCDC: 1939324, 1; 1939325, 2; 1939326, 3.
2. Results and discussion
2.1 Structure description of [Ln2(5, 5′ -DM- 2, 2′ - bipy)2(3, 4 - DClBA)6(H2O) (C2H5OH)] (Ln=Sm (1), Eu (2))
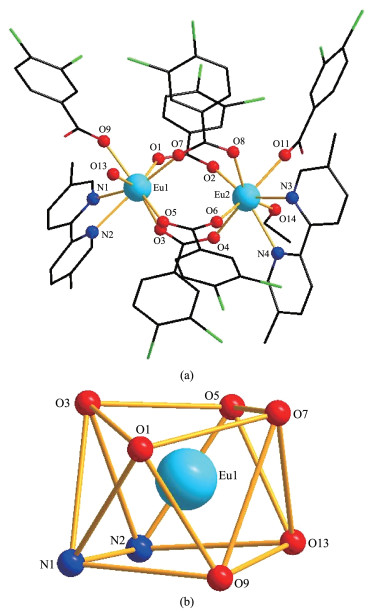
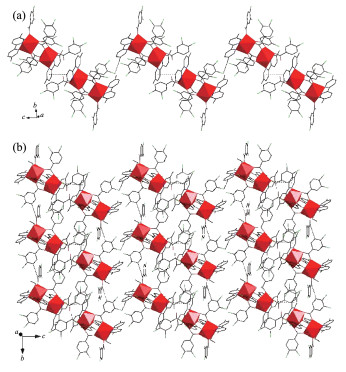
The crystal diffraction data indicate that 1 and 2 are isostructural and crystallize in space group P1. The structure of 2 is described in detail as an example. Complex 2 contains two eight - coordinated Eu3+ ions, each of which is coordinated with two nitrogen atoms and six oxygen atoms. Among the oxygen atoms coordinated with Eu1, five are from 3, 4-DClBA- anions and one is from water molecule. Among the oxygen atoms coordinated with Eu2, five are from 3, 4-DClBA- anions and one is from ethanol (Fig. 1a). Each Eu3+ adopts a distorted square antiprismatic molecular geometry (Fig. 1b). The average values of Eu-O distances and EuN distances of complex 2 are 0.238 3 and 0.263 7 nm, respectively. The average Eu-N distances is longer than Eu-O distances in the binuclear complex, which is consistent with the previously reported Eu complexes[20-21]. The adjacent molecules are connected together by π-π stacking interactions[22] of bipyridine ligands with a distance of 0.373 5 nm, resulting in a four nuclear unit. Then the unit is linked by the C-H…Cl hydrogen bonding[23] with a distance of 0.353 6 nm forming a 1D supramolecular structure (Fig. 2a). Then the 1D chains are assembled to 2D supramolecular network frameworks along b and c axes by C-H…O hydrogen bonding with a distance of 0.340 2 nm between two 3, 4- DClBA ligands (Fig. 2b).
Figure 1
Figure 2
 Figure 2. (a) View of 1D chain of 2 along c axis; (b) 2D layered of 2 along b and c axes
2.2 Crystal structure description of 3
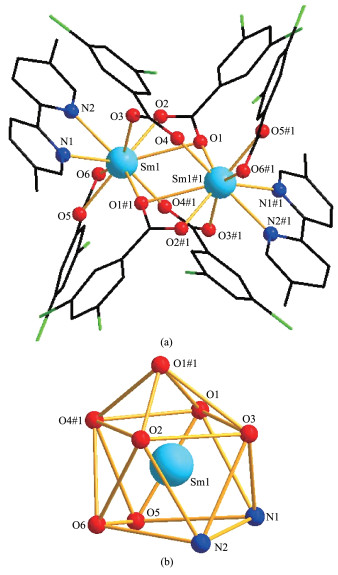
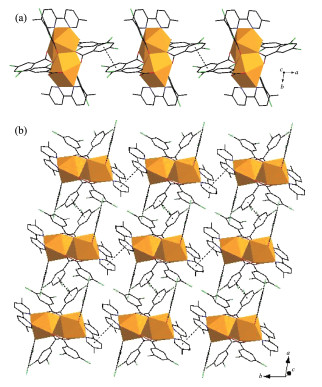
The crystal diffraction data reveal that complex 3 is the triclinic system with a binuclear structure. The asymmetric part of contains one Sm3+ ion, three 3, 5-DClBA- anions and one 5, 5′-DM-2, 2′-bipy molecule (Fig. 3a). Each Sm3+ ion is bonded with seven oxygen atoms from five 3, 5-DClBA- anions, and two nitrogen atoms from one bipyridine. The coordination geometry of Sm3+ ion is a distorted monocapped square antiprismatic (Fig. 3b). The average values of Sm-O and Sm-N distances are 0.248 1 and 0.261 9 nm, respectively. The adjacent molecules are interconnected with each other through π-π interactions with 0.350 8 nm between 3, 5-DClBA- anions, forming a 1D chain structure (Fig. 4a). The adjacent two chains are extended via another π-π interactions with 0.378 7 nm between bipyridine ligands to come into being a 2D layer (Fig. 4b).
Figure 3
 Figure 3. (a) Crystal structure of 3; (b) Coordination geometry of Sm3+ ion
Symmetry code: #1:-x+1, -y+2, -z
Figure 4
 Figure 4. (a) View of 1D chain structure of 3 along a axis; (b) 2D layered of 3 along a and b axes
Compared with the samarium complex (the coordi- nation number is 8) synthesized by Carter et al.[17] With 3, 5 - dichlorobenzoic acid and tripyridine, the coordination number of 3 is 9. In addition to bidentate chelation and bridging bidentate, complex 3 also has a tridentate bridging coordination mode. The reason may be related to the steric hindrance of the auxiliary ligand. The auxiliary ligand of complex 3 is dipyridine with smaller steric hindrance. Therefore, in order to meet the characteristics of high coordination number of rare lanthanide ions, it is easier to form 9-coordination complex.
2.3 Powder X-ray diffraction
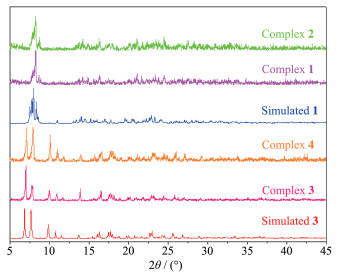
At 298 K, PXRD patterns of all complexes were measured. As shown in Fig. 5, the PXRD data of synthesized samples of complexes 1 and 2 were essentially close to the simulated pattern of the crystal, indicating that complexes 1 and 2 are isostructural. No single crystals of complex 4 was obtained, but the XRD pattern of its powder was consistent with that of complex 3, indicating that complex 4 may be isostructural to complex 3. The simulated PXRD patterns of complex 2 are shown in Fig.S1.
Figure 5
 Figure 5. PXRD patterns of complexes 1~4 and simulated PXRD patterns of complexes 1 and 3
2.4 Thermal analysis
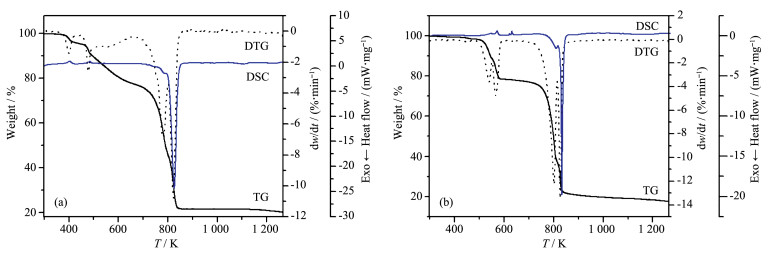
As shown in Fig. 6a and 6b, TG-DTG-DSC curves of 2 and 3 were obtained under a simulated air atmosphere. The TG-DTG-DSC curves of 1 and 4 are shown in Fig. S2a and S2b. Thermoanalysis data at different temperature stages are presented in Table 2. Pyrolysis process of 2 and 3 were investigated thoroughly.
Figure 6
As shown in Fig. 6a, there are four platforms on the TG curve of complex 2. At 374~423 K, the weight loss was about 3.4%, which is equivalent to the removal of one molecule of water and ethanol (Calcd. 3.4%). A small endothermic peak was observed on DSC curve. The weight loss at 423~662 K was 18.6%, indicating that 5, 5′ - DM - 2, 2′ - bipy ligand began to decompose (Calcd. 19.6%). The remaining step (third, fourth) weight loss of 57.5% at 622~1267 K are attributed to the loss of 3, 4-DClBA-ligands (Calcd. 58.2%). Finally, the complex entirely collapsed into the Eu2O3.
Table 2
Table 2. Pyrolysis data for complexes 1~4下载:
导出CSV
Complex Step Temperature range/K Tp of DTG/K Weight loss/% Probable expelled groups Intermediate and residue Found Calcd. 1 Ⅰ 368~432 400 3.8 3.4a C2H5OH+H2O [Sm2(3, 4-DClBA)6(5, 5′-DM-2, 2′-bipy)2] Ⅱ 432~658 474 19.4 19.7b 2(5, 5′-DM-2, 2′-dipy) [Sm2(3, 4-DClBA)6] Ⅲ 658~819 792 38.9 x(3, 4-DClBA) [Sm2(3, 4-DClBA)6-x] Ⅳ 819~1 266 836 19.2 58.3c (6-x)(3, 4-DClBA) Sm2O3 81.3 81.4e 2 Ⅰ 374~423 401 3.4 3.4a C2H5OH+H2O [Eu2(3, 4-DClBA)6(5, 5′-DM-2, 2′-bipy)2] Ⅱ 423~662 479 18.6 19.6b 2(5, 5′-DM-2, 2′-dipy) [Eu2(3, 4-DClBA)6] Ⅲ 662~803 782 32.5 x (3, 4-DClBA) [Eu2(3, 4-DClBA)6-x] Ⅳ 803~1 267 823 25.0 58.2c (6-x)(3, 4-DClBA) Eu2O3 79.5 81.2e 3 Ⅰ 492~550 540 9.4 x (5, 5′-DM-2, 2′-dipy) [Sm2(3, 5-DClBA)6(5, 5′-DM-2, 2′-bipy)2-x] Ⅱ 550~596 566 10.4 20.4b (2-x) (5, 5′-DM-2, 2′-bipy) [Sm2(3, 5-DClBA)6] Ⅲ 596~816 802 41.7 y (3, 5-DClBA) [Sm2(3, 5-DClBA)6-y] Ⅳ 816~1 223 827 18.5 60.4d (6-y) (3, 5-DClBA) Sm2O3 80 80.8e 4 Ⅰ 490~546 541 8.2 x(5, 5′-DM-2, 2′-dipy) [Eu2(3, 5-DClBA)6(5, 5′-DM-2, 2′-bipy)2-x] Ⅱ 546~590 562 11.7 20.3b (2-x) (5, 5′-DM-2, 2′-bipy) [Eu2(3, 5-DClBA)6] Ⅲ 590~807 798 37.1 y (3, 5-DClBA) [Eu2(3, 5-DClBA)6-y] Ⅳ 807~1 266 816 22.3 60.3d (6-y) (3, 5-DClBA) Eu2O3 a Theoretical total weight loss of C2H5OH and H2O; b Theoretical total weight loss of two 5, 5′-DM-2, 2′-bipy; c Theoretical total weight loss of six 3, 4-DClBA; d Theoretical total weight loss of six 3, 5-DClBA; e Total weight loss. Compared to complexes 1 and 2, complexes 3 and 4 have higher thermal stability due to the absence of coordination water. According to Fig. 6b, the decomposition of complex 3 was observed over 492 K. In the first two consecutive steps, the total weight loss was 19.8%, which is attributed to the removal of neutral 5, 5′-DM-2, 2′-bipy (Calcd. 20.4%). This process occurred at 492~596 K. There was no weight loss at the second endothermic peak, and phase transition might occur. The weight loss of the last two steps was 60.2%, which is attributed to the abscission of six 3, 5-DClBA- anions at 596~1223 K (Calcd. 60.4%). Finally, complex 3 completely collapsed into Sm2O3.
2.5 TG-FTIR analysis
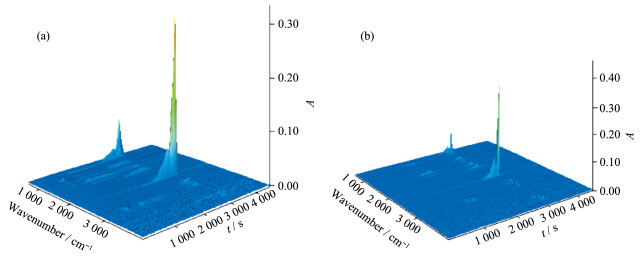
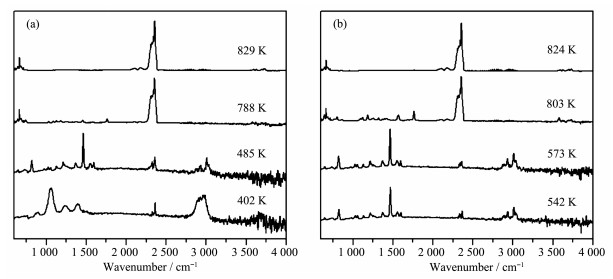
In order to further study the pyrolysis mechanism of the whole complex, the 3D-FTIR spectrum of the gas escaping from the pyrolysis process was obtained by TG/FTIR system. The 3D plots and 2D IR spectra of complexes 2 and 3 are shown in Fig. 7 and 8, respectively. The 3D plots and 2D IR spectra of complexes 1 and 4 are shown in Fig. S3 and S4, respectively. We chose complexes 2 and 3 as the examples to explain in detail. In Fig. 7a, there are four peaks in the 3D diagram of complex 2, corresponding to four-step decomposition in TG curve. In the 2D IR spectra of 401 K, we can observe the weak absorption peaks of H2O (3 560~3 797 cm-1), and the characteristic peaks of ethanol, such as νC-O (1 065 cm-1), νC-H (2 890~2 994 cm-1), δC-H (1 393 cm-1) [24]. The existence of these characteristic bands indicates that the coordination of ethanol and water molecules has been removed in this step. On the 2D IR spectra of 485 K, we could observe the weak characteristic peaks of CO2 (2 294~2 395 cm-1) and some characteristic peaks including νC=C, νC=N (1 600, 1 563, 1 469 cm-1) and νC-N (1 218 cm-1)[25], which leads to the conclusion that neutral 5, 5′-DM-2, 2′-bipy ligands are removed in this step. On the 2D IR spectra of 788 K (Fig. 8a), the characteristic peaks of CO2 (2 287~2 359 cm-1 and 669 cm-1) and H2O (3 560~3 751 cm-1) could be observed, and we could also find some absorption peaks such as νC=O (1 767 cm-1) and νC=C (1 461 cm-1) [26]. The carboxylic acid ligand began to lose in this step. In the IR spectra of the last step at 829 K, only the peaks of CO2 (2 310~2 360 cm-1), CO (2 114, 2 181 cm-1) and H2O (3 594~3 734 cm-1) could be found, which indicates that carboxylic ligands have been completely decomposed.
Figure 7
Figure 8
For complex 3, similar absorption peaks appeared in the IR spectra at 542 and 573 K. The absorption bands at 1 469, 1 557 and 1 600 cm-1 belong to the νC=C and νC=N; the weak absorption peaks at 2 899~3 037 and 826 cm-1 belong to the νC-H and γ=C-H, indicating that neutral bipy ligands have been removed. At 803 K, the characteristic peaks of CO2(2 310~2 360 and 669 cm-1) and H2O (3 562~3 738 cm-1) could be observed[27], while the absorption bands νC=O (1 770 cm-1) and νC=C (1 572, 1 420 cm-1) could also be found. The results show that the products of gas phase include the decomposed and undifferentiated 3, 5-DClBA ligands. In the final infrared spectrum of 824 K, only the bands of CO2 (2 312~2 365 cm-1) and H2O (3 544~3 752 cm-1) could be observed, indicating that the carboxyl ligand has been completely decomposed[28].
2.6 Luminescence properties
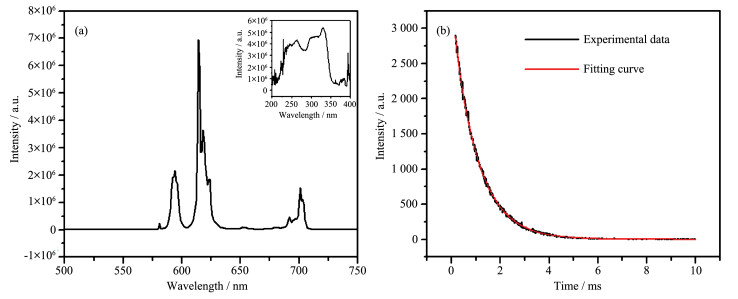
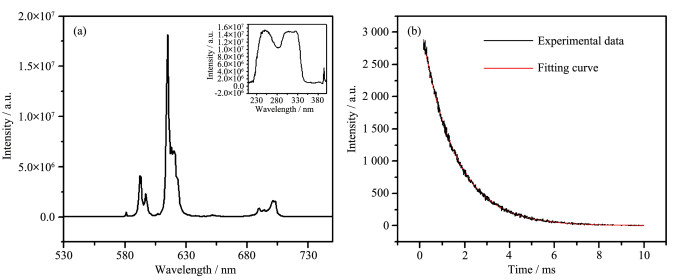
The solid-state photoluminescent of complex 2 and complex 4 were investigated in detail at 298 K. The excitation (Inset) and emission spectra of 2 and 4 are presented in Fig. 9a and 10a, respectively. The excitation spectra of two complexes were recorded at the maximum emission wavelength of 615 nm. In the excitation spectra of the two complexes, the strong absorption band of 230~350 nm is caused by the ligand metal electron transfer band[29]. The emission spectra of complexes 2 and 4 were recorded upon excitation at 329 and 325 nm, respectively. In the emission spectra of the two complexes, five characteristic peaks can be seen at 581, 594, 614, 652, 701 nm and 581, 592, 615, 651, 701 nm, respectively. These characteristic emission peaks are assigned to the 5D0→7Fj (j=0~4) of Eu3+, severally[30-31]. Among these peaks, the strongest peak was 5D0→7F2 at 615 nm, which produces red emission. Eu3+ ions occupy a non-symmetry site in two complexes, because the magnetic dipole transition 5D0→7F0 is totally prohibited in symmetry site[32]. The photoluminescent intensity of 4 was stronger than that of 2, probably owing to that complex 2 contains a coordination water, which can easily cause fluorescence quenching.
Figure 9
 Figure 9. (a) Excitation (Inset) and emission spectra of 2 at 298 K; (b) Fluorescence decay curve of 2
Figure 10
 Figure 10. (a) Excitation (Inset) and emission spectra of 4 at 298 K; (b) Fluorescence decay curve of 4
The fluorescence decay curves and fitting curves of two Eu3+ complexes were also given in Fig. 9b and 10b, respectively. The fluorescence lifetime values were calculated according to the following equation[33]:
$\left.\tau=\left(C_{1} \tau_{1}^{2}+C_{2} \tau_{2}^{2}\right)\right) /\left(C_{1} \tau_{1}+C_{2} \tau_{2}\right)\\ I(t)=C_{1} \exp \left(-t / \tau_{1}\right)+C_{2} \exp \left(-t / \tau_{2}\right) $
where I(t) is the fluorescence intensity varying with time t; C1 and C2 are coefficient; τ1 and τ2 are the fall times. The fluorescence lifetime τ of 2 and 4 are 1.00 and 1.48 ms, respectively.
3. Conclusions
Four novel lanthanide coordination complexes have been successfully synthesized under solvothermal or conventional solution method, namely [Ln2(5, 5′-DM-2, 2′-bipy)2(3, 4 - DClBA)6(H2O)(C2H5OH)] (Ln=Sm (1), Eu(2)) and [Ln(5, 5′-DM-2, 2′-bipy)(3, 5-DClBA)3]2 (Ln=Sm (3), Eu (4)). Complexes 1 and 2 are isostructural and each metal center is eight-coordinated, while the coordination number of Sm3+ ion of 3 is nine. Complexes 1 and 2 are connected to form 2D supermolecular structure by C-H…Cl hydrogen bonding and π-π interactions, while complex 3 is connected to form 2D supermolecular framework by different π-π interactions. TG/FTIR analysis reveals the pyrolysis mechanism of complexes 1~4, and complexes 3 and 4 have good thermal stability. Complexes 2 and 4 can emit intense red light and have long fluorescence lifetimes.
Acknowledgements
The work is supported by the National Natural Science Foundation of China (Grant No.21803016).
Supporting information is available at http://www.wjhxxb.cn
-
-
[1]
Allendorf M D, Bauer C A, Bhakta R K, et al. Chem. Soc. Rev., 2009, 38:1330-1352 doi: 10.1039/b802352m
-
[2]
Cui Y J, Yue Y F, Qian G D, et al. Chem. Rev., 2012, 112:1126-1162 doi: 10.1021/cr200101d
-
[3]
Jia L N, Hou L, Wei L, et al. Cryst. Growth. Des., 2013, 13:1570-1576 doi: 10.1021/cg301810y
-
[4]
Luo Y D, Sun G M, Li D M, et al. Inorg. Chem. Commun., 2011, 14:778-780 doi: 10.1016/j.inoche.2011.03.014
-
[5]
Andiappan K, Sanmugam A, Deivanayagam E, et al. Int. J. Biol. Macromol., 2019, 124:403-410 doi: 10.1016/j.ijbiomac.2018.11.251
-
[6]
Lima P P, Paz F A A, Brites C D S, et al. Org. Electron., 2014, 15:798-808 doi: 10.1016/j.orgel.2014.01.009
-
[7]
Jiang H L, Xu Q. Chem. Commun., 2011, 47:3351-3370 doi: 10.1039/c0cc05419d
-
[8]
Hua Y R, Flood A H. Chem. Soc. Rev., 2010, 39:1262-1271 doi: 10.1039/b818033b
-
[9]
Heffern M C, Matosziuk L M, Meade T J. Chem. Rev., 2014, 114:4496-4539 doi: 10.1021/cr400477t
-
[10]
Ge Y, Cui Y F, Huang Y, et al. Polyhedron, 2019, 159:64-71 doi: 10.1016/j.poly.2018.11.052
-
[11]
Ahmed Z, Iftikhar K. Inorg. Chem., 2015, 54:11209-11225 doi: 10.1021/acs.inorgchem.5b01630
-
[12]
Bernini M C, Gomez G E, Brusau E V, et al. Isr. J. Chem., 2018, 58:1044-1061 doi: 10.1002/ijch.201800095
-
[13]
Bunzli J C, Piguet C. Chem. Soc. Rev., 2005, 34:1048-1077 doi: 10.1039/b406082m
-
[14]
He D H, Di Y Y, Tan Z C, et al. Sol. Energy Mater. Sol. Cells, 2011, 95:2897-2906 doi: 10.1016/j.solmat.2011.06.014
-
[15]
He M, Chen Z, Pineda E M, et al. Eur. J. Inorg. Chem., 2016, 2016:5512-5518 doi: 10.1002/ejic.201600851
-
[16]
Carter K P, Pope S J A, Cahill C L. CrystEngComm, 2014, 16:1873-1884 doi: 10.1039/c3ce42267d
-
[17]
Carter K P, Thomas K E, Pope S J, et al. Inorg. Chem., 2016, 55:6902-6915 doi: 10.1021/acs.inorgchem.6b00408
-
[18]
Carter K P, Zulato C H F, Cahill C L. CrystEngComm, 2014, 16:10189-10202 doi: 10.1039/C4CE01806K
-
[19]
Sheldrick G M. SHELXL-97, Program for the Refinement of Crystal Structures, University of Göttingen, Germany, 1997.
-
[20]
Wang Y, Jin C W, He S M, et al. J. Mol. Struct., 2016, 1125:383-390 doi: 10.1016/j.molstruc.2016.07.007
-
[21]
Wu J C, Li H, Ren N, et al. J. Rare Earths, 2016, 34:1083-1088 doi: 10.1016/S1002-0721(16)60138-2
-
[22]
Liu J Y, Ren N, Zhang J J, et al. Ind. Eng. Chem. Res., 2013, 52:6156-6163 doi: 10.1021/ie400228j
-
[23]
Wu J C, Shi Q, Geng L N, et al. J. Therm. Anal. Calorim., 2017, 131:2993-3001
-
[24]
周孟雪, 任宁, 张建军.物理化学学报, DOI: 10.3866/PKU.WHXB202004071ZHOU Meng-Xue, REN Ning, ZHANG Jian-Jun. Acta Phys.-Chim. Sin., DOI: 10.3866/PKU.WHXB202004071
-
[25]
Zhu M M, Ren N, Zhang J J, et al. Appl. Organomet. Chem., 2018, 32:e4438 doi: 10.1002/aoc.4438
-
[26]
Zhu M M, Ren N, Zhang J J. Inorg. Chim. Acta, 2018, 480:140-148 doi: 10.1016/j.ica.2018.05.022
-
[27]
Wu X F, Ba Y X, Wang X, et al. Bioresour. Technol., 2018, 266:407-412 doi: 10.1016/j.biortech.2018.07.005
-
[28]
Qi X X, Ren N, Zhang D H, et al. Chem. Res. Chin. Univ., 2015, 31:1039-1045 doi: 10.1007/s40242-015-5052-z
-
[29]
Shi S K, Li K Y, Wang S P, et al. J. Mater. Chem. C, 2017, 5:4302-4309 doi: 10.1039/C7TC00727B
-
[30]
Li Y J, Yan B. Inorg. Chem., 2009, 48:8276-8285 doi: 10.1021/ic900971h
-
[31]
Shi S K, Wei D, Li K Y, et al.Appl.Surf.Sci., 2019, 472:150-157 doi: 10.1016/j.apsusc.2018.03.060
-
[32]
Kumar M, Kariem M, Sheikh H N, et al. Dalton Trans., 2018, 47:12318-12336 doi: 10.1039/C8DT02429D
-
[33]
Bünzli J C G, Chauvin A S, Kim H K, et al. Coord. Chem. Rev., 2010, 254:2623-2633 doi: 10.1016/j.ccr.2010.04.002
-
[1]
-
Figure 2 (a) View of 1D chain of 2 along c axis; (b) 2D layered of 2 along b and c axes
Figure 3 (a) Crystal structure of 3; (b) Coordination geometry of Sm3+ ion
Symmetry code: #1:-x+1, -y+2, -z
Figure 4 (a) View of 1D chain structure of 3 along a axis; (b) 2D layered of 3 along a and b axes
Figure 5 PXRD patterns of complexes 1~4 and simulated PXRD patterns of complexes 1 and 3
Figure 9 (a) Excitation (Inset) and emission spectra of 2 at 298 K; (b) Fluorescence decay curve of 2
Figure 10 (a) Excitation (Inset) and emission spectra of 4 at 298 K; (b) Fluorescence decay curve of 4
Table 1. Crystal data and structure refinement for complexes 1~3
Complex 1 2 3 Empirical formula C68H50Cl12N4O14Sm2 C68H50Cl12N4O14Eu2 C66H42Cl12N4O12Sm2 Formula weight 1 873.22 1 876.44 1 809.14 Crystal system Triclinic Triclinic Triclinic Space group P1 P1 P1 a/nm 1.266 00(11) 1.260 68(12) 1.164 60(11) b/nm 1.392 01(12) 1.383 31(12) 1.214 30(12) c/nm 2.354 0(2) 2.340 4(2) 1.340 00(13) α/(°) 90.850 0(10) 90.707 0(10) 104.511(3) β/(°) 91.270 0(10) 91.398 0(10) 92.930 0(10) γ/(°) 113.210(3) 113.189(4) 98.252(2) Volume/nm3 3.810 5(6) 3.749 5(6) 1.808 0(3) Z 2 2 1 Dc/(g·cm-3) 1.633 1.662 1.662 Absorption coefficient/mm-1 2.009 2.149 2.112 F(000) 1 852 1 856 890 Crystal size/mm 0.25×0.13×0.11 0.17×0.12×0.10 0.16×0.12×0.10 θ range for data collection/(°) 2.32~25.02 2.34~25.02 2.26~25.02 Limiting indices -14 ≤ h ≤ 14, -14 ≤ h ≤ 13, -13 ≤ h ≤ 13, -16 ≤ k ≤ 15, -16 ≤ k ≤ 13, -14 ≤ k ≤ 12, -28 ≤ l ≤ 23 -27 ≤ l ≤ 27 -15 ≤ l ≤ 15 Reflection collected, unique Completeness to θ=25.02°/% 19 489, 13 257(Rint=0.038 9) 19 159, 13 034(Rint=0.037 5) 9 237, 6 291(Rint=0.028 8) 98.5 98.5 98.5 Max. and min. transmission 0.809 2 and 0.633 5 0.813 8 and 0.711 5 0.816 6 and 0.728 7 Data, restraint, parameter 13 257, 2, 906 13 034, 2, 906 6 291, 0, 435 Goodness-of-fit on F2 1.021 1.033 1.018 Final R indices [I > 2σ(I)] R1=0.057 4, wR2=0.138 5 R1=0.048 7, wR2=0.091 5 R1=0.037 5, wR2=0.060 7 R indices (all data) R1=0.089 5, wR2=0.151 8 R1=0.089 0, wR2=0.101 3 R1=0.051 3, wR2=0.064 0 Largest diff. peak and hole/(e·nm-3) 1 570 and -1 728 1 394 and -696 1 159 and -540  下载: 导出CSV
Table 2. Pyrolysis data for complexes 1~4
Complex Step Temperature range/K Tp of DTG/K Weight loss/% Probable expelled groups Intermediate and residue Found Calcd. 1 Ⅰ 368~432 400 3.8 3.4a C2H5OH+H2O [Sm2(3, 4-DClBA)6(5, 5′-DM-2, 2′-bipy)2] Ⅱ 432~658 474 19.4 19.7b 2(5, 5′-DM-2, 2′-dipy) [Sm2(3, 4-DClBA)6] Ⅲ 658~819 792 38.9 x(3, 4-DClBA) [Sm2(3, 4-DClBA)6-x] Ⅳ 819~1 266 836 19.2 58.3c (6-x)(3, 4-DClBA) Sm2O3 81.3 81.4e 2 Ⅰ 374~423 401 3.4 3.4a C2H5OH+H2O [Eu2(3, 4-DClBA)6(5, 5′-DM-2, 2′-bipy)2] Ⅱ 423~662 479 18.6 19.6b 2(5, 5′-DM-2, 2′-dipy) [Eu2(3, 4-DClBA)6] Ⅲ 662~803 782 32.5 x (3, 4-DClBA) [Eu2(3, 4-DClBA)6-x] Ⅳ 803~1 267 823 25.0 58.2c (6-x)(3, 4-DClBA) Eu2O3 79.5 81.2e 3 Ⅰ 492~550 540 9.4 x (5, 5′-DM-2, 2′-dipy) [Sm2(3, 5-DClBA)6(5, 5′-DM-2, 2′-bipy)2-x] Ⅱ 550~596 566 10.4 20.4b (2-x) (5, 5′-DM-2, 2′-bipy) [Sm2(3, 5-DClBA)6] Ⅲ 596~816 802 41.7 y (3, 5-DClBA) [Sm2(3, 5-DClBA)6-y] Ⅳ 816~1 223 827 18.5 60.4d (6-y) (3, 5-DClBA) Sm2O3 80 80.8e 4 Ⅰ 490~546 541 8.2 x(5, 5′-DM-2, 2′-dipy) [Eu2(3, 5-DClBA)6(5, 5′-DM-2, 2′-bipy)2-x] Ⅱ 546~590 562 11.7 20.3b (2-x) (5, 5′-DM-2, 2′-bipy) [Eu2(3, 5-DClBA)6] Ⅲ 590~807 798 37.1 y (3, 5-DClBA) [Eu2(3, 5-DClBA)6-y] Ⅳ 807~1 266 816 22.3 60.3d (6-y) (3, 5-DClBA) Eu2O3 a Theoretical total weight loss of C2H5OH and H2O; b Theoretical total weight loss of two 5, 5′-DM-2, 2′-bipy; c Theoretical total weight loss of six 3, 4-DClBA; d Theoretical total weight loss of six 3, 5-DClBA; e Total weight loss.
下载: 导出CSV
-


 扫一扫看文章
计量
- PDF下载量: 6
- 文章访问数: 1716
- HTML全文浏览量: 258
 下载:
下载:
