Figure 1.
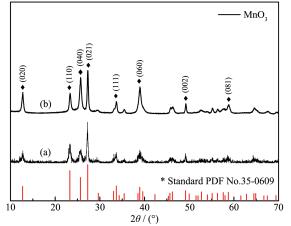
XRD patterns of the precursor (a) and the product calcined at 350 ℃ in air for 2 h (b)

With the improvement of the safety awareness of people in recent years, more and more attention has been paid to the devices in the gas sensing field for detecting volatile organic compound (VOCs) vapors. Therefore, a large amount of functional nanomaterials are widely used in this field because of their transfer- ability, easy manufacture, low cost, miniaturization, and so forth. As a layered n -type metal oxide semicon- ductor (MOS), nanometric molybdenum oxide (MoO3) possesses an indirect band gap of approximately 2.39~ 2.9 eV[1]. It demonstrates wide promising application in fields including gas sensors[2], photocatalysis[3], gaschro- mic[4], energy storage[5], and photochromic devices[6] due to its high reactivity characteristics, surface effect and intractable quantum confinement effect. Well - known, there are three different MoO3 crystal forms[7] : the ther- modynamically stable α - MoO3, metastable hexagonal h-MoO3, and monoclinic β-MoO3. Thereinto, orthorhom- bic MoO3 (α- MoO3) has grabbed more attention because of its unique layered crystal structure that facilitates the diffusion of gas molecules. For example, Mohamed et al. [8] reported the framework of 1% GO. MoO3-x irregular circular shape via an environmentally solvothermal and next annealing route, which exhibited efficient visible light photocatalysis and gas sensing applications. The gas sensor based on 3D α-MoO3 hier- archical nanoflowers prepared by Sui et al. [9] showed more splendidly sensitive and selective towards 45 mg· m-3 triethylamine (TEA) detection at the operating tem- perature of 170 ℃. Li et al. [10] also used novel 1D α - MoO3/ZnO compounds to greatly enhance the sensing properties from 6.5 to 19 for 450 mg·m-3 ethanol. These studies all show that α-MoO3 is an excellent sensing material. Nevertheless, the advance in high- performance gas detection technology remains a great challenge in the morphology design of α-MoO3 nanoma- terials.
TEA, as a representative VOC, is a pungent organ- ic amine released from corrupted fish and shells, which has been mainly used in organic solvents and efficient catalysts in industrial production at present. But it′s prone to generate risks to human beings in virtue of its inflammable, toxic and explosive nature, and causes a significant damage to the respiratory system, resulting in pulmonary edema and even death[11-12]. In line with Occupational Safety and Health Authority (OSHA) pre- scribed levels of permissible exposure, the actual threshold limit value (TLV) of TEA concentration in the air is 45 mg·m-3, and the TLV is 4.5 mg·m-3 recog- nized by American Conference of Governmental Indus- trial Hygienists (ACGIH)[13]. Hence, setting strict crite- rion to quickly detect and real- time monitoring mg·m-3 (or even lower) levels of TEA is considerably signifi- cant for assessing fish freshness and identifying delete- rious environments.
At present, nanosized MoO3 with different mor- phologies and structures have been prepared to qualita- tively detect various VOCs, such as nanoparticles[14], nanoplates[15], nanowires[16], nanobelts[17], nanorods[18], nanofibers[19], nanotubes[20], films[21], hollow spheres[22], and other hierarchical structures[23]. Some studies also have proven that the gas sensitivity of nanomaterials can be dramatically affected by structure characteris- tics. Li et al.[24] obtained different kinds of SnO2 nano- flowers and proved that the surface area with sufficient gas diffusion is beneficial to enhance the sensing per- formance of SnO2 nanoflower sensor. Zeng et al.[25] con- structed hierarchical WO3 flower-like architectures and measured the thickness as well as pore size of thin pet- al structures, expounding the mechanism of excellent ethanol gas sensing properties. Li reported the morphol- ogy controllable synthesis of MoO3 lamellar flowers and preparation of reticulated porous microspheres, and reflected the ideal ethanol gas response[26]. Neverthe- less, most of the above measures are usually complicat- ed or doped surfactants or need templates, and the characteristics of these MoO3 gas sensing technology with leaf-like nanostructures have not been announced.
Herein, we reported a facile strategy to design and fabricate multichip MoO3 leaf - like architecture by the oxidization conversion of synthesized low-crystallization MoO3 precursors by solvothermal method. In actual testing, it manifests preeminent TEA gas response and topgallant recovery performance at lower (mg·m-3) fast detection level due to its large specific surface area and porous texture. The mechanism is discussed in detail in this article, thereby providing potential research orientation and technical prospect for the preparation of higher performance sensors on single semiconductor metal oxide.
All organic chemical reagents used for the synthe- sis of MoO3 nanoleaves were in the analytic grade puri- ty and applied to starting materials without any deeper purification process. Bis(acetylacetonato) dioxomolyb- denum (Ⅵ) was purchased from Macklin Biochemical Co., Ltd(Shanghai, China). Acetic acid was purchased from Luoyang Shangyanggong Chemical Reagent Tech- nologies Co., Ltd (Luoyang, China).
Originally, 0.35 mmol bis(acetylacetonato) dioxo- molybdenum (Ⅵ) (C10H14MoO6) was dissolved in acetic acid (33 mL) and deionized water (2 mL) mixed solu- tion under the magnet stirring to form a light blue pre- cursor emulsion. After agitating for 30 min, the ob- tained mixture solution was poured into a 50 mL Teflon- lined stainless steel autoclave and kept for 8 h at 150 ℃. Naturally cooled, the light blue precipitate was collected by centrifugation at 8 000 r·min-1 and washed with deionized water plus ethanol for three times, and then dried overnight in air at 60 ℃. Finally, the precursor was annealed at 350 ℃ for 2 h in a muf- fle furnace with a heating rate of 2 ℃ ·min-1, the dark blue powders were received after cooling to room tem- perature.
The individual crystal structure and purity of as - fabricated pure MoO3 specimens were characterized by X-ray powder diffraction (XRD, Bruker AXS D8, 40 kV, 150 mA) with Cu Kα radiation (λ=0.154 1 nm) in a recorded range of 10° ~70° (2θ) at a rate of 10 (°) · min-1. The microstructure was identified by field emis- sion scanning electron microscopy (FESEM, FEI Quan- ta 250 FEG) equipped with an energy dispersive X-ray spectroscopic (EDS). High - resolution transmission electron microscopy (HRTEM, JEOL JEM-2100, 200 kV) was used to investigate its lattice conformation and surface structure. Simultaneously, the ultraviolet - visi- ble spectroscopy (UV-Vis) was judged by a UV spectro- photometer (Cary5000, Agilent). Thermogravimetry dif- ferential scanning calorimetry (TG - DSC) analysis was completed on a Simultaneous Thermal Analyzer (STD Q600) in an air flow of 20 mL·min-1 at a heating rate of 10 ℃ ·min-1. In this process the starting temperature was room temperature and the terminating temperature was 1 000 ℃. The N2 nitrogen adsorption - desorption isotherms were researched at liquid nitrogen tempera- ture using a Quantachrome Autosorb - iQ2 absorption analyzer, and the specimen was degassed at 180 ℃ for more than 8 h.
The process of fabricating the sensor substrates was the same as our previous published articles[27-29]. Electrical properties of the devices were real - time de- tected by Beijing Elite Tech. CGS-4 intelligent test me- ter. The response of the sensor (Ra/ Rg) was calculated as the ratio of the sensor resistance balance in air (Ra) to that in test gas (Rg). What′s more, the response and recovery time (Tres and Trec) is defined by the time for 90% of the initial equilibrium resistance change during gas injection and release, successively. During this test, the relative humidity (RH) was kept at 35% and floats 2%.
The XRD patterns of multichip leaf-like MoO3 nanopore structures were characterized and the results are shown in Fig. 1. Thereinto, curve (a) has many weak impurity peaks, which indicates the poor crystallinity of the unannealed MoO3 precursors, and curve (b) is the phase after annealed at 350 ℃ in air for 2 h. Ap- parently, all intensity diffraction peaks shown in the patterns can be assigned to the pristine orthorhombic α- MoO3 phase information and the space group of Pbnm (62) according to PDF No.35-0609 with parameters: a= 0.396 3 nm, b=1.385 6 nm, c=0.369 7 nm. Further- more, based on the Bragg position at the bottom, it shows no any detectable impurities, indicating the com-plete crystallization transformation of MoO3. The inten- sity of diffraction peaks of (110), (040) and (021) are extremely stronger than other peaks, revealing a highly anisotropic growth of the leaf-like MoO3 pore struc- tures. Similarly, the two layers twist the connected [MoO6]6- octahedron to form a layered crystal struc- ture[30], thereby exhibiting a texture effect correspond- ing to the orientation of its shape. According to Debye- Scherrer principle[31] as shown in equation: Dsize=kλ/(βcosθ), where k and λ represent Scherrer constant and the wavelength of the X - ray source, taking fixed values 0.89 for k and 0.154 nm for λ; β is the estimated full width at half maximum (FWHM); θ is the actual Bragg angle. Thus, the theoretical calculated average particle size of as-prepared MoO3 products that corre- spond to the (021) plane diffraction peak is about 26.697 nm, showing a normal grain thickness of this crystal plane.
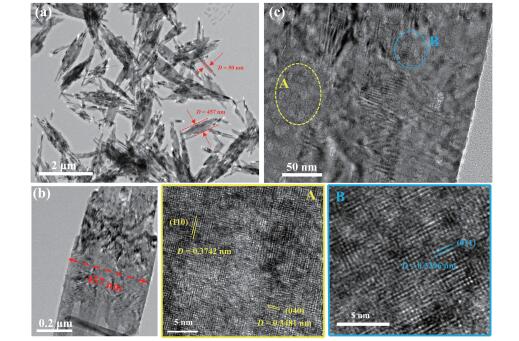
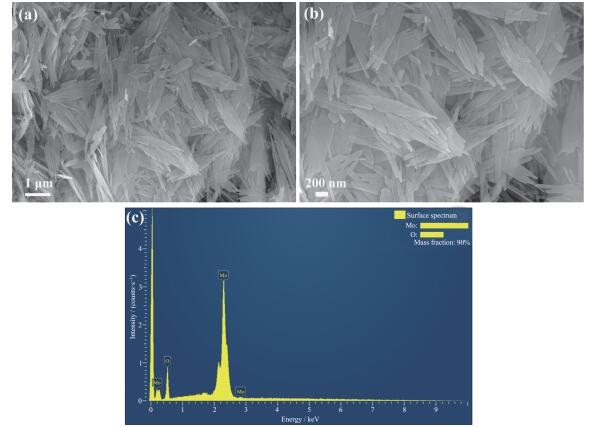
The morphology and structure of the obtained dark blue MoO3 powders were analyzed through SEM, EDS and TEM. From the perspective of SEM panorama (Fig. 2a and 2b), one can see that the typical MoO3 sam- ple is leaf-like and consists of massive stacked nanow- ires. According to Fig. 2c, the EDS spectra measure- ment of as-prepared material showed that the mass frac- tion of element Mo and O reached 90%, which is indic- ative of pristine MoO3 by successfully constructed. For the purpose of further surveying the single microstruc- ture of the nanoleaves, TEM was employed to achieve a higher magnification image. Visually, Fig. 3a and 3c show that the multichip leaf-like individual MoO3 nano-structure were assembled from the partial overlaying of abundant irregular 1D nanowires with rough surfaces and an average width of about 50 nm. Fig. 3b can clear- ly show the single leaf size, and its composition diame- ter is about 457 nm. In addition, high quality and clear inter plane lattice fringes of individual MoO3 nanole- aves are accurately observed in designated A, B region. However, it is clear that the lattice spacing at two different adjacent lattice locations of the MoO3 nanole- aves is not evenly distributed in the area A. Clear lat- tice spacing (DLS) was determined to be 0.374 2 and 0.348 1 nm, respectively, corresponding to the (110) and (040) crystal planes of MoO3. Additionally, most of the other MoO3 nanoleaves exhibit the narrower DLS as shown in area B. The DLS is approximately 0.329 6 nm, which can be indexed to the (021) lattice plane (marked blue). These findings prove that the preferen- tial growth lattice plane is (021), which is also consis- tent well with above-mentioned XRD data that the intensity of the (021) shrill peak is stronger than other peaks.
For another important representation, the UV -Vis diffuse reflectance absorption of MoO3 nanoleaves in a wavelength range of 300~800 nm is shown in Fig. 4a. It indicates a strong absorption edge has taken place in the visible light region (380~780 nm). Moreover, a notable absorption peak around 425 nm could be seen in the spectrum, which was also measured by Alsaif in reported literature[32]. As exhibited in Fig. 4b, the opti- cal properties indirect band gap (Eg) of MoO3 nanole- aves was calculated to be 2.85 eV via the extrapolating equation: (αhν)1/2= hν-Eg. Obviously, we found it was indeed marginally lower than the theoretical value of distorted octahedral orthorhombic MoO3 (2.9 eV). Through the common sense of photocatalysis, the larger bandgap energy of semiconductor materials is quite dif- ficult to generate electron holes. Hence, this leaf - like structure of α- MoO3 is expected to impart ranking gas sensitive properties.

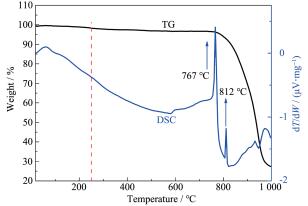
To demonstrate the formation principle of speci- mens, the conversion of precursors during annealing treatment was also studied by TG and DSC at a pro- grammable controlled temperature elevation rate of 10 ℃·min-1 in air. As shown in Fig. 5, the MoO3 precur- sor underwent an obvious mass loss below 200 ℃, which is probably owing to the loss of deliquescent moisture and the decomposition of residual organic reagent on the surface of the leaf - like materials. In a later stage (350~760 ℃), a dramatic changes in energy and slight changes in weight, as well as two sharp exo- thermic peaks at 767 and 812 ℃ were observed, indi- cating that a stable α - MoO3 phase gradually formed due to the highly crystalline MoO3 precursor in the air, which can be approved by the XRD and EDS results. Simultaneously, there were no detectable changes observed in the TG curve, indicating formation of ther- mally stable MoO3 phase. So, when these samples were calcined at 350 ℃ in this experiment, it′s structure and chemical activity retained steadily, which is benefi- cial to the gas transfer and ultimately facilitate gas sensing properties. There was further abrupt weight loss above 800 ℃, corresponding to the melting and the sublimation behavior of MoO3.
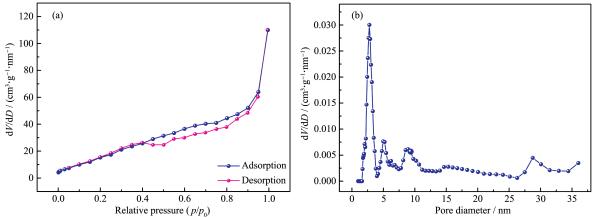
Specifically, the specific surface area and porosity of the materials are necessary for their gas sensing properties. In order to survey the surface adsorption properties, the N2 adsorption isotherms and correspond- ing Barret-Joyner-Halenda (BJH) pore-size distribution measurements[33] are shown in Fig. 6. According to the IUPAC classification criteria, the leaf - like MoO3 showed a type Ⅳ isotherm with a slightly skewed H3 hysteresis loop observed at a p/p0 range of 0.4~1 (Fig. 6a). The molecules adsorbed under a certain pres- sure couldn′t be desorbed due to the presence of sur- face tension, resulting in a non- overlapping of the curves. Fig. 6b shows the corresponding pore size distri-bution, and the diameter of the hole was mostly 2.45 nm (mesoporous range). Correspondingly, the Brunauer -Emmett-Teller (BET) specific surface area was calcu- lated to be approximately 110 m2∙g-1. These results co- incide with the transmission image shown in Fig. 3, which indicates the potential application of α - MoO3 multichip leaf-like nanopore structures as gas sensors.
It is proverbial that actual operating temperature play a vital role in MOS gas sensors on account of their heavily influences on microscopic state of sensing materials, along with the physicochemical adsorption reaction that occurs during gas testing. Consequently, temperature dependent experiment of the sensors to 2.25 g·m-3 triethylamine vapors was measured under varying temperatures in a range of 240~340 ℃ and the results are shown in Fig. 7. From this dotted line chart, it could be clearly understood that the response value of the MoO3 sensors gradually varied along with the increased temperature and reached the maximum value of 4 460 at 300 ℃, which demonstrates that the manu- factured sensor possesses ultra-sensitivity to TEA. The temperature dependence phenomenon can be interpret- ed in the chemical redox interaction between the nanodevice and target test gas. At a low temperature (< 300 ℃), as the temperature increased, more and more TEA molecules were adsorbed on the surface of α-MoO3. But it still has no enough thermal energy to break the shackles and combine with the adsorbed oxy- gen species (Oδ+), which causes the relatively high trend response from 240 to 300 ℃. With the increase again of the operating temperature (300~340 ℃), the desorption rate of triethylamine molecules would be greater than adsorption rate, revealing a fluctuation in the reduced response. Therefore, the thermal energy which TEA molecules provide by absorbing from the surrounding environment is large enough to surmount the activation energy barrier of the α- MoO3 surface reaction at 300 ℃. Simultaneously, the conversion of adsorbed oxygen can also attract more electrons from the conduction band of sensing materials, promoting the change in the carrier concentration, resulting in a sharp drop in resistance. According to the definition of sensitivity, the response value to TEA maximum increases at this time[34-35].
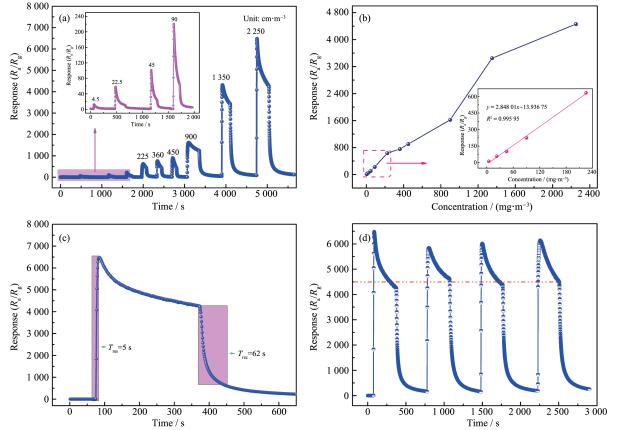
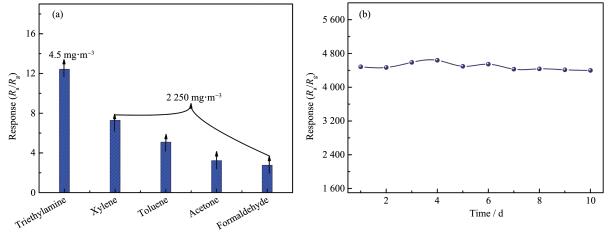
On the other hand, Fig. 8a depicts the correlation between TEA concentration and response value of the MoO3 sensors operated at 300 ℃. Apparently, the leaf- like MoO3 could attain 12.4 at the lower detection level (4.5 mg·m-3). The resistance of the sensors declined sharply as soon as they were placed in the TEA reduc- ing vapors, while exposed to air, the resistance value could be easily restored to its initial state. As the con- centration increased, this dynamic reversibility endowed a higher sensitivity to the sensor. Further- more, the responses of TEA sensors were an increase of greater magnitude with the gas concentration increas- ing in the entire concentration range of 4.5~2 250 mg· m-3, which fitted next equation of α-MoO3 response (y) and TEA concentration (x) was y=2.848 01x-13.936 75, and the correlative coefficient R2 was 0.995 95 at the low concentration (4.5~225 mg·m-3), as shown in Fig. 8b. Thereout, on the basis of above analysis and the formula of theoretical detection limit: DL=3(Nrms/S), where Nrms is root mean square of noise and S is slope, we calculated the theoretical TEA minimum detection concentration of α-MoO3 sensor to be 0.009 mg·m-3. Accordingly, the time of the response and recovery (Tres/ Trec) are also key parameters for evaluating the perfor- mance of the gas sensor in application. Fig. 8c shows the typical response and recovery transients of α -MoO3 sensor toward 2.25 mg·m-3 triethylamine gas under their optimum working temperature. The response time was 5 s and the recovery time was 62 s, which demon- strates the performance of fast detection. Fig. 8d illus- trates four dynamic cycle-stability curves of the α-MoO3 sensor to 2.25 mg·m-3 TEA at 300 ℃, indicating that the amplitude and optimal response are similar to main- tain about 4 460. These results conclude that the sen- sor has an excellent reproducibility and repeatability.
To quantify the excellently selectivity and stabili-ty of α- MoO3 based sensors, the real responses of the sensors to 2.25 g·m-3 of xylene, toluene, acetone, and formaldehyde interfering gases are investigated at 300 ℃ and summarized in Fig. 9a. Obviously, its responses are negligible compared to smaller units (4.5 mg·m-3) for TEA. Fig. 9b more fully demonstrates the repeatability and reversibility of its practical applica- tion, and no apparent variation trend in response upon exposed to 2.25 g·m-3 TEA at 300℃ for a period of 10 d. Noteworthily, the oxidation process of the probe gases is actually the result of product dehydrogenation, so the enthalpy change data of each substance is partic- ularly important. From consulting the literature, the experimental measurements for acetone, toluene, form- aldehyde, xylene and triethylamine are 393, 379, 364, 157.8 and 99.64 kJ·mol-1, respectively. Those results can be known as minimal enthalpy change required for triethylamine decomposition. Because TEA has three ethyl groups, while the nitrogen atom has a long pair conjugate electrons that can donate to form bonded key energy, it is preferably adsorbed on Lewis- acid Moδ+ sites. Hence, it indicates the greatly palmary selectivi- ty, reversible and stable response advantages of the sensors in quantitative testing.
The complicated mechanism of surface control for triethylamine gas sensing can be explained in detail by the resistance change due to gas particles adsorption and desorption, and the varied thickness of electronic depletion layer (EDL) model[36-38]. The specific details are shown in Fig. 10. According to the related litera- ture[39-40], the final oxidation product of TEA molecule under photocatalysis is thought to be functional ethyl- ene amine monomers. Therefore, the triethylamine sensing principle over α-MoO3 participation is inter- preted as the constantly transformation of TEA to ethyl- ene amine monomers and eventually evolved into N2, CO2 and H2O. Then, when the α -MoO3 device is placed in atmospheric environment, the chemical oxygen mole- cules would be adsorbed on the surface of MoO3 nanole-aves combining with free electrons to form reactive oxy- gen species (e.g. O2-, O-, O2-). Due to rough surface and inter-nanowire channels in α-MoO3 leaf-like structure, the carrier transport is more convenient while relatively high resistance and thick space charge layer would be produced in dynamic equilibrium of the chemisorption process (defined as Ra). But when exposed to TEA with high concentration at a moderate temperature, the active oxygen of α-MoO3 is catalytically oxidized, simultaneously accompanying with the partial reduc- tion of metal molybdenum ion, more quantity of Mo6+ would be reduced to Mo5+ or other valence, which causes that the carrier conductivity of the non- stoichiometric α-MoO3 is comparatively higher than stoichiometric α-MoO3. In the process, leaf - like struc- ture plays an exceptional role in the large effective specific surface area. Furthermore, it can provide more active sites to help the C - H diffusion of the triethyl- amine methyl group, which is dehydrogenated to amine and hydrogen. They react with the dissociative oxygen ions and release the captured electrons back into the conduction band of α-MoO3, resulting in a decrease in resistance (Rg) and thinned depletion layer. Therefore, the response of α-MoO3 sensor is obtained according to the sensitivity formula. Fig. 10 gives a graphical description where the value of (Ec-Ef) is widened and the value of (Ef-Ev) is narrowed. The overall oxidation- reduction reaction in the sensitive process can be sim- plified to the following equation:
|
$ \begin{gathered} {\text{E}}{{\text{t}}_2}{\text{N}} - {\text{C}}{{\text{H}}_2} - {\text{C}}{{\text{H}}_3}\left( {{\text{ads}}} \right) + {{\text{O}}_\delta }\left( {\text{s}} \right) \to \hfill \\ {{\text{N}}_2} + {{\text{H}}_2}{\text{O}} + {{\text{V}}^{2 + }} + {\text{C}}{{\text{O}}_2} + 2{{\text{e}}^ - } \hfill \\ \end{gathered} $ |
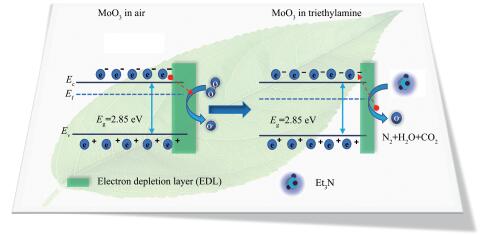
where Oδ and V2+ represent the chemical oxygen and homologous oxygen vacancy at the atomic lattice level; (s) and (ads) indicate surface sites and types of adsorp- tion state, separately. Taking all the above factors into account, the consequents also can be better to con- clude super sensitive response.
Taking into account the gas sensitive properties of different single metal oxides, a comparison between our present experimental data and literature published about TEA based on typical pure MOSs is summarized in Table 1[40-44]. Palpably, our sensor indicates a satis- factory TEA gas sensing ability from some aspects (such as limit of detection, sensor response, and nano- structures).
 下载:
导出CSV
下载:
导出CSV
| Material | Microstructure | Concentration / (mg·m-3) | T / ℃ | Ra/Rg | Limit of detection / (mg·m-3) | Ref. |
| SnO2 | Nanorods | 450 | 350 | 140 | 4.5 | [41] |
| V2O5 | Hollow spheres | 450 | 370 | 7.3 | 0.045 | [40] |
| α-Fe2O3 | Sea-urchin-like | 450 | 350 | > 19 | 81 | [42] |
| CuO | Microspheres | 450 | 230 | 102 | < 22.5 | [43] |
| TiO2 | Nanosheets | 450 | 350 | 2.55 | — | [44] |
| α-MoO3 | Nanoleaves | 450 | 300 | 903.8 | 4.5 | This work |
In summary, the multichip leaf-like MoO3 with nanowire channel structure were successfully prepared by a simple solvothermal route and characterized for the accurate triethylamine sensing at lower (mg·m-3) detection level. The manufactured sensor devices exhibit an unexpected response recovery and excellent selectivity, which highlights the practical advantages of fast triethylamine detection. In the meantime, we dis- cuss in depth surface -controlled model sensing mecha- nism of this structure in detail, which indicates a great significance to explore the application of other mor- phologies of α-MoO3 nanomaterials in gas sensing field.
Yan H H, Song P, Zhang S, et al. Sens. Actuators B, 2016, 236:201-207 doi: 10.1016/j.snb.2016.05.139
Ji H C, Zeng W, Li Y Q. Mater. Res. Bull., 2019, 118:110476 doi: 10.1016/j.materresbull.2019.05.001
Che S W, Behura S K, Berry V. ACS Nano, 2019, 13(11):12929-12938 doi: 10.1021/acsnano.9b05484
Yao D D, Ou J Z, Latham K, et al. Cryst. Growth Des., 2012, 12(4):1865 doi: 10.1021/cg201500b
Chen X F, Hu S Q, Liu Y, et al. J. Alloys Compd., 2020, 834:155096 doi: 10.1016/j.jallcom.2020.155096
Haldar R, Heinke L, Woll C. Adv. Mater., 2019, 32:1905227
Zalapa-Garibay M A, Torres T D, Arizmendi-Morquecho A M, et al. Results Phys., 2019, 13:102227 doi: 10.1016/j.rinp.2019.102227
Mohamed M M, Salama T M, Morsy M, et al. Sens. Actuators B, 2019, 299:126960 doi: 10.1016/j.snb.2019.126960
Sui L L, Song X X, Cheng X L, et al. CrystEngComm, 2015, 17(34):6493-6503 doi: 10.1039/C5CE00693G
Li J T, Liu H J, Fu H, et al. J. Alloys Compd., 2019, 788:248-256 doi: 10.1016/j.jallcom.2019.02.086
蒋余芳, 吴海燕, 储向峰, 等.无机化学学报, 2019, 35(7):1163-1168JIANG Yu-Fang, WU Hai-Yan, CHU Xiang-Feng, et al. Chinese J. Inorg. Chem., 2019, 35(7):1163-1168
Wu H, Ma Z, Lin Z X, et al. J. Nanomater., 2019, 9(3):388 doi: 10.3390/nano9030388
Zhai C B, Zhu M M, Jiang L N, et al. Appl. Surf. Sci., 2019, 463:1078-1084 doi: 10.1016/j.apsusc.2018.09.049
Santos E B, Sigoli F A, Mazali I O. J. Solid State Chem., 2012, 190:80-84 doi: 10.1016/j.jssc.2012.02.012
Qin H Y, Cao Y L, Xie J, et al. Sens. Actuators B, 2017, 242:769-776 doi: 10.1016/j.snb.2016.11.081
Zhou J, Xu N S, Deng S Z, et al. Adv. Mater., 2003, 15(21):1835-1840 doi: 10.1002/adma.200305528
Mo Y F, Tan Z G, Sun L P, et al. J. Alloys Compd., 2020, 812:152166 doi: 10.1016/j.jallcom.2019.152166
Xia T, Li Q, Liu X D, et al. J. Phys. Chem. B, 2006, 110(5):2006-2012 doi: 10.1021/jp055945n
Li S Z, Shao C L, Liu Y C, et al. J. Phys. Chem. Solids, 2006, 67(8):1869-1872 doi: 10.1016/j.jpcs.2006.04.017
Hu S, Wang X. J. Am. Chem. Soc., 2008, 130(26):8126-8127 doi: 10.1021/ja801448c
Gavrilyuk A, Tritthart U, Gey W. Sol. Energy Mater. Sol. Cells, 2011, 95(7):1846-1851 doi: 10.1016/j.solmat.2011.02.006
Sui L L, Zhang X F, Cheng X L, et al. ACS Appl. Mater. Inter-faces, 2017, 9(2):1661-1670 doi: 10.1021/acsami.6b11754
Jiang W H, Meng L L, Zhang S F, et al. Sens. Actuators B, 2019, 299:126888 doi: 10.1016/j.snb.2019.126888
Li T M, Zeng W, Long H W, et al. Sens. Actuators B, 2016, 231:120-128 doi: 10.1016/j.snb.2016.03.003
Zeng W, Zhang H, Wang Z C. Appl. Surf. Sci., 2015, 347:73-78 doi: 10.1016/j.apsusc.2015.04.060
Li Y Q. Physica E, 2017, 94:22-24 doi: 10.1016/j.physe.2017.07.010
Wang Y, Meng X N, Yao M X, et al. Ceram. Int., 2019, 45(10):13150-13157 doi: 10.1016/j.ceramint.2019.03.250
Tao Z H, Li Y W, Zhang B, et al. Sens. Actuators B, 2019, 298:126889 doi: 10.1016/j.snb.2019.126889
Xue D P, Wang P T, Zhang Z Y, et al. Sens. Actuators B, 2019, 296:126710 doi: 10.1016/j.snb.2019.126710
Ji H C, Zeng W, Li Y Q. Physica E, 2019, 114:113646 doi: 10.1016/j.physe.2019.113646
黄晓东, 白守礼, 李殿卿, 等.无机化学学报, 2005, 21(8):1143-1148HUANG Xiao-Dong, BAI Shou-Li, LI Dian -Qing, et al. Chinese J. Inorg. Chem., 2005, 21(8):1143-1148
Alsaif M, Latham K, Field M R, et al. Adv. Mater., 2014, 26(23):3931-3937 doi: 10.1002/adma.201306097
Zhai C B, Zhu M M, Jiang L N, et al. Appl. Surf. Sci., 2019, 463:1078-1084 doi: 10.1016/j.apsusc.2018.09.049
Hu J, Liang Y F, Sun Y J, et al. Sens. Actuators B, 2017, 252:116-126 doi: 10.1016/j.snb.2017.05.113
Zhou X, Feng W, Wang C, et al. J. Mater. Chem. A, 2014, 2(41):17683-17690 doi: 10.1039/C4TA04386C
Lee J H. Sens. Actuators B, 2009, 140(1):319-336 doi: 10.1016/j.snb.2009.04.026
李平, 张孝贤, 斯颖, 等.无机化学学报, 2020, 36(3):566-574LI Ping, ZHANG Xiao-Xian, SI Ying, et al. Chinese J. Inorg. Chem., 2020, 36(3):566-574
Sunu S S, Prabhu E, Jayaraman V, et al. Sens. Actuators B, 2004, 101(1/2):161-174
De la Fuente J R, Jullian C, Saitz C, et al. J. Org. Chem., 2005, 70(22):8712-8716 doi: 10.1021/jo050796q
Wu M Z, Zhang X F, Gao S, et al. CrystEngComm, 2013, 15(46):10123-10131 doi: 10.1039/c3ce41471j
Wang D, Chu X F, Gong M L. Sens. Actuators B, 2006, 117(1):183-187 doi: 10.1016/j.snb.2005.11.022
Zhang F H, Yang H Q, Xie X L, et al. Sens. Actuators B, 2009, 141(2):381-389 doi: 10.1016/j.snb.2009.06.049
Wu Y P, Zhou W, Dong W W, et al. Cryst. Growth Des., 2017, 17(4):2158-2165 doi: 10.1021/acs.cgd.7b00102
Wang Y, Liu J F, Wang M, et al. Inorg. Chem., 2017, 56(3):1504-1510 doi: 10.1021/acs.inorgchem.6b02603

Figure 1 XRD patterns of the precursor (a) and the product calcined at 350 ℃ in air for 2 h (b)

Figure 3 Low (a) and high (b) magnification TEM image of MoO3 nanoleaves; Corresponding HRTEM image and DLS of labeled areas A, B (c)

Figure 4 (a) UV-Vis diffuse reflectance spectrum of MoO3 nanoleaves; (b) (αhν)1/2 vs hν (photon energy) curve

Figure 6 (a) N2 adsorption-desorption isotherm of MoO3 nanoleaves; (b) Corresponding BJH pore size distribution curve

Figure 8 Dynamic response recovery curve of concentration (a), corresponding linear relationship between response and concentration (b), Tres and Trec (c), and repeatability (d) of MoO3 nanoleaves

Figure 9 Selectivity of sensor to various gases (a) and long-term stability test (b) of MoO3 nanoleaves

Figure 10 Schematic illustration for gas sensing mechanism of MoO3 nanoleaves towards triethylamine
Table 1. Comparison of triethylamine sensing performance among the gas sensors based on typical pure MOSs
| Material | Microstructure | Concentration / (mg·m-3) | T / ℃ | Ra/Rg | Limit of detection / (mg·m-3) | Ref. |
| SnO2 | Nanorods | 450 | 350 | 140 | 4.5 | [41] |
| V2O5 | Hollow spheres | 450 | 370 | 7.3 | 0.045 | [40] |
| α-Fe2O3 | Sea-urchin-like | 450 | 350 | > 19 | 81 | [42] |
| CuO | Microspheres | 450 | 230 | 102 | < 22.5 | [43] |
| TiO2 | Nanosheets | 450 | 350 | 2.55 | — | [44] |
| α-MoO3 | Nanoleaves | 450 | 300 | 903.8 | 4.5 | This work |
 下载: 导出CSV

 扫一扫看文章

扫一扫关注我们


 下载:
下载: