Scheme 1.
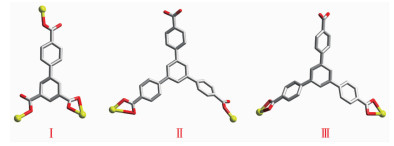
Coordination modes of BPT3- and HBTB2- in 1 and 2

Over the past years, the rational design and synthesis of functional metal-organic frameworks (MOFs) materials have caused remarkable attention due to their rich and varied structures as well as potential application, such as gas storage and separation, magnetism, heterogeneous catalysis, drug delivery and luminescence[1-8]. However, it still remains challenging by control-synthesizing and predicting structures of the functional MOFs because of many factors which can affect the structures and properties of MOFs. Among these factors, the selection of organic linkers is very crucial for formation of MOFs with definite framework structures and desired properties. Therefore, proper organic bridging linkers are significant in building the desired MOFs materials. As for as we know, biphenyl-3, 4′, 5-tricarboxylic acid (H3BPT) and 4, 4′, 4″-benzene-1, 3, 5-triyl-tribenzoic acid (H3BTB) (Scheme 1) are good bridging ligands because of their diversified coordination modes and rigid multicarboxylic groups[9-12].
In our previous studies, a rigid tridentate ligand 1, 3, 5-tris(1-imidazolyl)benzene (tib) as a N-donor ligand have been used in construction of MOFs, and the results showed that it can react with varied metal salts leading to the formation of MOFs with specific structures and interesting properties[13-15]. Thus, it is meaningful for using mixed N-donor ligand tib and multicarboxylic acids H3BPT/H3BTB to construct MOFs with novel structures and properties. In this work, two new metal-organic frameworks, [Cd3(tib)2(BPT)2(H2O)2]·DMA·6H2O (1) and [Zn2(tib)(HBTB)2(H2O)]·2H2O (2) (tib=1, 3, 5-tris(1-imidazolyl)benzene, H3BPT=biphenyl-3, 4′, 5-tricarboxylic acid, H3BTB=4, 4′, 4″-benzene-1, 3, 5-triyl-tribenzoic acid, DMA=N, N-dimethylacetamide), were synthesized and character-ized. Structural characterization reveals that complex 1 is a 4-nodal 3D framework with point symbol {83}4{85·12}{86}2, while 2 is a 2D network to be joined together by hydrogen bonds to generate a 3D supramolecular structure. Gas/vapor adsorption and luminescence behavior of the two complexes were studied. It is meaningful that 1 and 2 can selectively adsorb CO2 over N2, and MeOH over EtOH. Further-more, 1 can selectivity detect acetone through a fluorescence quenching mechanism in the organic solvents including MeOH, EtOH, 2-PA, CH3CN, DMF, DMA, THF, CHCl3, CH2Cl2 and acetone.
All commercially available chemicals and solvents are of reagent grade and were used as received without further purification. Ligand tib was prepared according to the procedures reported previously[16]. Elemental analyses for C, H and N were performed on a FLASH EA 1112 elemental analyzer. Thermogravi-metric analyses (TGA) were carried out on a Mettler-Toledo (TGA/DSC1) thermal analyzer under nitrogen with a heating rate of 10 ℃·min-1. FT-IR spectra were recorded in a range of 400~4 000 cm-1 on a BRUKER TENSOR 27 spectrophotometer using KBr pellets. Powder X-ray diffraction (PXRD) analyses were performed on a Bruker D8 Advance X-ray diffracto-meter with Cu Kα (λ=0.154 18 nm) radiation, in which the X-ray tube was operated at 40 kV and 40 mA, and the scanning angle range was between 5° and 50°. Sorption experiments were carried out on a Belsorp-max volumetric gas sorption instrument. The lumine-scence spectra were recorded on an Aminco Bowman Series 2 spectrofluorometer with a xenon arc lamp as the light source. The pass width of 10 nm was used in the measurements of emission and excitation spectra, and all the measurements were performed under the same experimental conditions.
A mixture of tib (13.8 mg, 0.05 mmol), H3BPT (14.3 mg, 0.05 mmol), and Cd(NO3)2·4H2O (30.0 mg, 0.1 mmol) in DMA/H2O (8 mL, 3:1, V/V) was placed in an 18 mL Teflon-lined stainless steel container and heated at 90 ℃ for 72 h. Thereafter, colorless block-shaped crystals of 1 were isolated in 80% yield (based on tib). Elemental analysis Calcd. for C64H63N13O21Cd3(%): C 45.55, H 3.76, N 10.79; Found(%): C 45.28, H 3.91, N 10.72. IR (KBr pellet, cm-1): 3 357 (m), 3 143 (m), 1 670 (m), 1 610 (m), 1 569 (s), 1 403 (s), 1 357 (m), 1 278 (m), 1 191 (m), 1 096 (m), 1 051 (m), 932 (m), 852 (m), 792 (s), 674 (m), 558 (m), 447 (m).
Complex 2 was synthesized by tib (13.8 mg, 0.05 mmol), H3BTB (22.0 mg, 0.05 mmol) and Zn(NO3)2·6H2O (30.0 mg, 0.1 mmol) in H2O (8 mL) in a 18 mL glass vial and heated at 160 ℃ for 72 h. After cooling to room temperature, colorless block crystals of 2 were obtained with a yield of 75% based on tib. Anal. Calcd. for C69H50N6O15Zn2(%): C 62.13, H 3.78, N 6.30; Found(%): C 62.07, H 3.85, N 6.25. IR (KBr pellet, cm-1): 3 449 (m), 1 689 (s), 1 662 (s), 1 620 (s), 1 511 (m), 1 401 (s), 1 240 (m), 1 177 (m), 1 075 (s), 1 015 (s), 946 (m), 854 (m), 774 (s), 683 (m), 646 (m), 482 (m).
Solvent-exchanged samples were prepared by immersing the as-synthesized samples 1 in THF for 3 days to remove the nonvolatile solvates, the solvent was decanted every 8 h, and fresh THF was added. The activated sample 1′ was obtained by heating the solvent-exchanged samples at 423 K under a dynamic high vacuum for 10 h. The activated samples 2′ was obtained by heating the sample 2 directly at 423 K under a dynamic high vacuum for 10 h.
Crystallographic data of 1 and 2 were collected on a Bruker Smart Apex Ⅱ CCD area-detector diffra-ctometer with graphite-monochromated Mo Kα radiation (λ=0.071 073 nm) using the ω-scan technique. The diffraction data were integrated using the SAINT program[17], which were also used for the intensity corrections for the Lorentz and polarization effects. Semi-empirical absorption correction was applied using the SADABS program[18]. Complex 1 was solved by direct methods using SHELXT-2014 and all the non-hydrogen atoms were refined anisotropically on F 2 by the full-matrix least-squares technique with the SHELXL-2018[19-20]. Complex 2 was solved by direct methods using SHELXT-2014 and all the non-hydrogen atoms were refined anisotropically on F 2 by the full-matrix least-squares technique with the SHELXL-2014[19]. All the hydrogen atoms, except for those of water molecules, were generated geometrically and refined isotropically using the riding model. The hydrogen atoms of the coordinated water molecules were found from the Fourier map directly, while those of free water molecules were not found. Because some free solvent molecules in 1 are highly disordered and impossible to refine using conventional discrete-atom models, the SQUEEZE subroutine of the PLATON software suite[21-22] was applied to remove the scattering from the highly disordered solvent molecules. The formula of 1 was calculated based on volume/count _electron analysis, thermogravimetric analysis (TGA) and elemental analysis. The reported refinements are of the guest-free structures obtained by the SQUEEZE routine, and the results are attached to the CIF file. The details of the crystal parameters, data collection, and refinements for the 1 and 2 are listed in Table 1. Selected bond lengths and angles are given in Table S1, and the hydrogen bond data for 2 are provided in Table S2.
 下载:
导出CSV
下载:
导出CSV
| Complex | 1 | 2 |
| Formula | C64H63N13O21Cd3 | C69H50N6O15Zn2 |
| Formula weight | 1 687.47 | 1 333.89 |
| T / K | 296(2) | 293(2) |
| Crystal system | Monoclinic | Triclinic |
| Space group | C2/c | P1 |
| a / nm | 2.470 8(6) | 1.093 6(5) |
| b / nm | 1.382 6(3) | 1.678 9(5) |
| c / nm | 2.443 7(5) | 1.946 5(5) |
| α / (°) | 115.401(5) | |
| β / (°) | 113.117(4) | 90.811(5) |
| γ / (°) | 103.052(5) | |
| V / nm3 | 7.678(3) | 3.119 8(19) |
| Z | 4 | 2 |
| Dc / (g·cm-3) | 1.460 | 1.420 |
| F(000) | 3 400 | 1 372 |
| θ for data collection / (°) | 1.724~27.367 | 1.361~24.998 |
| Reflection collected | 24 621 | 10 832 |
| Unique reflection | 8 603 | 8 061 |
| Goodness-of-fit on F2 | 1.011 | 0.902 |
| R1a [I>2σ(I)] | 0.046 0 | 0.053 5 |
| wR2b [I>2σ(I)] | 0.101 2 | 0.160 0 |
CCDC: 1996242, 1; 1845264, 2.
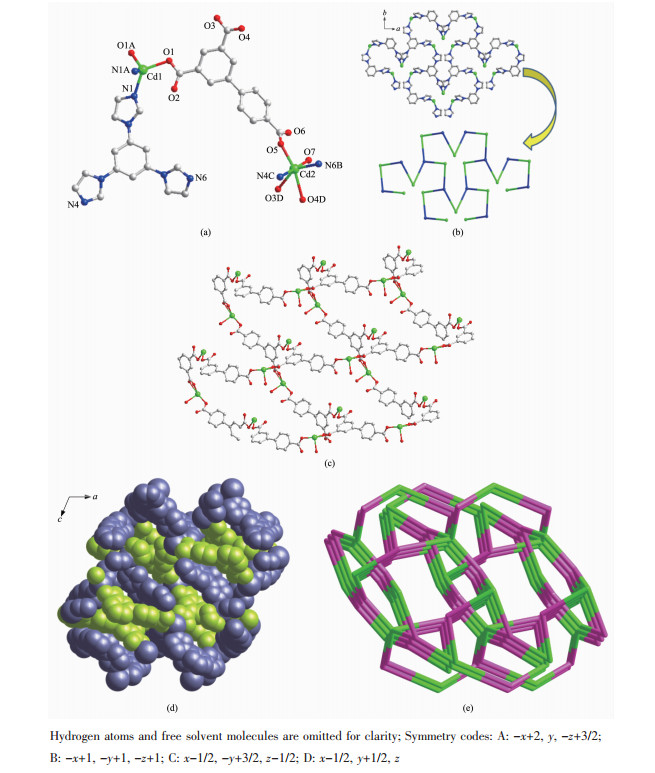
X-ray crystallographic analyses show that 1 crystallizes in the C2/c space group (Table 1). As shown in Fig. 1a, the asymmetric unit of 1 contains two crystallographically independent Cd(Ⅱ) cations, which have different coordination environments. The Cd1 is in a distorted tetrahedral coordination geometry with two N atoms (N1, N1A) from two different tib ligands and two carboxylate O atoms (O1, O1A) from two distinct BPT3- anions, while the Cd2 is six-coordinated with a distorted octahedral geometry by two imidazole N atoms (N6B, N4C) from two different tib ligands, three carboxylate O atoms (O3D, O4D, O5) from two different BPT3- anions, and one coordinated water molecule. The Cd-N and Cd-O bond lengths are found to be 0.227 7(3)~0.236 0(3) and 0.217 7(3)~0.248 0(3) nm, respectively (Table S1). Moreover, the coordination angles around Cd are in a range of 55.12(8)°~ 178.81(12)° (Table S1). In 1, each Cd(Ⅱ) ion connects two tib and every tib joins three Cd(Ⅱ) ions to form a 2D network (Fig. 1b). Meanwhile, each BPT3- ligand adopts the coordination mode (κ1)-(κ1)-(κ2)-μ3-BPT coordination mode (Scheme 1, mode Ⅰ) to connect three Cd(Ⅱ) cations and every Cd(Ⅱ) links two ligands to build a 2D Cd-BPT structure (Fig. 1c). The 2D Cd-tib and 2D Cd-BPT are interspersed with Cd ions as nodes to generate the final 3D structure (Fig. 1d). According to the simplification principle, Cd1, Cd2, tib, and BPT3- can be viewed as four-, four-, three-, and three-connectors, respectively. So, the resulting structure of 1 is a (3, 3, 4, 4)-connected 4-nodal 3D framework with a {83}4{85·12}{86}2 topology (Fig. 1e)[23]. Additionally, the solvent-accessible volume of 1 is 2.025 4 nm3 per 7.338 4 nm3 unit cell volume (27.6% of the total crystal volume)[24].
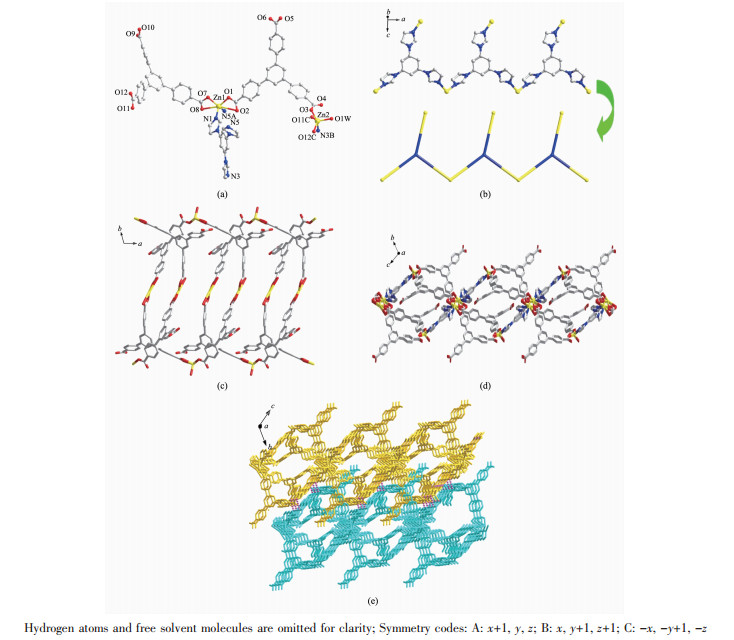
When the H3BPT was replaced by H3BTB, complex 2 was isolated. As illustrated in Fig. 2a, the asymmetric unit of 2 contains two crystallographically independent Zn ions. Zn1 is six-coordinated with distorted octahedral geometry by two imidazole N atoms (N1, N5A) from two different tib and four carboxylate O ones (O1, O2, O7, O8) from two distinct HBTB2-, with Zn1-N bond distance from 0.201 9(3) to 0.202 3(4) nm and the Zn1-O one from 0.196 2(3) to 0.198 2(3) nm. Furthermore, the coordination angles around Zn1 are in the scope of 97.54(13)°~121.79(15)° (Table S1). While Zn2 is five-coordinated by one imidazole N atom (N3B) from tib ligand, three carboxylate O atoms (O3, O11C, O12C) from different HBTB2- and one terminal water molecule (O1W). The bond lengths and coordination angles around Zn2 are in normal range (Table S1). In 2, each Zn1 ions joins two tib molecules and each tib ligand connects two Zn1 ions to construct a 1D chain (Fig. 2b). Meanwhile, partly deprotonated HBTB2- ligand adopts (κ1)-(κ2)-μ2-HBTB or (κ2)-(κ2)-μ2-HBTB coordination mode (Scheme 1, mode Ⅱ and Ⅲ) to connect two Zn(Ⅱ) ions to form a 1D chain structure (Fig. 2c). The combination of 1D Zn-tib chain and 1D Zn-HBTB chain generate a final 2D network structure of 2 (Fig. 2d). Eventually, hydrogen bonding C(10)-H(10A)…O1W and C(3)- H(3)…O11 (Table S2) bridge the layers to form a 3D supramolecular structure of 2 (Fig. 2e).
The purity for the bulky samples of synthesized 1 and 2 were confirmed by PXRD tests and the results are provided in Fig.S1. Each PXRD pattern of the as-prepared sample was well consistent with the simulated one, confirming the phase purity of the products.
Thermogravimetric analysis (TGA) was carried out in evaluating the thermal stability of the frameworks and the TGA curves of 1 and 2 are shown in Fig.S2. Complex 1 showed a weight loss of 13.2% between 30 and 245 ℃ corresponding to the removal of free and coordinated H2O molecules as well as free DMA molecules (Calcd. 13.4%). Further weight loss was observed at about 350 ℃, implying collapse of the framework of complex 1 (Fig.S2a). TGA curve of 2 gave weight loss of 4.4% from 30 to 185 ℃, originating from the loss of two free and one coordinated H2O molecules (Calcd. 4.0 %), and the framework is stable up to about 395 ℃ (Fig.S2b).
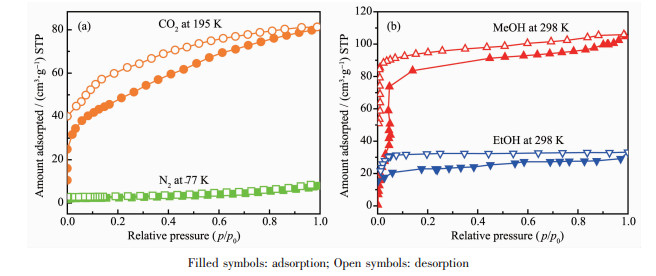
The porosity and high stability of the frameworks prompted us to examine their gas/vapor sorption behavior. The sorption performances of the activated samples 1′ and 2′ for N2 at 77 K, CO2 at 195 K, MeOH and EtOH at 298 K are discussed here.
From the Fig. 3a, we can see the adsorption isotherm of N2 at 77 K for 1′, which suggests only surface adsorption[25]. However, as shown in Fig. 3a and 3b, the adsorption capacities of CO2, MeOH, and EtOH on 1′ are considerable. The CO2 adsorption capacity of 1′ at 195 K and 100 kPa was 81.12 cm3·g-1, corresponding to about 5.8 CO2 molecules per formula unit, while the uptake amount of CH3OH and CH3CH2OH at 298 K and 100 kPa was 105.81 cm3·g-1 (151.04 mg·g-1) and 33.32 cm3·g-1 (68.54 mg·g-1), corresponding to 7.6 MeOH molecules and 2.4 EtOH molecules per formula unit, respectively. The observed hysteretic adsorption and incomplete desorption behavior suggest strong interactions between adsorbed CO2 and the framework[26-29]. Considering all of the above analysis results, it can be seen that complex 1 can selectively adsorb CO2 and MeOH molecules.
It is noteworthy that almost no adsorption of N2 at 77 K and EtOH at 298 K was found for 2′ (Fig. 4a and 4b). The final value of CO2 adsorption at 195 K and 100 kPa was 32.14 cm3·g-1 corresponding to about 1.9 CO2 molecules per formula unit for 2′. As for MeOH adsorption of 2′ at 298 K (Fig. 4b), the final value of 47.3 cm3·g-1 (71.8 mg·g-1) at 100 kPa corresponds to 2.8 MeOH molecules per formula unit for 2′. The hysteresis and incomplete desorption suggest the strong interactions between the adsorbate and adsorbent, which include the hydrogen bond interactions between the guest molecules and framework, as well as the guest molecules and the guest molecules.

MOFs constructed from d10-metal ions and π-conjugated skeleton ligands are usually considered to be potential luminescent materials[30-34]. Accordingly, the luminescence properties of tib, H3BPT ligands and 1 were studied in the solid state at room temperature. It was found that 1 displayed apparent fluorescence enhancement and the intense emission bands were observed at λem=398 nm (λex=335 nm) as exhibited in Fig. 5, which may be attributed to the tib and H3BPT ligands emission since the free tib and H3BPT ligands exhibited emission at 402 and 408 nm (λex=295 nm), respectively[35-36].
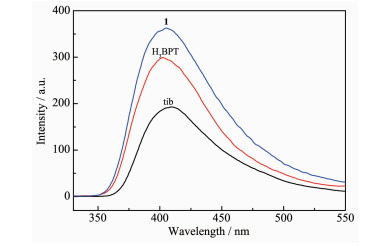
It has been reported that the construction of architectures can enhance the rigidity of the aromatic backbone of the ligands and strengthen the intramolecular/intermolecular intera-ctions among the organic ligands, which are beneficial to energy transfer[37]. Compared with the free tib and H3BPT ligands, the observed much stronger emission intensity of 1 implies that the formation of MOFs enhances the fluorescence of the ligand.
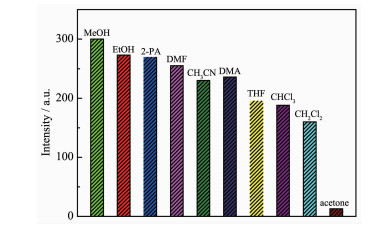
To examine the potential sensing properties for small organic solvent molecules, the fluorescence experiments of 1 were carried out by dispersing 5 mg well-ground crystalline powder samples in 3 mL different organic solvents including MeOH, EtOH, 2-propanol (2-PA), CH3CN, DMF, DMA, THF, CHCl3, CH2Cl2 and acetone. As illustrated in Fig. 6, the intensity of the photoluminescent (PL) of 1 distinctly depended on the identity of the solvent molecule and the emission intensity of 1 in MeOH dispersion was stronger than those in other solvent dispersions under the same concentration. Therefore, MeOH was chose as dispersion solvent in the sensing studies. Furthermore, only addition of acetone can quench the fluorescence emissions of 1 efficiently. These experimental phenomena can be mainly attributed to dierent interactions between the framework architecture and distinct organics[38].
To examine the sensing sensitivity of 1 toward acetone in detail, a batch of suspensions of 1 were dispersed in MeOH solution, respectively, with gradually increasing acetone concentration. As exhibited in Fig. 7, with the addition of acetone into the suspensions of 1, a gradual decrease of the fluorescence intensity was observed. The results of fluorescence titration of 1 show that about 50% decrease of the luminescence intensity was reached with the addition of 5 μL acetone, and the luminescence was almost completely quenched with the addition of 50 μL acetone. Therefore the tib-composed complex 1 may be served as a potential fluorescent sensing material.

In summary, two new Cd(Ⅱ) and Zn(Ⅱ)-based MOFs with mixed tib and tricarboxylate ligands have been synthesized. Gas/vapor adsorption and lumine-scence behavior of the complexes were investigated and the results indicate that complexes 1 and 2 both show the ability to selectively adsorb CO2 over N2, MeOH over EtOH, suggesting a possible application in selective gas/vapor adsorption and separation. More importantly, complex 1 shows unique selectivity for detection of acetone through luminescence quenching mechanism. It can be seen that the mixed ligand is an effective strategy for assembling MOF-based functional material.
Acknowledgements: We gratefully acknowledge the Key Projects of Henan Provincial High School (Grant No.18A150042) for financial support of this work. This work was also financially supported by the National Research Project Incubation Fund of Zhengzhou University of Technology (Grant No.GJJKTPY2018K1).
Supporting information is available at http://www.wjhxxb.cn
Cui X L, Chen K J, Xing H B, et al. Science, 2016, 353:141-144 doi: 10.1126/science.aaf2458
Karim A, Youssef B, Mohamed E. Chem. Soc. Rev., 2017, 46:3402-3430 doi: 10.1039/C7CS00153C
Chen S S, Chen M S, Takamizawa S, et al. Chem. Commun., 2011, 47:752-754 doi: 10.1039/C0CC04085A
Li B Y, Dong X L, Wang H, et al. Nat. Commun., 2017, 8:485-493 doi: 10.1038/s41467-017-00526-3
Banerjee D, Simonet C M, Thallapally P K, et al. Nat. Commun., 2016, 7:11831-11837 doi: 10.1038/ncomms11831
Yin Z, Wan S, Yang J, et al. Coord. Chem. Rev., 2019, 378:500-512 doi: 10.1016/j.ccr.2017.11.015
Hughes J T, Sava D F, Nenoff T M, et al. J. Am. Chem. Soc., 2013, 135:16256-16259 doi: 10.1021/ja406081r
Hou C, Liu Q, Fan J, et al. Inorg. Chem., 2012, 51:8402-8408 doi: 10.1021/ic300950h
Li Y L, Zhao Y, Wang P, et al. Inorg. Chem., 2016, 55:11821-11830 doi: 10.1021/acs.inorgchem.6b01869
Li Y L, Zhao Y, Kang Y S, et al. Cryst. Growth Des., 2016, 16:7112-7123 doi: 10.1021/acs.cgd.6b01352
Zhang, Z X, Ding N N, Zhang W H, et al. Angew. Chem. Int. Ed., 2014, 53:4628-4632 doi: 10.1002/anie.201311131
Ko N, Noh K, Sung S H, et al. Chem. Commun., 2014, 50:6785-6788 doi: 10.1039/C4CC01501K
Su Z, Fan J, Chen M, et al. Cryst. Growth Des., 2011, 11:1159-1169 doi: 10.1021/cg101365v
Su Z, Fan J, Chen M, et al. Cryst. Growth Des., 2010, 10:3515-3521 doi: 10.1021/cg100418a
Hua J A, Zhao Y, Kang Y S, et al. Dalton Trans., 2015, 44:11524-11532 doi: 10.1039/C5DT01386K
Fan J, Gan L, Kawaguchi H, et al. Chem. Eur. J., 2003, 9:3965-3973 doi: 10.1002/chem.200204298
SAINT, Program for Data Extraction and Reduction, Bruker AXS, Inc., Madison, WI, 2001.
Sheldrick G M. SADABS, University of Göttingen, Germany, 1996.
(a) Sheldrick G M. SHELXT-2014, Program for the Crystal Structure Solution, University of Göttingen, Germany, 2014.
(b)Sheldrick G M. SHELXL-2014, Program for the Crystal Structure Solution, University of Göttingen, Germany, 2014.
Sheldrick G M. SHELXL-2018, Program for the Crystal Structure Solution, University of Göttingen, Germany, 2018.
Spek A L. Acta Crystallogr. Sect. A, 1990, A46:194-196
Spek A L. PLATON, A Multipurpose Crystallographic Tool, Utrecht University, The Netherlands, 2005.
Blatov V A. TOPOS, A Multipurpose Crystallochemical Analysis with the Program Package, Samara State University, Russia, 2009.
Blatov V A. IUCr Comp. Comm. Newslett., 2006, 7:4-38
Choi H S, Suh M P. Angew. Chem. Int. Ed., 2009, 48:6865-6869 doi: 10.1002/anie.200902836
Hou C, Liu Q, Lu Y, et al. Microporous Mesoporous Mater., 2012, 152:96-103 doi: 10.1016/j.micromeso.2011.11.058
Chen M S, Chen S S, Takamizawa, et al. Chem. Commun., 2011, 47:3787-3789 doi: 10.1039/c0cc04689b
Zhong D C, Zhang W X, Cao F L, et al. Chem. Commun., 2011, 47:1204-1206 doi: 10.1039/C0CC03506H
Higuchi M, Tanaka D, Horike S, et al. J. Am. Chem. Soc., 2009, 131:10336-10337 doi: 10.1021/ja900373v
He K H, Song W C, Li Y W, et al. Cryst. Growth Des., 2012, 12:1064-1068 doi: 10.1021/cg2014495
Zeng M H, Yin Z, Liu Z H, et al. Angew. Chem. Int. Ed., 2016, 55:11407-11411 doi: 10.1002/anie.201604813
Yin Z, Zhou Y L, Zeng M H, et al. Dalton Trans., 2015, 44:5258-5275 doi: 10.1039/C4DT04030A
Barsukova M, Goncharova T, Samsonenko D, et al. Crystals, 2016, 6:132-147 doi: 10.3390/cryst6100132
Barsukova M O, Sapchenko S A, Kovalenko K A, et al. New J. Chem., 2018, 42:6408-6415 doi: 10.1039/C8NJ00494C
Wang X L, Bi Y F, Liu G C, et al. CrystEngComm, 2008, 10:349-356 doi: 10.1039/B706071H
Zhang L, Li Z J, Lin Q P, et al. Inorg. Chem., 2009, 48:6517-6525 doi: 10.1021/ic900425r
Zheng X F, Zhou L, Huang Y M, et al. J. Mater. Chem. A, 2014, 2:12413-12422 doi: 10.1039/C4TA01900H
Bauer C A, Timofeeva T V, Settersten T B, et al. J. Am. Chem. Soc., 2007, 129:7136-7144 doi: 10.1021/ja0700395

Figure 1 (a) Coordination environment around Cd (Ⅱ) in 1; (b) 2D Cd-tib network in 1; (c) 2D Cd-BPT network structure in 1; (d) 3D packing structure of 1 (Grey color: 2D Cd-tib network, Green color: 1D Cd-BPT chain structure); (e) Topological presentation of 1

Figure 2 (a) Coordination environment of Zn(Ⅱ) in 2; (b) 1D chain structure of Zn-tib in 2 along b axis; (c) 1D chain structure of Zn-HBTB in 2 along c axis; (d) 2D layer structure of 2; (e) 3D supramolecular structure of 2 with hydrogen bonds indicated by dashed lines

Figure 3 (a) Sorption isotherms of N2 at 77 K and CO2 at 195 K for 1′; (b) Sorption isotherms of MeOH and EtOH at 298 K for 1′

Figure 4 (a) N2 at 77 K and CO2 at 195 K sorption isotherms for 2′; (b) MeOH and EtOH at 298 K sorption isotherms for 2′

Figure 5 Solid-state photoluminescence spectra of the free tib and H3BPT ligands (λex=295 nm) and 1 (λex= 335 nm) at room temperature

Figure 6 Photoluminescence intensities of 1 introduced into different pure organic solvents when excited at 335 nm

Figure 7 Fluorescence titrations of compound 1 dispersed in 1 mg·mL-1 MeOH with gradual addition of acetone
Table 1. Crystal data and structure refinements for 1 and 2
| Complex | 1 | 2 |
| Formula | C64H63N13O21Cd3 | C69H50N6O15Zn2 |
| Formula weight | 1 687.47 | 1 333.89 |
| T / K | 296(2) | 293(2) |
| Crystal system | Monoclinic | Triclinic |
| Space group | C2/c | P1 |
| a / nm | 2.470 8(6) | 1.093 6(5) |
| b / nm | 1.382 6(3) | 1.678 9(5) |
| c / nm | 2.443 7(5) | 1.946 5(5) |
| α / (°) | 115.401(5) | |
| β / (°) | 113.117(4) | 90.811(5) |
| γ / (°) | 103.052(5) | |
| V / nm3 | 7.678(3) | 3.119 8(19) |
| Z | 4 | 2 |
| Dc / (g·cm-3) | 1.460 | 1.420 |
| F(000) | 3 400 | 1 372 |
| θ for data collection / (°) | 1.724~27.367 | 1.361~24.998 |
| Reflection collected | 24 621 | 10 832 |
| Unique reflection | 8 603 | 8 061 |
| Goodness-of-fit on F2 | 1.011 | 0.902 |
| R1a [I>2σ(I)] | 0.046 0 | 0.053 5 |
| wR2b [I>2σ(I)] | 0.101 2 | 0.160 0 |
 下载: 导出CSV

 扫一扫看文章

扫一扫关注我们

 下载:
下载: