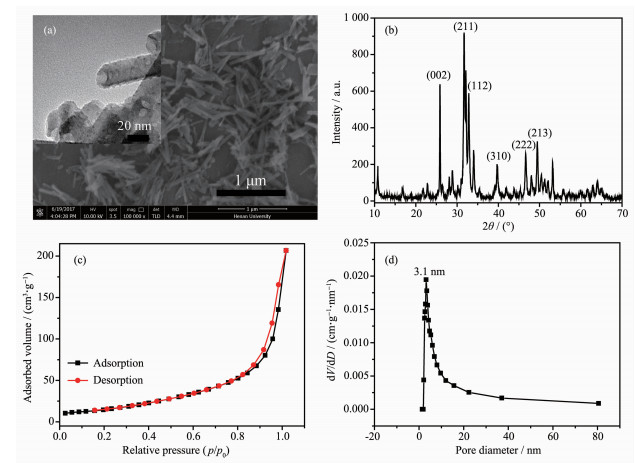
图 1.
SEM image (a), XRD pattern (b), N2 adsorption-desorption isotherm (c) and pore diameter distribution (d) of the prepared HAP samples
Inset in Fig. 1a showed the TEM image

With the rapid development of industries, the discharge of waste water containing heavy metals was increasing significantly. As it was well-known to all that the ingestion of heavy metals like Cd, Pb, Hg and so on could link to cancer, DNA damage or blocking of protein[1-5]. Therefore, the remediation of heavy metals has become a hot topic. Today, many methods have been employed to remove heavy metal ions, such as chemical precipitation, adsorption, solvent extraction and coagulation[6-11]. Among them, the chemical immo-bilization method was considered to be applicable to fast and large area remediation. As reported by Mirbagheri and his co-workers, Ca(OH)2 and NaOH were used to remove Cu(Ⅱ) and Cr(Ⅳ) ions[12]. The maximum precipitation occurred at pH=8.7 with the addition of Ca(OH)2 and the concentration of Cr(Ⅳ) was reduced from 30 to 0.01 mg·L-1. Özverdi et al.[13] employed pyrite and synthetic iron sulphide to remove Cu2+, Cd2+ and Pb2+ from aqueous solutions. And the adsorption of metal ions onto both adsorbents was pH-dependent and the adsorption capacities increased with the increasing temperature. With the advancement of nanotechnology, many nanomaterials were used for removing the heavy metals ions in solution. For example, ferriferrous oxide/L-cysteine magnetic nanospheres could adsorb Pb2+ in aqueous solution and the maximum adsorption capacity reached to 459.33 mg·g-1, which fitted with a Langmuir model[14].
Nevertheless, common adsorbents generally only acted on one or several heavy metal ions at the same time[15-17]. In fact, water pollution was often caused by the coexistence of multiple heavy metal ions. Considering the problem mentioned in the removal of many kinds of heavy metal ions, nano-hydroxyapatite was one of the most important materials in immobilizing metal ions in solution. We knew that HAP nanomaterials had a large specific surface area, which can immobilize the heavy metal ions in a high capacity through phosphate precipitation, ions exchange, surface adsorption or other mechanisms. Gámez del Río et al.[18] employed calcite (CA) and hydroxyapatite (HAP) from minerals to study the interaction between Cd, Zn, and Co with CA and HAP. It could be seen that the affinities followed the sequence: Cd > Zn > Co (CA) and Cd > Zn≈Co (HAP). Then synthetic HAP was an efficient adsorbent that has been extensively investigated for the removal of heavy metal[19-21]. In Brasil some HAP powder samples with different crystallinity, stoichiometry, and specific surface area were prepared, which were evaluated the uptake of Cd2+ ions from aqueous solution. It indicated that Cd2+ ions sorption depended on the HAP crystallite dimensions and the major part of Cd2+ ions could be immobilized by the pores of HAP samples. And the influence of sample thermal treatment on Cd2+ ions were studied and the maximum sorption capacity decreased from 0.631 to 0.150 mmol·g-1 at 900℃[22]. Fuller et al gave the mechanism of U(Ⅳ) adsorbed by HAP, suggesting that U(Ⅳ) adsorbed to the HAP surfaces as an inner-sphere complex[23]. However, HAP nanotubes (HAP NTs) has not been investigated for the removal of multi-metal (Pb2+, Cd2+, Cu2+, Co2+, Ni2+, Zn2+, and Hg2+) from aqueous solution. And the mechanism to describe the uptake of heavy metal from aqueous solution by HAP NTs has not been extensively evaluated. In this paper, HAP NTs were synthesized by a facile method, which had a perfect morphology in shape and a large surface area. Then the prepared HAP NTs can be used to remove seven heavy metal ions (Pb2+, Cd2+, Cu2+, Co2+, Ni2+, Zn2+ and Hg2+) in the multi-metal system. Meanwhile, the mechanism of HAP NTs on heavy metal ions was further studied.
P2O5 (AR, 98.0%) and Ca(NO3)2·4H2O (AR, 99.0%) were bought from Tianjin Kermel Chemical Reagent Company Ltd. Diethylenetriamine pentaacetic acid (DTPA, AR, 99.7%) and triethanolamine (TEA, AR, 98.0%) was purchased from Sinopharm Group Phar-maceutical Company Ltd. CaCl2 (AR, 99.0%) was acquired from Tianjin Guangfu Fine Chemical Research Institute.
In a typical synthesis, 0.20 g of P2O5 was added into 15 mL of absolute ethanol, followed by the addition of the mixed solution (1.20 g of Ca(NO3)2·4H2O and 15 mL of H2O) under stirring. Then the pH value was adjusted to 8.80 by ammonia spirit (25%~28%(w/w)) and was kept at 17℃ under stirring for 30 min. Subsequently, the solution was transferred into a Teflon-lined stainless-steel autoclave, sealed and heated at 165℃ for 12 h. Finally, the solution was cooled, centrifuged and washed with ethanol and water for several times to obtain the HAP NTs.
Briefly, 0.10 or 0.50 g of HAP NTs were dispersed in 30.00 mL of Pb2+, Cd2+, Cu2+, Co2+, Ni2+, Zn2+ and Hg2+ single/mixed solution (20 mg·L-1 for each ion) by stirring at 180 r·min-1 at room temperature for 20 min. In order to search the effect of adsorption time, 0.10 g of HAP NTs were dispersed in 30.00 mL of Pb2+, Cd2+, Cu2+, Co2+, Ni2+, Zn2+ and Hg2+ mixed solution (20 mg·L-1 for each ion) by stirring at room temperature for a predetermined time interval (20, 40, 60, 80, 100, 120 min). Then all the precipitate were collected and washed with 10 mL water to remove M2+ ions physically adsorbed. Meanwhile, another 10 mL water was added. After 1 h, the supernatant was collected and the above operation was repeated 12 times. Different amount of HAP NTs (0.02, 0.04, 0.06, 0.08 g) was dispersed in 30 mL of Pb2+ solution (1 000 mg·L-1) under stirring at room temperature for 2 h. The concentrations of heavy metal ions in the supernatant was analyzed by inductively coupled plasma (ICP).
In a typical method, 0.1 g of HAP NTs were dispersed into different volumes (10, 20, 30, 40, 50, 60 mL) of Pb2+, Cd2+, Cu2+, Co2+, Ni2+, Zn2+ and Hg2+ mixed solution (1 000 mg·L-1 for each ion). Then these solutions were shaken for 24 h at room temperature (180 r·min-1). After adsorption, these HAP/M precipitate (M=Pb, Cd, Cu, Co, Ni, Zn, Hg) were collected and dried at 60 ℃ for 24 h.
X-ray diffraction (XRD) measurements were carried out on an D8-ADVANCE X-ray diffraction spectrometer (XRD, Bruker, Germany) with a Cu Kα, λ=0.154 18 nm radiation (U=60 kV, I=60 mA) at scan rate of 0.04°·s-1 in a region of 2θ from 10° to 70°. The morphology of HAP NTs was analyzed by transmission electron microscopy (TEM, JEM-2010, Japan, working at 200 kV) and scanning electron microscopy (SEM, JSM5600LV, Japan, 5 kV, 10 mA). To explore the surface area, cumulative pore volume and pore size distribution of HAP NTs, the Brunauer-Emmett-Teller method (BET, QUADRASORB, USA) were employed and determined at 77 K. The concentration of heavy metal ions were measured by ICP (Optima 2100DV, USA).
Fig. 1a was the TEM and SEM images of the HAP NTs. It was seen that the synthesized HAP sample was tube-like shape, 20~40 nm in diameter and 145~750 nm length with aspect ratio ranging from 5 to 13. We observed the detailed morphology of the nanotubes in Fig. 1a (insert), which had a porous surface texture. And we can see that the inner diameter of the prepared HAP nanotubes was about 7.6 nm. The presence of numerous individual small white dots obviously suggested the existence of mesopores (4~5.5 nm), spreading around the surfaces of HAP NTs, which was in agreement with the literature[24]. Fig. 1b showed the XRD pattern of the HAP NTs. The XRD patterns showed a strong peak at around 31.7° corresponding to (211) the planes of HAP crystalline structure and the other characteristic peaks were from (002), (112), (310), (222) and (213) planes, respe-ctively. These characteristic peaks in the pattern of the prepared HAP NTs agreed well with the standard pattern (PDF No.09-0432). The N2 adsorption and desorption isotherm of prepared HAP were shown in Fig. 1c. It was seen that the isotherm of the sample showed the typical Ⅳ adsorption isotherm with a distinct hysteresis loop. The BET surface area of the sample was 56 m2·g-1, which had a larger surface area[15, 25-26]. It was clear that the HAP NTs presented narrow pore diameter distribution, and the pore diameter was mainly focused on 3 nm.
Inset in Fig. 1a showed the TEM image
Fig. 2a was the immobilization rate of HAP NTs on Pb2+, Cd2+, Cu2+, Co2+, Ni2+, Zn2+and Hg2+ in single ion solution (20 mg·L-1 for each ion). We observed that the immobilization rate was nearly 100%, which showed that HAP NTs had a strong adsorption property. In order to verify the effect of multiple ions, we simultaneously adsorbed seven mixed ions of the same concentration. It can be seen in Fig. 2b that the immobilization rate was 100% (Pb2+), 100% (Cd2+), 100% (Cu2+), 99.92% (Zn2+), 99.85% (Co2+), 99.32% (Hg2+) and 98.78% (Ni2+), respectively, which also showed a perfect immobilizing property to seven mixed ions. Fig. 2c was the relationship between the immobilization rate and immobilization time of the HAP NTs. From the Fig. 2c we noticed that the immobilization rate for each heavy ion reached 100% in 20 min, which indicated that HAP NTs had a rapid adsorption reaction with heavy metal ions. In order to verify the stability of HAP NTs adsorbed the target heavy metal ions, we conducted a continuous 12 h desorption experiment. It was seen that the desorption rate of seven metal ions was less than 1%, which showed a strong stability (Fig. 2d).
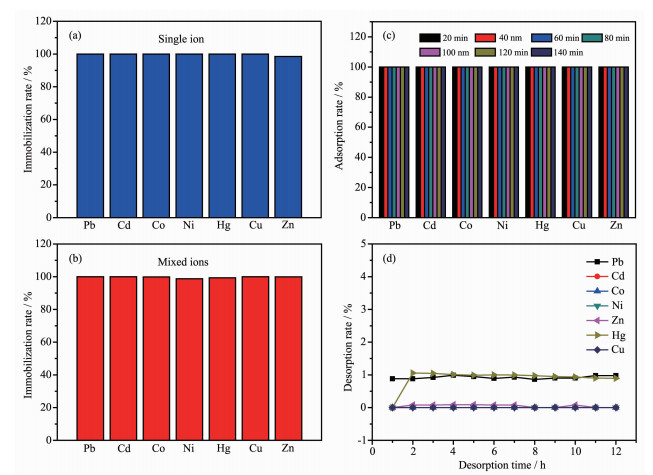
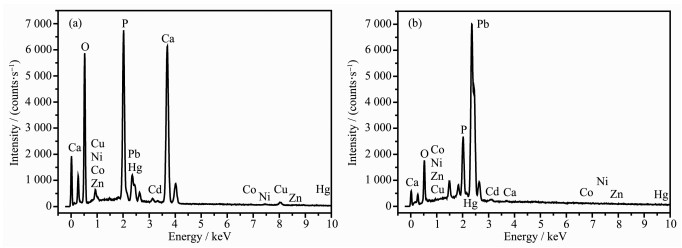
Fig. 3a and 3b were the EDS pattern of HAP/M obtained in 10 and 60 mL mixed ions solution. Table 1 was the atom percent from EDS of HAP/M obtained in different amounts of mixed ions solution. It could be seen from EDS pattern that there were Pb, Cd, Cu, Co, Ni, Zn and Hg elements in HAP/M, indicating that seven heavy metal ions had been immobilized by the prepared HAP NTs. Nevertheless, there were obvious differences between Fig. 3a and 3b. When the amount of seven metal ions was less than 30 mL, the peak of Ca element was stronger than that of Pb element. However, when the amount of seven metal ions was more than 30 mL, it can be seen that the peak of Pb element in Fig. 3d became stronger. This could be happened as the immobilization occurred via the surface complexation immobilized a little amount of metal ions, whereas immobilization through ion exchange with Ca2+ ions in the lattice and heavy metals ions could immobilize a sufficient amount of heavy metal ions[19].
 下载:
导出CSV
下载:
导出CSV
| Volume / mL | Atomic fraction / % | |||
| Ca | P | O | Pb | |
| 10 | 12.75 | 8.99 | 74.71 | 0.8 |
| 20 | 15.08 | 11.29 | 67.32 | 4.01 |
| 30 | 11.80 | 9.46 | 73.67 | 4.52 |
| 40 | 13.65 | 10.58 | 69.79 | 4.24 |
| 50 | 8.35 | 6.93 | 75.45 | 4.49 |
| 60 | 9.03 | 7.66 | 75.34 | 5.21 |
In order to verify the component of HAP/M, the relationship between the molar ratio of M to P of HAP/M and different amount of mixed ions solution were given in Fig. 4. It was seen that the molar ratio of Ca to P of HAP/M went down from 1.42:1 to 1.18:1 with the increase of the adding volume of mixed ions solution, less than that of HAP (1.67:1). It was indicated that there was an ion exchange reaction between Ca2+ ions in HAP and heavy metal ions. Meanwhile, we also observed that among the seven heavy metal elements, the content of Pb element was the highest and the atomic percentage of Pb in HAP/M reached by 5.21% (Table 1). As was well-known, the solubility product constant (Ksp) was the equilibrium constant for a chemical reaction in which a solid ionic compound dissolved to yield its ions in solution. It may be because the Ksp of Pb3(PO4)2 was 8.0×10-43, which was far less than that of Ca3(PO4)2 (2.07×10⁻³³). When the concentration of Pb2+ ions in mixed solution was sufficient enough, Pb2+ can exchanged with Ca2+ to form Pb5(PO4)3(OH). Meanwhile, we all knew that Pb5(PO4)3(OH) was extremely stable and insoluble, which showed consistency with the results of desorption experiment in Fig. 2d.

In order to verify the component of the obtained HAP/M, XRD analysis was employed. Fig. 5 was the XRD patterns of the HAP/M obtained in different amounts (10~60 mL) of mixed ions solution. From Fig. 5, curve 1~3, it was seen that the HAP/M presented characteristic peaks at 25.88° (002), 31.77° (211), 32.20° (112), 39.82° (310) and 46.71° (222), consistent with the standard card of HAP (PDF No.09-0432). At the same time, five intent peaks at 2θ of 21.60°, 26.11°, 30.02°, 31.90° and 44.01° were indexed to scattering from the (111), (102), (112), (202) and (222) crystal planes of the Pb5(PO4)3(OH) (PDF No.24-0586), respectively. It was indicated that the component of HAP/M was the mixture of HAP and Pb5(PO4)3(OH) when the amount of M2+ solution was less than 30 mL. At this point, the immobilization mechanism between HAP NTs and heavy metal ions was mainly rapid surface complexation and there was a little ion exchange resulting in partial dissolution of HAP[19]. When the adding volume of mixed ions solution was more than 40 mL, we can see that the component of HAP/M was changed into Pb5(PO4)3(OH) (PDF No.24-0586), seen in Fig. 5, curve 4~6. This indicated that when Pb2+ ions in the solution reached a certain amount, Pb2+ ions in the solution could exchange with Ca2+ ions in HAP NTs, thus forming a more stable Pb5(PO4)3(OH)[27], which showed consistency with the results of EDS analysis in Fig. 3. At this time, the ion exchange reaction was the main mechanism between HAP NTs and heavy metal ions. This was because that Ca2+ in the HAP NTs sample can easily be exchanged for Pb2+ and the HAP can be converted into stable Pb5(PO4)3 (OH), which was consistent with the result of the literature[28-29].
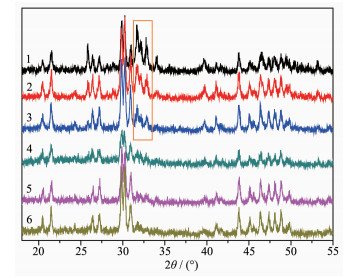
1: 10 mL; 2: 20 mL; 3: 30 mL; 4: 40 mL; 5: 50 mL; 6: 60 mL
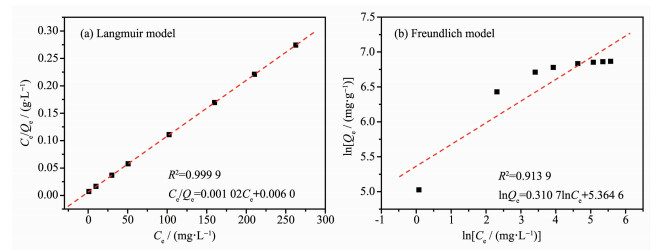
Heavy metal immobilization by HAP NTs was analyzed using the Langmuir model and Freundlich model, which were popular isotherm models due to their simplicity. The Langmuir model was based on the assumption that the maximum adsorption occurred when a saturated monolayer of solute molecules was presented on the adsorbent surface, the energy of adsorption was constant, and there was no migration of adsorbed molecules in the plane of the surface[30]. Freundlich model was applied to describe a hetero-geneous system characterized by a heterogeneity factor of 1/n[31]. This model described reversible adsorption and was not restricted to the formation of the monolayer. The Langmuir (1) and Freundlich (2) equilibrium equation were:
|
$ \frac{{{C_{\rm{e}}}}}{{{Q_{\rm{e}}}}} = \frac{1}{{{Q_{\rm{m}}}}}{C_{\rm{e}}} + \frac{1}{{b{Q_{\rm{m}}}}} $ |
(1) |
|
$ \ln {Q_{\rm{e}}} = \frac{1}{n}\ln {C_{\rm{e}}} + \ln k $ |
(2) |
Where Ce was the equilibrium concentration of aqueous Pb2+ ions (mg·L-1); Qe was the amount of Pb2+ sorbed per gram of HAP NTs (mg·g-1); Qm related to the maximum sorption capacity (mg·g-1); b was the Langmuir constant (L·mg-1); 1/n was the the degree of non linearity between solution concentration and adsorption; k was the Freundlich isotherm constant (
Fig. 6 showed typical sorption isotherms for Pb-adsorbent systems, which listed the isotherm fitted equation and correlation coefficients calculated based on Langmuir and Freundlich models. It could be seen that the fitting equilibrium adsorption data of Pb2+ with the Langmuir isotherm model provided an extremely high correlation coefficient of R2=0.999 9, higher than 0.913 9 derived from the Freundlich model. This suggested that adsorption of Pb2+ by HAP NTs was monolayer-type, which was in accordance with the general observation that adsorption from an a aqueous solution usually formed a layer on the sorbed surface. Besides, the Qm value of the HAP NTs adsorbent, calculated from the Langmuir isotherm model, was as much as 980.39 mg·g-1, which was consistent with the experimental data (958.28 mg·g-1) and showed a perfect immobilization property. It showed that the Qm value of the HAP NTs adsorbent in this study were significantly higher than the reported adsorbents[21, 32-33]. The Langmuir parameters indicated that the HAP NTs were a suitable adsorbent for the adsorption of heavy metal ions from aqueous solution.
Hydroxyapatite nanotubes with controllable morphology were synthesized by a facile method. The prepared HAP nanotubes could rapidly and effectively immobilize seven heavy metal ions (Pb2+, Cd2+, Cu2+, Co2+, Ni2+, Zn2+ and Hg2+) at the same time. Meanwhile, the as-prepared HAP NTs showed a fast adsorption rate, a high immobilization capacity and a strong stability, which had potential application prospects in mitigating water/soil pollution.
The authors acknowledge the financial support provided by the National Natural Science Foundation of China (Grant No.21571051), the Major Science and Technology Project of Henan Province (Grant No.181100310600), the Interdisciplinary Research for First-class Discipline Construction Project of Henan University (Grant No.2019YLXKJC04), the Scientific Research Fund Project of Henan University (Grant No.2015YBZR032), and National Key Research and Development Program of China (Grant No.2019YFC1803600).
Bastaa N T, McGowen S L. Environ. Pollut., 2004, 127(1):73-82 https://www.sciencedirect.com/science/article/pii/S0269749103002501
Zhang X L, Zhao X L, Li B Z, et al. Chinese Sci. Bull., 2014, 59(25):3134-3141 doi: 10.1007/s11434-014-0356-9
Ling W T, Shen Q, Gao Y Z, et al. Aust. J. Soil Res., 2007, 45(8):618-623 doi: 10.1071/SR07079
Tan J J, He S B, Yan S H, et al. Protoplasma, 2014, 251(5):1213-1221 doi: 10.1007/s00709-014-0628-x
Xiao T W, Mi M M, Wang C Y, et al. Environ. Exp. Bot., 2018, 153:45-53 doi: 10.1016/j.envexpbot.2018.04.006
Li J, Chen C L, Zhu K R, et al. J. Taiwan Inst. Chem. Eng., 2016, 59:389-394 doi: 10.1016/j.jtice.2015.09.010
Mahajan G, Sud D. Pol. J. Chem. Technol., 2014, 16:6-13 doi: 10.2478/pjct-2014-0062
Singh P K, Wang W J, Shrivastava A K. Aquat. Toxicol., 2018, 202:36-45 doi: 10.1016/j.aquatox.2018.06.011
Kapur M, Mondal M K. Desalin. Water Treat., 2016, 57(27):12620-12631 doi: 10.1080/19443994.2015.1049962
Zhang P, Wang R L, Ju Q, et al. Plant Physiol., 2019, 180 (1):529-542
Ponder S M, Darab J G, Mallouk T E. Environ. Sci. Technol., 2000, 34(12):2564-2569 doi: 10.1021/es9911420
Mirbagheri S A, Hosseini S N. Desalination, 2005, 171(1):85-93 doi: 10.1016/j.desal.2004.03.022
Özverdi A, Erdem M. J. Hazard. Mater., 2006, 137(1):626-632 doi: 10.1016/j.jhazmat.2006.02.051
Zou X Y, Yin Y B, Zhao Y B, et al. Mater. Lett., 2015, 150:59-61 doi: 10.1016/j.matlet.2015.02.133
Xiong L, Chen C, Chen Q, et al. J. Hazard. Mater., 2011, 189(3):741-748 doi: 10.1016/j.jhazmat.2011.03.006
Ponder S M, Darab J G, Mallouk T E. Environ. Sci. Technol., 2000, 34(12):2564-2569 doi: 10.1021/es9911420
Kanel S R, Manning B, Charlet L, et al. Environ. Sci. Technol., 2005, 39(5):1291-1298 doi: 10.1021/es048991u
Gámez del Río J A, Morando P J, Cicerone D S. J. Environ. Manage., 2004, 71:169-177 doi: 10.1016/j.jenvman.2004.02.004
Corami A, Mignardi S, Ferrini V. J. Hazard. Mater., 2007, 146(1/2):164-170 https://www.sciencedirect.com/science/article/abs/pii/S0304389406014312
Zou X Y, Zhao Y B, Zhang Z J. J. Contam. Hydrol., 2019, 226:103538-103544 doi: 10.1016/j.jconhyd.2019.103538
Tang W Q, Zeng R Y, Feng Y L, et al. Chem. Eng. J., 2013, 223:340-346 doi: 10.1016/j.cej.2013.02.094
Da Rocha N C C, De Campos R C, Rossi A M, et al. Environ. Sci. Technol., 2002, 36(7):1630-1635 doi: 10.1021/es0155940
Fuller C C, Bargar J R, Davis J A, et al. Environ. Sci. Technol., 2002, 36(2):158-165 doi: 10.1021/es0108483
Zhang C M, Li C X, Huang S S, et al. Biomaterials, 2010, 31 (12):3374-3383 doi: 10.1016/j.biomaterials.2010.01.044
Sneha M, Meenakshisundaram N, Kandaswamy A. Bull. Mater. Sci., 2016, 39(2):509-517 doi: 10.1007/s12034-016-1165-3
Lin K L, Pan J Y, Chen Y W, et al. J. Hazard. Mater., 2009, 161(1):231-240 doi: 10.1016/j.jhazmat.2008.03.076
Manecki M, Maurice P, Traina S J. Soil Sci., 2000, 165(12):920-933 doi: 10.1097/00010694-200012000-00002
Jeanjean J, Vincent U, Fedoroff M. J. Solid State Chem., 1994, 108(1):68-72 doi: 10.1006/jssc.1994.1010
Suzuki T, Ishigaki K, Miyake M. J. Chem. Soc., Faraday Trans. 1, 1984, 80(11):3157-3165 doi: 10.1039/f19848003157
Kumar R, Bishnoi N R, Nagpal G, et al. Chem. Eng. J., 2008, 135(3):202-208 doi: 10.1016/j.cej.2007.03.004
Albadarin A B, Mangwandi C, Al-Muhtaseb A, et al. Chem. Eng. J., 2012, 179:193-202 doi: 10.1016/j.cej.2011.10.080
Jain M, Garg V K, Kadirvelu K. J. Hazard. Mater., 2009, 162(1):365-372 doi: 10.1016/j.jhazmat.2008.05.048
De Lima L S, Araujo M D M, Percio S, et al. Chem. Eng. J., 2011, 166(3):881-889 doi: 10.1016/j.cej.2010.11.062

图 1 SEM image (a), XRD pattern (b), N2 adsorption-desorption isotherm (c) and pore diameter distribution (d) of the prepared HAP samples
Inset in Fig. 1a showed the TEM image

图 2 Immobilization rate of HAP NTs on single ions (a) and mixed ions (b); Adsorption time (c) and desorption rate (d) of HAP NTs on mixed ions

图 4 Relationship between the ratio of M to P of HAP/M and different amounts of mixed ions solution

图 5 XRD patterns of HAP/M obtained in different amounts of mixed ions solution
1: 10 mL; 2: 20 mL; 3: 30 mL; 4: 40 mL; 5: 50 mL; 6: 60 mL
表 1 Atomic fraction from EDS of HAP/M obtained in 10~60 mL mixed ions solution
| Volume / mL | Atomic fraction / % | |||
| Ca | P | O | Pb | |
| 10 | 12.75 | 8.99 | 74.71 | 0.8 |
| 20 | 15.08 | 11.29 | 67.32 | 4.01 |
| 30 | 11.80 | 9.46 | 73.67 | 4.52 |
| 40 | 13.65 | 10.58 | 69.79 | 4.24 |
| 50 | 8.35 | 6.93 | 75.45 | 4.49 |
| 60 | 9.03 | 7.66 | 75.34 | 5.21 |
 下载: 导出CSV

 扫一扫看文章

扫一扫关注我们


 下载:
下载: