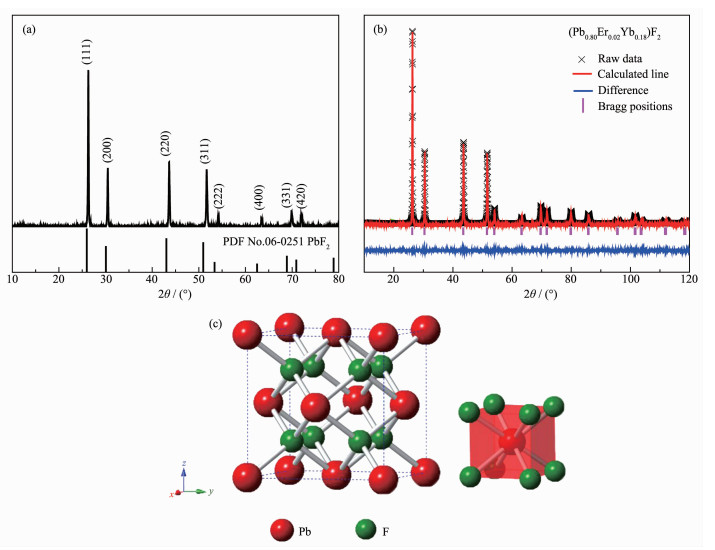
Figure 1.
(a) XRD pattern of the (Pb0.80Er0.02Yb0.18)F2 sample; (b) Rietveld refinement of the XRD pattern of (Pb0.80Er0.02Yb0.18)F2 sample; (c) Crystal structure representation of PbF2

Preparation of PbF2:Er3+, Yb3+ Phosphors and Multi-Wavelength Sensitive Bidirectional Conversion Luminescence Mechanism
Xiao-Yi MA , Biao LI , Yi-Fan WANG , Pan HU , Tong-Ting YAN , Zhao-Hui BAI


Over the past few decades, lanthanide-doped luminescence materials exhibited promising prospects for application in upconversion lasers[1-2], display tech-nologies[3-4], medical treatment[5-6], anti-counterfeit tech-nologies[7-8] and solar cells[9-10]. In particular, the appli-cation of up- and down-conversion phosphors to solar cells has attracted the attention of a large number of scientific researchers[11-12]. In past study, ultraviolet (UV) and infrared light conversion to visible light were realized by doping of different lanthanide ions in different materials[13-16]. Yu et al.[17] prepared Er3+-Yb3+ co-doped TiO2-xFx upconversion luminescence powder via hydrothermal method. They applied the upconversion-TiO2-xFx into dye sensitized solar cell (DSSC) and obtained an overall energy conversion efficiency of 7.08%. Zhang et al.[18] prepared SrAl2O4:Eu2+, Dy3+ powder via a combustion method, spectral characterization showed that it can convert ultraviolet (200~400 nm) to visible luminescence (520 nm). The solar conversion efficiency for a DSSC with SrAl2O4:Eu2+, Dy3+ doping (weight ratio of phosphor powder to TiO2 was 7:100) reached 7.938%. However, research on the fluorescence properties of bidirectional conversion luminescent materials that simultaneously convert ultraviolet and infrared light into visible light have rarely been reported.
Compared with other matrix materials, such as oxysulfide and NaYF4, lead fluoride (PbF2) have the advantage of excellent fluorescence response under 1 064 and 1 550 nm excitation, and are a fair good host material for bidirectional conversion lumine-scence[19-20]. In this work, we reported a bidirectional conversion PbF2:Er3+, Yb3+ phosphors, which could convert both UV light (378 nm) and infrared light (808, 980, 1 064 and 1 550 nm) into visible light (blue, green and red). Therefore, the as-prepared phosphors could improve conversion efficiency of solar cells and be widely used in solar cells. The bidirectional conversion PbF2:Er3+, Yb3+ phosphors were synthesized by the high temperature solid-state reaction method. The luminescence properties of the phosphors were analyzed. In addition, the down-conversion (DC) and up-conversion (UC) multi-wavelength sensitive lumine-scence mechanisms of the samples were discussed in detail.
PbF2:Er3+, Yb3+ bidirectional conversion phosphors were prepared via the high temperature solid-state reaction method. PbF2 (99.99%), Na2SiF6 (99.99%) were purchased from Shanghai Sinopharm Chemical Reagent Company. Er2O3 (99.99%), YbF3 (99.99%) were purchased from Hawei Ruike Chemical Reagent Company, HNO3 (65%~68% (w/w)), HF (40% (w/w)) and anhydrous ethanol were purchased from Beijing Chemical Company. Firsly, excess diluted HNO3 was added into the Er2O3 and stirred on a magnetic stirrer until the oxides were completely dissolved. After cooling, poured the mixed solution into a plastic cup and HF was added into the solution to obtain ErF3 precipitates, and washed several times. Then, the molar ratio of PbF2:ErF3:YbF3 was 80:2:18 according to the composition of the compound. Reactants were weighed according to a predetermined molar ratio and thoroughly ground in an agate mortar. Finally, the base materials were placed in a crucible covered with NaSiF6, heated to predetermined temperature (650 ℃) under a fluoride atmosphere provided by the decom-position of NaSiF6 and sintered for a certain time (1.5 h) to get the (Pb0.80Er0.02Yb0.18)F2 phosphors.
The XRD patterns were performed using a Rigaku D/max IIB diffractometer which recorded diffraction angel (2θ) from 20° to 80°, Cu Kα1 (λ=0.154 06 nm) was used as the radiation source with an accelerating voltage of 40 kV and a working current of 20 mA. The structure refinement data was collected through using the general structure analysis system (GSAS) software. The emission spectra and the intensity-power curves were measured with UV-Vis spectrophotometry using RF-5301PC coupled 808, 980, 1 064 and 1 550 nm laser. All the measurement data were performed at room temperature.
Fig. 1(a) gives XRD pattern of the (Pb0.80Er0.02Yb0.18)F2 phosphors. It is seen that all peak positions were consistent with the standard PDF No.06-0251 of cubic PbF2. The XRD results indicated that the synthesized sample was a cubic PbF2 structure with the space group of Fm3m (225). The Er3+ and Yb3+ ions have successfully entered PbF2 host lattice by occupying the Pb2+ sites; there was no impurity phase, which demonstrated that the synthetic crystal was pure phase. Fig. 1(b) displays the refinement pattern of the (Pb0.80Er0.02Yb0.18)F2 phosphor. The final refinement converged with indicator of goodness of fit χ2=1.858, with weighted profile factor Rwp=9.63%, and with profile factor Rp=7.76%, The comparison between experimental and calculated results illustrated that sample could better crystallize in the cubic. Fig. 1(c) gives the crystal structure of PbF2 and 8 coordination of Pb2+, which are distributed in face-centered cubic (FCC) crystal structure.
Table 1 presents the refinement result and structure parameter for (Pb0.80Er0.02Yb0.18)F2 phosphors. According to the data acquired by refinement, the occupation ratio of the Er3+/Yb3+ ions was 14.08% of the Pb2+ position, indicating that the doped Er3+/Yb3+ ions could effectively enter the PbF2 lattice cell. The lattice parameters are a=b=c=0.585 7 nm, α=β=γ=90°. The crystal structure of resultant sample shifted to high angle in comparison with the peak positions of the standard PbF2 crystallographic data (PDF No.06-0251, a=b=c=0.594 nm, α=β=γ=90°), which was mainly cause via bigger radius (Pb2+: 0.143 nm) replaced by smaller radius (Er3+: 0.117 nm, Yb3+: 0.113 nm).

 下载:
导出CSV
下载:
导出CSV
| Formula | (Pb0.80Er0.02Yb0.18)F2 | |||
| Crystal system | Cubic | |||
| Space group | Fm3m(225) | |||
| Z | 4 | |||
| a=b=c / nm | 0.585 7 | |||
| χ2 | 1.858 | |||
| Rp | 7.76% | |||
| Rwp | 9.63% | |||
| Atom | X | Y | Z | Occupation ratio |
| Pb1 | 0.000 | 0.000 | 0.000 | 0.859 2 |
| Er3+/Yb3+ | 0.000 | 0.000 | 0.000 | 0.140 8 |
| F1 | 0.250 | 0.250 | 0.250 | 1 |
The Er3+ and Yb3+ ions entered PbF2 lattice to replace Pb2+ ions to form ErPb and YbPb· and FF, and the F- ions in ErF3 and YbF3 entered PbF2 lattice to replace F- ions to form FF. The excess F- ions entered [F8] interspace in unit cell, forming an interstitial Fi′. Because the valence of both Er3+ and Yb3+ ions are higher than that of Pb2+ ions, charge imbalance is produced. The imbalance of charge between replacement and substituted ions leads to formation of vacant ions or interstitial ions[21-22]. The possible reactions when Er3+ and Yb3+ ions entered into lattice sites of Pb2+ ions were displayed below:
|
$ \text{Er}{{\text{F}}_{3}}\xrightarrow{\text{Pb}{{\text{F}}_{2}}}\text{ErP}{{\text{b}}^{\centerdot }}+2{{\text{F}}_{\text{F}}}+{{{\text{F}}}_{\text{i}}}' $ |
(1) |
|
$ \text{Yb}{{\text{F}}_{3}}\xrightarrow{\text{Pb}{{\text{F}}_{2}}}\text{ErP}{{\text{b}}^{\centerdot }}+2{{\text{F}}_{\text{F}}}+{{{\text{F}}}_{\text{i}}}' $ |
(2) |
The relative difference between the ionic radius of Er3+ and Yb3+ ions and the ionic radius of Pb2+ ions is not more than 15%, which improves the tendency of replacement. More importantly, the presence of [F8] interspace in PbF2 cell creates favorable conditions for the entry of F- (0.133 nm) into the lattice either in size (the length of [F8] interspace is 0.297 nm) or energy, so that the interstitial ion is in well coordination with interspace position.
Fig. 2 exhibits the emission and excitation spectrum of the optimal sample. Fig. 2a shows the excitation spectrum of the PbF2:Er3+, Yb3+ sample at 550 nm, which could be excited from the UV to the visible region, and highest peak intensity of the excitation spectrum at 378 nm. Therefore, to obtain a higher DC efficiency, the DC luminescence property of PbF2:Er3+, Yb3+ system at 378 nm excitation was studied. Fig. 2b presents the DC spectrum of the sample excited at 378 nm. It could be divided into three parts: (1) A blue emission band with an emission peak near 409 nm; (2) Both peaks are located at the green light emission band near 521 and 550 nm; (3) A red-light emission center around 650 nm. The emission peaks at ~409, ~521, ~550 and ~650 nm correspond to the 2H9/2→4I15/2, 2H11/2→4I15/2, 4S3/2→4I15/2 and 4F9/2→4I15/2 transitions, respectively.
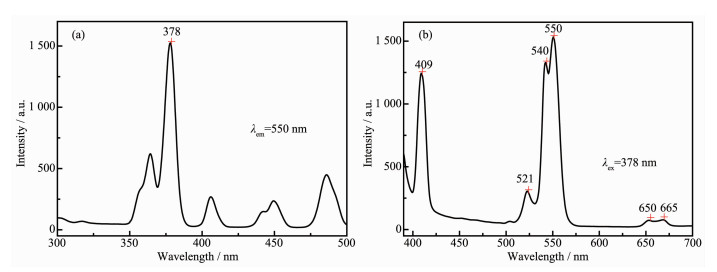
(a) λem=550 nm; (b) λex=378 nm
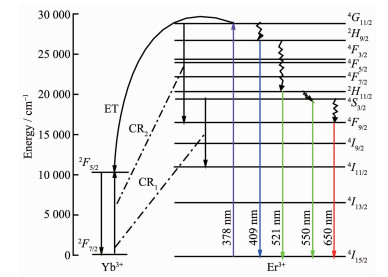
Fig. 3 describes the Yb3+-Er3+ energy-level diagram of the sample excited at 378 nm. First, the electrons could be pumped from 4I15/2 to 4G11/2 by absorbing the energy of near-ultraviolet light at 378 nm, and Er3+ ions transfered part of the energy to Yb3+ ions, produc-ing Yb3+:2F5/2→2F7/2 transition. Then, because of the narrow energy gap between the 4G11/2 and 2H9/2, the 4G11/2 energy level in Er3+ could easily relax to the 2H9/2 by non-radiation relaxation. Subsequently, particles in 2H9/2 returned to 4I15/2 generating blue luminescence around 409 nm. At this time, Er3+ ions at the 2H9/2 level might relax to the 2H11/2, 4S3/2, 4F9/2 levels by the fast multiphoton process[23-24]. In the end, Er3+ ions decayed from 2H11/2, 4S3/2 and 4F9//2 to the ground state 4I15/2 and emitted 521, 550 and 650 nm red-green light emission, respectively.
The cross relaxation (CR1) process results in particles significant reduction at the Er3+ ion 4S3/2 level. Consequently, the emission intensity at 550 nm reduced. The CR2 process leads to a significant increase in the population of the 4F9/2 level of Er3+ ions. As a result, the 650 nm luminescence intensity was relatively enhanced.
|
$ {\rm{C}}{{\rm{R}}_1}{\rm{:E}}{{\rm{r}}^{3 + }}\left( {^4{S_{3/2}}} \right) + {\rm{Y}}{{\rm{b}}^{3 + }}\left( {^2{F_{7/2}}} \right) \to {\rm{ E}}{{\rm{r}}^{3 + }}{(^4}{I_{11/2}}) + {\rm{Y}}{{\rm{b}}^{3 + }}\left( {^2{F_{5/2}}} \right) $ |
(3) |
|
$ {\rm{C}}{{\rm{R}}_2}{\rm{:E}}{{\rm{r}}^{3 + }}\left( {^4{\mathit{G}_{11/2}}} \right) + {\rm{Y}}{{\rm{b}}^{3 + }}\left( {^2{F_{7/2}}} \right) \to {\rm{E}}{{\rm{r}}^{3 + }}\left( {^4{F_{9/2}}} \right) + {\rm{Y}}{{\rm{b}}^{3 + }}\left( {^2{F_{5/2}}} \right){\rm{ }} $ |
(4) |
Fig. 4 depicts a series of UC emission spectra of optimal sample excited by different wavelength infrared light. Under excitation of 1 064, 980 and 808 nm lasers respectively, the spectra were presented an intense green emission at 540~550 nm as the result of the 4S3/2→4I15/2 transition of Er3+ ions, the weak green emission at 521 nm derived from the 2H11/2→4I15/2 transition while the weak red emission at 650~665 nm originated from the 4F9/2→4I15/2 transition. Compared with other luminescence emission spectra, the phosphor presented an intense red emission under 1 550 nm excitation.
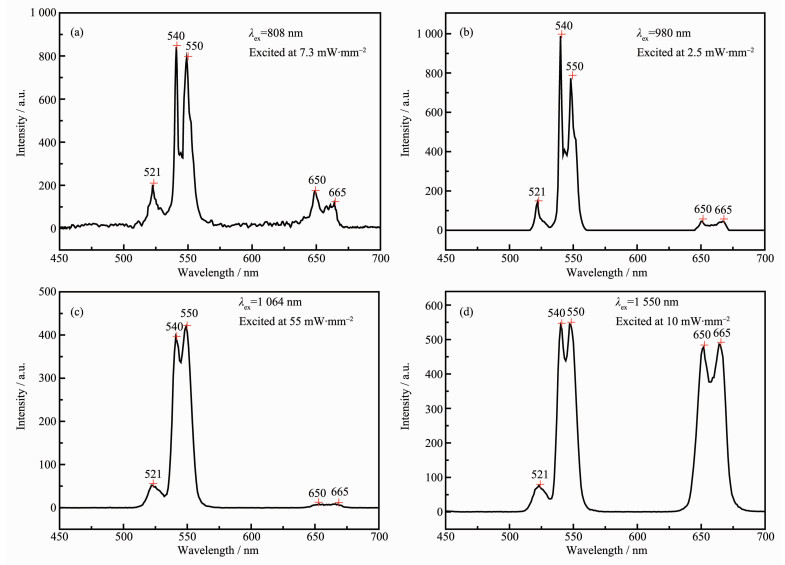
(a) 808, (b) 980, (c) 1 064 and (d) 1 550 nm
It is known that the emission spectrum of the trivalent rear earth (RE) ions doped UC material varies with excitation power[25]. To identify the relative mechanism of the three UC emissions of Er3+ ions excited at 1 064 nm at room temperature for the (Pb0.80Er0.02Yb0.18)F2 sample. The dependence of emission intensities versus pump power is presented in Fig. 5. The result is illustrated in the intensity-power plots, and the values of slopes for the ~521 nm (green), ~550 nm (green) and ~650 nm (red) were approximately to 2, indicating that the two-photon process was mainly responsible for the observed UC emission under 1 064 nm excitation.
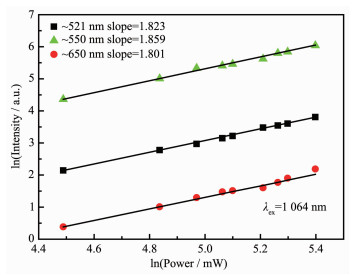
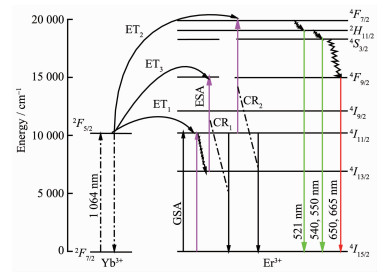
Fig. 6 illustrates the simplified Er3+-Yb3+ energy level diagram of sample under excitation of 1 064 nm. Er3+ ion acted as an activator and was the luminescent center of the sample. It is observed that the 2F5/2 state of Yb3+ ions was very close to the 4I11/2 state of Er3+ ions, therefore, an effective energy transmission process could take place between Er3+ and Yb3+ ions. Firstly, the 2F5/2 state of Yb3+ ions could be populated through absorbing 1 064 nm infrared light. And the Er3+ ion transited from 4I15/2 to 4I11/2 level by ground state absorption (GSA) and energy transfer (ET1) from Yb3+ ions. Then, the electrons could be pumped from 4I11/2 state of Er3+ ions to 4F7/2 state through ET2 process:
|
$ \text{GSA:E}{{\text{r}}^{3+}}\left( ^{4}{{\mathit{I}}_{15/2}} \right)+\text{a}\ \text{1}\ \text{064 nm}\ \text{photon}\to \text{E}{{\text{r}}^{3+}}\left( ^{4}{{I}_{11/2}} \right)~ $ |
(5) |
|
$ {\rm{E}}{{\rm{T}}_1}:{\rm{E}}{{\rm{r}}^{3 + }}\left( {^4{I_{15/2}}} \right) + {\rm{Y}}{{\rm{b}}^{3 + }}\left( {^2{F_{5/2}}} \right) \to {\rm{ E}}{{\rm{r}}^{3 + }}{(^4}{I_{11/2}}) + {\rm{Y}}{{\rm{b}}^{3 + }}\left( {^2{F_{7/2}}} \right){\rm{ }} $ |
(6) |
|
$ {\rm{E}}{{\rm{T}}_2}:{\rm{E}}{{\rm{r}}^{3 + }}\left( {^4{I_{11/2}}} \right) + {\rm{Y}}{{\rm{b}}^{3 + }}\left( {^2{F_{5/2}}} \right) \to {\rm{ E}}{{\rm{r}}^{3 + }}{(^4}{I_{7/2}}) + {\rm{Y}}{{\rm{b}}^{3 + }}\left( {^2{F_{7/2}}} \right){\rm{ }} $ |
(7) |
Furthermore, Er3+ ions at the 4F7/2 level might relax to the 2H11/2 and 4S3/2 levels by the fast-multiphoton process. Subsequently, Er3+ions at the 2H11/2 and 4S3/2 energy level returned to the ground state 4I15/2 while emitting green light at 521 and 550 nm, respectively. In addition, Er3+ ions at the 4I11/2 level possibly underwent a non-radiative transition to reach the 4I13/2 levels, and the Er3+ ion transited from the excited state 4I13/2 to 4F9/2 level by excited state absorption (ESA) and ET3:
|
$ \text{GSA:E}{{\text{r}}^{3+}}\left( ^{4}{{\mathit{I}}_{13/2}} \right)+\text{a}\ \text{1}\ \text{064 nm}\ \text{photon}\to \text{E}{{\text{r}}^{3+}}\left( ^{4}{{F}_{9/2}} \right)~ $ |
(8) |
|
$ {\rm{E}}{{\rm{T}}_3}:{\rm{E}}{{\rm{r}}^{3 + }}\left( {^4{I_{13/2}}} \right) + {\rm{Y}}{{\rm{b}}^{3 + }}\left( {^2{F_{5/2}}} \right) \to {\rm{ E}}{{\rm{r}}^{3 + }}{(^4}{F_{9/2}}) + {\rm{Y}}{{\rm{b}}^{3 + }}\left( {^2{F_{7/2}}} \right){\rm{ }} $ |
(9) |
Finally, the electron at the 4F9/2 level returns to 4I15/2 ground state and emitted weak red fluorescence at 650 nm. Furthermore, the CR1 and CR2 process among Er3+ ions enhanced the UC luminescence efficiency of the sample[26]:
|
$ {\rm{C}}{{\rm{R}}_1}{\rm{:E}}{{\rm{r}}^{3 + }}\left( {^4{I_{13/2}}} \right) + {\rm{E}}{{\rm{r}}^{3 + }}\left( {^4{I_{11/2}}} \right) \to {\rm{ E}}{{\rm{r}}^{3 + }}{(^4}{F_{9/2}}) + {\rm{E}}{{\rm{r}}^{3 + }}\left( {^4{I_{15/2}}} \right){\rm{ }} $ |
(10) |
|
$ {\rm{C}}{{\rm{R}}_2}{\rm{:E}}{{\rm{r}}^{3 + }}\left( {^4{I_{11/2}}} \right) + {\rm{E}}{{\rm{r}}^{3 + }}\left( {^4{I_{11/2}}} \right) \to {\rm{ E}}{{\rm{r}}^{3 + }}{(^4}{F_{7/2}}) + {\rm{E}}{{\rm{r}}^{3 + }}\left( {^4{I_{15/2}}} \right){\rm{ }} $ |
(11) |
Fig. 7 depicts the measured power dependence of the three UC emissions of Er3+ ions excited by 1 550 nm at room temperature for the (Pb0.80Er0.02Yb0.18)F2 sample. The result is illustrated in the intensity-power plots, the green and red emissions exhibited a sub-cubic (2.675, 2.60 and 2.873) power-law behavior for the excitation at 1 550 nm, which indicated that three pumping photons around 1 550 nm participate in the UC excitation process.
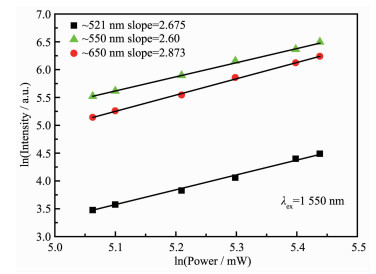
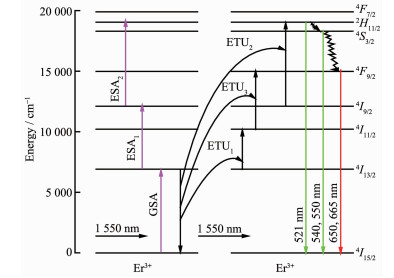
Fig. 8 presents the energy-level diagram of the sample excited by 1 550 nm. Yb3+ ions could not absorb 1 550 nm infrared light, hence the UC luminescence should depend on the absorption process of Er3+ ions and the energy transfer up-conversion (ETU) process among Er3+ ions. When excited by 1 550 nm infrared light, Er3+ ions were promoted from the ground state 4I15/2 to the first excited state 4I13/2 by GSA. Subse-quently, the Er3+ ion transited from the excited state 4I13/2 to 4I9/2 level by ESA1 and ETU1[27-28]:
|
$ \text{GSA:E}{{\text{r}}^{3+}}\left( ^{4}{{I}_{15/2}} \right)+\text{a}\ 1\ 550\text{ nm photon}\to \text{E}{{\text{r}}^{3+}}\left( ^{4}{{I}_{13/2}} \right)~ $ |
(12) |
|
$ \text{ES}{{\text{A}}_{\text{1}}}\text{:E}{{\text{r}}^{3+}}\left( ^{4}{{I}_{13/2}} \right)+\text{a}\ 1\ 550\text{ nm photon}\to \text{E}{{\text{r}}^{3+}}\left( ^{4}{{I}_{9/2}} \right)~ $ |
(13) |
|
$ {\rm{ET}}{{\rm{U}}_{\rm{1}}}{\rm{:E}}{{\rm{r}}^{3 + }}\left( {^4{I_{13/2}}} \right) + {\rm{E}}{{\rm{r}}^{3 + }}\left( {^4{I_{13/2}}} \right) \to {\rm{E}}{{\rm{r}}^{3 + }}\left( {^4{I_{11/2}}} \right) + {\rm{E}}{{\rm{r}}^{3 + }}\left( {^4{I_{15/2}}} \right){\rm{ }} $ |
(14) |
Then, the electrons at 4I9/2 state could transit to 2H11/2 state through ESA2 and transit to 4I11/2 level by the no-radiation relaxation process, and through the ETU2 process transitions to the higher excited state 2H11/2:
|
$ \text{ES}{{\text{A}}_{2}}\text{:E}{{\text{r}}^{3+}}\left( ^{4}{{I}_{9/2}} \right)+\text{a}\ 1\ 550\text{ nm photon}\to \text{E}{{\text{r}}^{3+}}\left( ^{2}{{H}_{11/2}} \right)~ $ |
(15) |
|
$ {\rm{ET}}{{\rm{U}}_2}{\rm{:E}}{{\rm{r}}^{3 + }}\left( {^4{I_{13/2}}} \right) + {\rm{E}}{{\rm{r}}^{3 + }}\left( {^4{I_{9/2}}} \right) \to {\rm{E}}{{\rm{r}}^{3 + }}\left( {^4{I_{15/2}}} \right) + {\rm{E}}{{\rm{r}}^{3 + }}\left( {^2{H_{11/2}}} \right) $ |
(16) |
Finally, the Er3+ions at the 2H11/2 state relaxed to the 4S3/2 and 4F9/2 level by the fast-multiphoton process. The radiation decayed from the 2H11/2, 4S3/2 and 4F9/2 states to the ground state and generated UC luminescence at 521, 540~550 nm and 650~665 nm, respectively.
Compared with other luminescence emission spectra, the red emission of the sample under 1 550 nm excitation was increased. The increase of the red component in the sample was mainly due to the ETU3 between the Er3+ ion at the 4I13/2 and 4I11/2 level[29-30], resulting in an increase of Er3+ ions at the 4F9/2 level.
|
$ {\rm{ET}}{{\rm{U}}_3}{\rm{:E}}{{\rm{r}}^{3 + }}\left( {^4{I_{13/2}}} \right) + {\rm{E}}{{\rm{r}}^{3 + }}\left( {^4{I_{11/2}}} \right) \to {\rm{E}}{{\rm{r}}^{3 + }}\left( {^4{I_{15/2}}} \right) + {\rm{E}}{{\rm{r}}^{3 + }}\left( {^4{F_{9/2}}} \right) $ |
(17) |
The dependence excited by 980 nm is illustrated in the intensity-power plots in Fig. 9. The green and red emissions exhibited a sub-square power-law behavior for the excitation at 980 nm, the values of slopes for the ~521 nm green emission, ~550 nm green emission and ~650 nm red emission are 1.857, 1.920 and 1.831, respectively. It is suggested that two pumping photons around 980 nm participate in the UC excitation process.
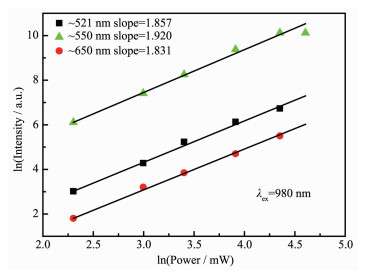
Fig. 10 describes the simplified Yb3+-Er3+ energy-level diagram of the sample under excitation of 980 nm. First, when the sample was irradiated by 980 nm laser, Yb3+ ions transited from the ground state 2F7/2 to 2F5/2 level. Then, the Er3+ ion transited from the ground state to 4I11/2 was through either GSA or ET1 process between Yb3+ and Er3+ ions:
|
$ \text{GSA:E}{{\text{r}}^{3+}}\left( ^{4}{{I}_{15/2}} \right)+\text{a}\ 980\text{ nm photon}\to \text{E}{{\text{r}}^{3+}}\left( ^{4}{{I}_{11/2}} \right) $ |
(18) |
|
$ {\rm{E}}{{\rm{T}}_1}:{\rm{E}}{{\rm{r}}^{3 + }}\left( {^4{I_{15/2}}} \right) + {\rm{Y}}{{\rm{b}}^{3 + }}\left( {^2{F_{5/2}}} \right) \to {\rm{ E}}{{\rm{r}}^{3 + }}{(^4}{I_{11/2}}) + {\rm{Y}}{{\rm{b}}^{3 + }}\left( {^2{F_{7/2}}} \right) $ |
(19) |
Similarly, the Er3+ ion transited from the excited state 4I11/2 to 4F7/2 level by ESA1, CR1, ET2:
|
$ \text{ES}{{\text{A}}_{\text{1}}}\text{:E}{{\text{r}}^{3+}}\left( ^{4}{{I}_{11/2}} \right)+\text{a}\ 980\text{ nm photon}\to \text{E}{{\text{r}}^{3+}}\left( ^{4}{{F}_{7/2}} \right) $ |
(20) |
|
$ {\rm{E}}{{\rm{T}}_2}:{\rm{E}}{{\rm{r}}^{3 + }}\left( {^4{I_{11/2}}} \right) + {\rm{Y}}{{\rm{b}}^{3 + }}\left( {^2{F_{5/2}}} \right) \to {\rm{ E}}{{\rm{r}}^{3 + }}{(^4}{F_{7/2}}) + {\rm{Y}}{{\rm{b}}^{3 + }}\left( {^2{F_{7/2}}} \right) $ |
(21) |
|
$ {\rm{C}}{{\rm{R}}_1}{\rm{:E}}{{\rm{r}}^{3 + }}\left( {^4{I_{11/2}}} \right) + {\rm{E}}{{\rm{r}}^{3 + }}\left( {^4{{\rm{I}}_{11/2}}} \right) \to {\rm{ E}}{{\rm{r}}^{3 + }}{(^4}{{\rm{I}}_{15/2}}) + {\rm{E}}{{\rm{r}}^{3 + }}\left( {^4{F_{7/2}}} \right) $ |
(22) |
In addition, Er3+ ions at the 4F7/2 level relaxed to the 2H11/2 and 4S3/2 levels by the fast-multiphoton process. Then, the radiation decayed from the 2H11/2 and 4S3/2 levels to the 4I15/2 ground state and generated green UC emission at 521 and 550 nm, respectively. Red UC emission mainly came from the population of 4F9/2 level of Er3+ ions[31-32]. The Er3+ ions at 4I11/2 relaxed to the 4I13/2 by the fast-multiphoton process and then transit to 4F9/2 level by ESA2, CR2, CR3 and ET3:
|
$ \text{ES}{{\text{A}}_{2}}\text{:E}{{\text{r}}^{3+}}\left( ^{4}{{I}_{13/2}} \right)+\text{a}\ 980\text{ nm photon}\to \text{E}{{\text{r}}^{3+}}\left( ^{4}{{F}_{9/2}} \right)~ $ |
(23) |
|
$ {\rm{C}}{{\rm{R}}_2}{\rm{:E}}{{\rm{r}}^{3 + }}\left( {^4{I_{13/2}}} \right) + {\rm{E}}{{\rm{r}}^{3 + }}\left( {^4{\mathit{I}_{11/2}}} \right) \to {\rm{ E}}{{\rm{r}}^{3 + }}{(^4}{\mathit{I}_{15/2}}) + {\rm{E}}{{\rm{r}}^{3 + }}\left( {^4{F_{9/2}}} \right) $ |
(24) |
|
$ {\rm{C}}{{\rm{R}}_3}{\rm{:E}}{{\rm{r}}^{3 + }}\left( {^4{I_{7/2}}} \right) + {\rm{E}}{{\rm{r}}^{3 + }}\left( {^4{\mathit{I}_{11/2}}} \right) \to {\rm{ E}}{{\rm{r}}^{3 + }}{(^4}{F_{9/2}}) + {\rm{E}}{{\rm{r}}^{3 + }}\left( {^4{F_{9/2}}} \right) $ |
(25) |
|
$ {\rm{E}}{{\rm{T}}_3}:{\rm{E}}{{\rm{r}}^{3 + }}\left( {^4{I_{13/2}}} \right) + {\rm{Y}}{{\rm{b}}^{3 + }}\left( {^2{F_{5/2}}} \right) \to {\rm{ E}}{{\rm{r}}^{3 + }}{(^4}{F_{9/2}}) + {\rm{Y}}{{\rm{b}}^{3 + }}\left( {^2{F_{7/2}}} \right){\rm{ }} $ |
(26) |
Finally, the electronic at 4F9/2 level decayed to 4I15/2 ground state and emitted red fluorescence at 650 nm. In summary, the red UC luminescence intensity was not as strong as the green emission, which was due to the large energy gap between the 4S3/2 and 4F9/2 energy levels, making it difficult to relax without radiation.
Fig. 11 presents the energy-level diagram of the sample excited at 808 nm. Firstly, Er3+ ions are promoted from 4I15/2 to 4I9/2 by absorb an 808 nm photon (GSA). Since 4I9/2, 4I11/2 and 4I13/2 belonged to different spectral branches of the same spectral term, Er3+ ions at the 4F9/2 level relaxed to the 4I11/2 and 4I13/2 levels by no-radiation transitions process. Subsequently, the Er3+ ions at 4I13/2 could absorb an 808 nm photon to transit to 4F7/2 and 4S3/2 level (ESA1, ESA2). Then, the radiation decayed from the 4S3/2 levels to the 4I15/2 and generated green UC emission 550 nm. In addition, the CR2 phenomenon caused energy transfer between ions at the 4I11/2 level, Er3+ ions at the 4F7/2 level might relax to 2H11/2 by the fast-multiphoton process, the radiation decayed from the 2H11/2 levels to the 4I15/2 generateed weak green UC emission at 521 nm. Finally, another CR1 between 4I11/2 and 4I13/2 level resulted in a large accumulation of ions at the 4F9/2 level, the electronic at 4F9/2 level decayed to 4I15/2 and emitted red fluorescence at 650 nm[33].
|
$ {\rm{C}}{{\rm{R}}_1}{\rm{:E}}{{\rm{r}}^{3 + }}\left( {^4{I_{13/2}}} \right) + {\rm{E}}{{\rm{r}}^{3 + }}\left( {^4{\mathit{I}_{11/2}}} \right) \to {\rm{ E}}{{\rm{r}}^{3 + }}{(^4}{F_{9/2}}) + {\rm{E}}{{\rm{r}}^{3 + }}\left( {^4{I_{15/2}}} \right){\rm{ }} $ |
(27) |
|
$ {\rm{C}}{{\rm{R}}_2}{\rm{:E}}{{\rm{r}}^{3 + }}\left( {^4{F_{11/2}}} \right) + {\rm{E}}{{\rm{r}}^{3 + }}\left( {^4{\mathit{I}_{11/2}}} \right) \to {\rm{ E}}{{\rm{r}}^{3 + }}{(^4}{F_{7/2}}) + {\rm{E}}{{\rm{r}}^{3 + }}\left( {^4{F_{15/2}}} \right) $ |
(28) |
In summary, we report on the bidirectional conv-ersion properties of Er3+-Yb3+ co-doped PbF2 prepared by high temperature solid-state reaction method, which may be used for enhancement of the conversion efficiency of solar cells. XRD and structure refinement data showed the Er3+/Yb3+ occupied solely Pb2+ sites in the crystal host. Through analysis the DC and UC multi-wavelength sensitive luminescence mechanisms of the phosphor, it is found that the resultant phosphor could simultaneously convert both UV light (378 nm) and infrared light (808, 980, 1 064 and 1 550 nm) into visible light (blue, green and red) which could improve conversion efficiency of solar cells.
Cheng Y Y, Fuckel B, Khoury T, et al. Energy Environ. Sci., 2012, 5(5):6953-6959 doi: 10.1039/c2ee21136j
Yuan C Z, Chen G Y, Li L, et al. ACS Appl. Mater. Interfaces., 2014, 6(20):18018-18025 doi: 10.1021/am504866g
Cho J Y, Ko K Y, Do Y R. Thin Solid Films., 2007, 515(7):3373-3379 https://www.sciencedirect.com/science/article/pii/S0040609006010807
Rapaport A, Milliez J, Bass M, et al. J. Disp. Technol., 2006, 2(1):68-78 doi: 10.1109/JDT.2005.863781
Chen G Y, Liu Y, Zhang Y G, et al. Appl. Phys. Lett., 2007, 91(13):133103 doi: 10.1063/1.2787893
Wang G F, Peng Q, Li Y D. J. Am. Chem. Soc., 2009, 131(40):14200-14201 doi: 10.1021/ja906732y
张小青, 林祥, 乔旭升.材料科学与工程学报, 2010, 28(5):663-666 http://www.cqvip.com/QK/71135X/201107/35645375.htmlZHANG Xiao-qing, LIN Xiang, QIAO Xu-Sheng. J. Mater. Sci. Eng., 2010, 28(5):663-666 http://www.cqvip.com/QK/71135X/201107/35645375.html
You M L, Zhong J J, Hong Y, et al. Nanoscale., 2015, 7(10):4423-4431 doi: 10.1039/C4NR06944G
Yuan C Z, Chen G Y, Prasad P N, et al. J. Mater. Chem., 2012, 22(33):16709-16713 doi: 10.1039/c2jm16127c
Ramasamy P, Manivasakan P, Kim J. RSC Adv., 2014, 4(66):34873-34895 doi: 10.1039/C4RA03919J
Shockley W, Queisser H J. J. Appl. Phys., 1961, 32(3):510-519 doi: 10.1063/1.1736034
Yella A, Lee H W, Tsao H N, et al. Science., 2011, 334(6056):629-634 doi: 10.1126/science.1209688
Hirai T, Orikoshi T. J. Colloid Interface Sci., 2004, 273(2):470-477 doi: 10.1016/j.jcis.2003.12.013
Hosseini Z, Taghavinia N, Duang E W. Mater. Lett., 2016, 188(104):92-94 https://www.sciencedirect.com/science/article/abs/pii/S0167577X16317013
Kumar G A, Pokhrel M, Sardar D K. Mater. Lett., 2012, 68(1):395-398 https://www.sciencedirect.com/science/article/abs/pii/S0167577X11012535
Kumar P, Kanika, Singh S, et al. J. Lumin., 2017, 196(12):207-213 https://www.sciencedirect.com/science/article/pii/S0022231317317015
Yu J, Yang Y L, Fan R Q, et al. J. Power Sources., 2013, 243:436-443 doi: 10.1016/j.jpowsour.2013.06.014
Zhang J F, Lin J M, Wu J, et al. J. Mater. Sci.-Mater. Electron., 2016, 27(2):1350-1356 doi: 10.1007/s10854-015-3896-0
Wang H Q, Batentschuk M, Osvet A, et al. Adv. Mater., 2011, 23(22/23):2675-2680 https://www.ncbi.nlm.nih.gov/pubmed/21823249
Ma W, Yu W S, Dong X T, et al. Chem. Eng. J., 2014, 244(7):531-539
Lorbeer C, Behrends F, Cybinska J, et al. J. Mater. Chem. C, 2014, 2(44):9439-9450 doi: 10.1039/C4TC01214C
Sinha S, Mahata M K, Swart H C, et al. New J. Chem., 2017, 41(13):5362-5372 doi: 10.1039/C7NJ00086C
Luo X X, Cao W H. Sci. China Chem., 2017, 50(4):505-513 http://www.wanfangdata.com.cn/details/detail.do?_type=perio&id=zgkx-eb200704009
Xiao S, Yang X, Ding J W. Appl. Phys. B, 2010, 99(4):769-773 doi: 10.1007/s00340-010-3960-7
Luo W J, Wang Y G, Chen Y P, et al. J. Mater. Chem. C, 2013, 1(36):5711-5717 doi: 10.1039/c3tc31016g
钱静娴, 柏朝晖, 张希艳.硅酸盐学报, 2013, 41(12):1725-1729 https://www.ingentaconnect.com/content/ccs/jccs/2013/00000041/00000012/art00022QIAN Jing-Xian, BAI Zhao-Hui, ZHANG Xi-Yan. Journal of the Chinese Ceramic Society, 2013, 41(12):1725-1729 https://www.ingentaconnect.com/content/ccs/jccs/2013/00000041/00000012/art00022
柏朝晖, 李秀贤, 张希艳, 等.无机化学学报, 2012, 28(4):674-678BAI Zhao-Hui, LI Xiu-Xian, ZHANG Xi-Yan, et al. Chinese J. Inorg. Chem., 2012, 28(4):674-678
Fan W, Zhang X Y, Chen L X, et al. CrystEngComm, 2015, 17(8):1881-1889 doi: 10.1039/C4CE02243B
周禾丰, 张树全, 王华, 等.光谱学与光谱分析, 2013, 33(1):23-26 doi: 10.3964/j.issn.1000-0593(2013)01-0023-04ZHOU He-Feng, ZHANG Shu-Quan, WANG Hua, et al. Spectrosc. Spectr. Anal., 2013, 33(1):23-26 doi: 10.3964/j.issn.1000-0593(2013)01-0023-04
Tai Y, Wang H Y, Wang H, et al. RSC Adv., 2015, 6(5):4085-4089
Georgobiani A N, Bogatyreva A A, Ishchenko V M, et al. Inorg. Mater., 2007, 43(10):1073-1079 doi: 10.1134/S0020168507100093
杨魁胜, 翟海青, 崔光, 等.无机化学学报, 2009, 25(5):855-859 doi: 10.3321/j.issn:1001-4861.2009.05.017YANG Kui-Sheng, ZHAI Hai-Qing, CUI Guang, et al. Chinese J. Inorg. Chem., 2009, 25(5):855-859 doi: 10.3321/j.issn:1001-4861.2009.05.017
Tian L J, Zheng X, Zhao S L, et al. Materials, 2014, 7(11):7289-7303 doi: 10.3390/ma7117289

Figure 1 (a) XRD pattern of the (Pb0.80Er0.02Yb0.18)F2 sample; (b) Rietveld refinement of the XRD pattern of (Pb0.80Er0.02Yb0.18)F2 sample; (c) Crystal structure representation of PbF2

Figure 2 Emission and excitation spectra of (Pb0.80Er0.02Yb0.18)F2 sample
(a) λem=550 nm; (b) λex=378 nm

Figure 4 Emission spectra of the (Pb0.80Er0.02Yb0.18)F2 excited at different wavelengths
(a) 808, (b) 980, (c) 1 064 and (d) 1 550 nm

Figure 5 Intensity-power plots of the green and red emissions versus excitation power at 1064 nm

Figure 7 Intensity-power plots of the green and red emissions versus excitation power at 1 550 nm

Figure 9 Intensity-power plots of the green and red emissions versus excitation power at 980 nm
Table 1. Refinement results and structure parameters for (Pb0.80Er0.02Yb0.18)F2
| Formula | (Pb0.80Er0.02Yb0.18)F2 | |||
| Crystal system | Cubic | |||
| Space group | Fm3m(225) | |||
| Z | 4 | |||
| a=b=c / nm | 0.585 7 | |||
| χ2 | 1.858 | |||
| Rp | 7.76% | |||
| Rwp | 9.63% | |||
| Atom | X | Y | Z | Occupation ratio |
| Pb1 | 0.000 | 0.000 | 0.000 | 0.859 2 |
| Er3+/Yb3+ | 0.000 | 0.000 | 0.000 | 0.140 8 |
| F1 | 0.250 | 0.250 | 0.250 | 1 |
 下载: 导出CSV

 扫一扫看文章


扫一扫关注我们


 下载:
下载: