Citation:
XU Yan, YAO Ai-Hua, JIANG Wen-Qi, WANG De-Ping. Fabrication of Titanium Nitride Nanotube Array as SERS Substrates[J]. Chinese Journal of Inorganic Chemistry,
2018, 34(7): 1392-1398.
doi:
10.11862/CJIC.2018.185
Received Date:
21 March 2018 Revised Date:
17 May 2018 Available Online:
10 July 2018
Abstract:
TiN nanotube arrays (NTAs) was prepared by calcining the anodized TiO2 NTAs in NH3 atmosphere at elevated temperatures, which were used as surface-enhanced Raman scattering (SERS) substrates. The composition, morphology and optical property of the TiN NTAs were characterized by XRD, SEM, UV-Vis and XPS. SERS activity of the TiN NTAs substrates was evaluated using rhodamine 6G (R6G) as probe molecules. The results showed that TiN NTAs were obtained at nitridation temperatures above 800℃, and the nanotubes exhibit ordered tubular structure with pore diameters of 100~200 nm. The UV-Vis spectra exhibited plasmon resonance peaks of TiN NTAs in the wavelength range of 500~600 nm. The TiN NTAs substrates provided superior SERS sensitivity towards R6G, with a detection limit of ~10-7 mol·L-1 and the enhancement factor of ~105.
Surface-enhanced Raman scattering (SERS) is a non-destructive, ultrasensitive and powerful analytical technique, and has been widely used in surface chemistry[1-2], biological identifications and detections[3]. It is well known the unique property and application of SERS are closely related to a highly efficient enhancement substrate. To date, various SERS-active substrates with a high Raman enhancement factor (EF), uniformity and stability have been successfully developed[4]. Among them, noble metal nanoparticles of various sizes and shapes, especially Au, Ag and Cu, represent one of the most promising materials because their plasmon resonance frequencies locate within excitation wavelength ranges commonly used in Raman spectroscopy[5]. However, it remains a challenge to fabricate perfect plasmonic nanostructures with high density "hot spots" to achieve strong electromagnetic contribution to SERS enhancement, which usually requires delicate procedures and high cost[6]. In addition, noble metals typically suffer from poor stability and high cost, and therefore the search of other alternative materials for using as SERS substrates becomes highly desirable.
Titanium nitride (TiN) is known to exhibit similar plasmonic behavior to gold, with a plasmonic resonance absorption peak in the visible and near-infrared light range[6-8]. However, TiN possesses additional significant advantages when compared to Au, such as low cost, high chemical and thermal stability, and simple fabrication[9]. These advantages make it attractive as plasmonic material for a variety of applications in several industries including protective coatings, biomedical, and microelectronics. TiN thin films[10] and nanorods[11] were recently explored as SERS-active substrates and were found to exhibit a noble metalcomparable SERS enhancement, with a detection limit in the range of 10-6 mol·L-1 for R6G solutions.
Inspired by the studies above, we developed TiN nanotube-based SERS active substrates for detection of organic molecules. It is anticipated that the tubular structure of TiN nanotube array allows for efficient light trapping due to multiple scattering within the small channels, and thus offers additionally advantages to the SERS sensitivity[3]. Vertically oriented TiO2 nanotube arrays were first grown by anodic oxidation of titanium foils, which is subsequently calcined in NH3 atmosphere at elevated temperatures. The SERS performances of the TiN substrates nitrided at different temperatures were investigated using R6G as a probe molecule. Our results confirmed that the resultant TiN nanotube arrays exhibit strong and uniform SERS response toward R6G thanks to their plasmonic resonance behaviors and uniform tubular structures. Detection limit of about 10-7 mol·L-1 and the enhancement factor of ~105 for R6G can be reached, well beyond the detection limit achieved using TiO2 nanotube arrays.
1.
Experimental
1.1
Chemicals
Titanium foil was purchased from Qingyuan metal material company(Hebei, China). Diethylene glycol(DEG) and Hydrofluoric Acid(HF) were purchased from Sinopharm Chemical Reagent Company (Shanghai, China). All reagents were analytical grade and used without further purification.
1.2
Fabrication of TiN NTAs
Prior to anodic oxidation, Ti foils of 17 mm×17 mm×0.5 mm were cleaned sequentially with ethanol, acetone and deionized water for 10 min in an ultrasonic bath. The foils were then chemically polished by immersion in a mixture of HF and HNO3 acids (VHF: VHNO3=1:1.2) for 60 s and rinsed in deionized water. The anodization process was performed in a homemade two-electrode cell with a Ti foil as the anode and a Pt foil as the cathode. The distance between two electrodes was set to 4 cm. Vertically oriented TiO2 NTAs were prepared by anodization of Ti foils in diethylene glycol solution containing 1%(w/w) of HF at room temperature for 24 h at a potential of 60 V.
The as-grown TiO2 NTAs were then calcined at 450 ℃ at a heating rate of 3 ℃·min-1 for 3 h to transform the amorphous TiO2 film to anatase phase, and the fluorine residues were simultaneously removed[12]. To prepare TiN NTAs, the TiO2 NTAs were nitrided at different temperatures (700~900 ℃) for 2 h under NH3 gas flow at a heating rate of 3 ℃·min-1. The flow rate of NH3 gas was kept 50 mL·min-1 from 300 to 500 ℃. When the nitridation temperature reached to 500 ℃, the flow rate of NH3 gas was adjusted to 100 mL·min-1. The samples were cooled under NH3 gas until the temperature decreased to 300 ℃.
1.3
Characterization
The surface morphology and the microstructure were investigated using a field emission scanning electron microscope (FESEM, Hitachi S-2360). X-ray powder diffraction (XRD) was conducted on a Rigaku D max 2550 diffractometer using Cu Kα radiation (λ=0.154 18 nm) operated at 40 kV and 40 mA in the 2θ range of 20°~90°. UV-Vis diffuse reflectance spectra (DRS) were recorded over the spectral range of 300~800 nm on a Lambda 750 UV/Vis/NIR spectrometer (Perkin Elmer, USA). BaSO4 was used as a reflectance standard. The elemental composition was determined by an X-ray photoelectron spectroscopy (XPS, Escalab 250Xi, Thermo Scientific) using a 500 μm diameter beam of monochromatic Al Kα radiation. SERS mea-surements were conducted with a Renishaw inVia micro -Raman spectrometer with He-Ne laser excitation at 532 nm. A 100× objective was used to focus the laser beam and to collect the Raman signals. The SERS spectra were collected from at least 5 random locations with an accumulation time of 10 s, and expressed in terms of average spectra. All samples were incubated in different concentrations of R6G aqueous solutions for 12 h to allow for equilibrium adsorption, and then air dried at ambient conditions for SERS measurement.
2.
Results and discussion
2.1
Preparation and characterization of TiN NTAs
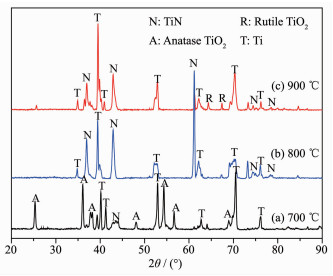
The crystal structure and phase composition of the nitrided products of TiO2 NTAs at different temperatures in an ammonia atmosphere were analyzed by XRD. Besides the diffraction peaks of Ti metal phase (PDF No.44-1294), most of the diffraction peaks in Fig. 1(a) can be assigned to anatase TiO2 (PDF No. 21-1272). This implies that a lower degree of nitridation occurrs at 700 ℃. The increase in nitridation temperature to 800 ℃ results in the formation of more cubic TiN and/or TiOxNy phases (Fig. 1(b)), indicating the gradual replacement of O atoms in TiO2 with N atoms at increased temperatures. As shown in Fig. 1(c), there is a small amount of rutile TiO2 still present in the products even if the nitridation temperature is up to 900 ℃. There exists high thermodynamic and kinetic barriers to replace the strong Ti-O bands with Ti-N bonds, and thus high temperatures are required for completing the nitridation reaction. However, the nanotubes have almost collapsed when the samples are nitrided at temperatures above 900 ℃. We therefore chose 900 ℃ as the highest nitridation temperature.
图 1
图 1
XRD patterns of the nitrided products of TiO2 NTAs at different temperatures
Figure 1.
XRD patterns of the nitrided products of TiO2 NTAs at different temperatures
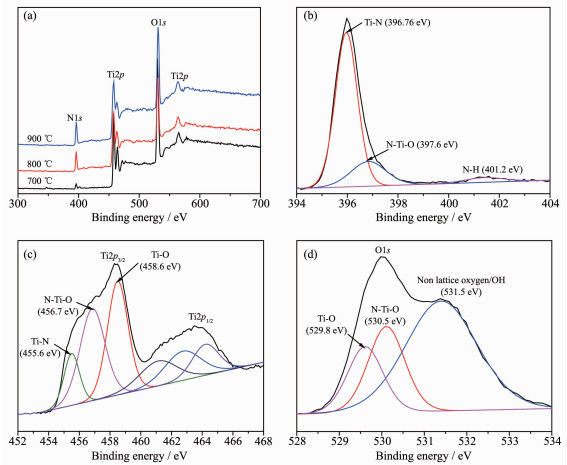
The elemental composition was checked using XPS technique. The survey scan profiles in Fig. 2(a) confirm that the nitrided products of TiO2 NTAs at various temperatures contain Ti, O and N elements. Furthermore, the data in Table 1 confirm that the N atomic ratio increases whereas the O atomic ratio decreases as the nitridation temperatures increase from 700 to 900 ℃, consistent with the XRD analyses. Deconvolution of the N1s, Ti2p and O1s core-level spectra of TiN NTAs prepared at 900 ℃ was performed, and the results are presented in Fig. 2(b~d). As shown in Fig. 2(b), N1s spectrum consists of three different components. The weakest peak at ~401 eV can be ascribed to chemisorbed NH3 gas. N1s peaks at 396.7 and 397.6 eV are assigned to β-N in the Ti-N bonds and N substituted at oxygen sites[12], respectively. The Ti2p spectrum was deconvoluted into three components: Ti-N bonding (455.6 eV corresponding to titanium nitride), N-Ti-O bonding (~456.7 eV corresponding to titanium oxynitride), and Ti-O bonding (458.6 eV corresponding to titanium dioxide)[13]. O1s peak was deconvoluted into three Gaussian curves. The lower binding energy peaks located at 529.8 and 530.5 eV are attributed to lattice oxygen in the crystal structure, whereas the high binding energy peak at 531.5 eV is assigned to oxygen vacancies or hydroxyl species[14-15].
图 2
图 2
XPS Survey spectra of the nitrided products of TiO2 NTAs at different temperatures (a), and high resolution XPS spectra of Ti2p (b), N1s (c), and O1s (d) of TiN NTAs prepared at 900 ℃
Figure 2.
XPS Survey spectra of the nitrided products of TiO2 NTAs at different temperatures (a), and high resolution XPS spectra of Ti2p (b), N1s (c), and O1s (d) of TiN NTAs prepared at 900 ℃
Note that there is a certain amount of titanium oxynitride TiOxNy component present in all three samples, which indicates a partial replacement of oxygen in TiO2 with nitrogen. However, due to the structural similarity between TiN and TiOxNy, it is difficult to distinguish these two phases by XRD pattern[16]. It is known that TiOxNy contains a wide range of oxygen vacancies and defects[17], which offers the advantage of enhancing interaction between analyte molecules and substrates, and thus contributing to the SERS effect[5].
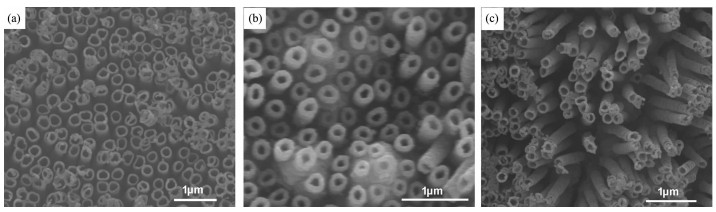
The morphologies of TiO2 and TiN NTAs prepared at different temperatures are observed in Fig. 3. The anodized TiO2 arrays grown on Ti foil exhibit wall-separated ordered tubular structures, and have relatively uniform pore size and wall thickness distributions (Fig. 3(a)). The pore sizes of the TiO2 NTAs are distributed in the range of 100~200 nm. Nitridation at elevated temperatures up to 900 ℃ results in contraction of the nanotube diameters, whereas the tubular morphology still remains, as shown in Fig. 3(c). Close observation of the nanotube walls reveals that the TiN nanotube sidewalls are highly porous, and the pore morphology undergoes evolution with nitridation temperatures. Such highly porous structure is expected to promote the adsorption of analytes as a result of increased surface area.
图 3
图 3
SEM images of TiO2 NTAs (a), nitrided products at 800 ℃ (b) and nitrided products at 900 ℃ (c)
Figure 3.
SEM images of TiO2 NTAs (a), nitrided products at 800 ℃ (b) and nitrided products at 900 ℃ (c)
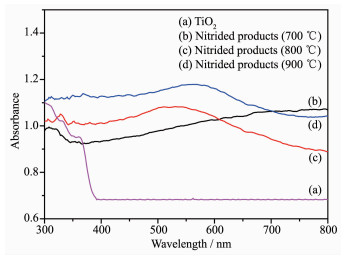
UV-Vis diffuse reflection spectra were performed to investigate the optical properties of the TiO2 and TiN NTAs prepared at different temperatures. Fig. 4(a) displays a characteristic spectrum of TiO2 NTAs with the fundamental absorbance stopping edge at ~400 nm. Nitridation at 700 ℃ extends the light absorption of TiO2 NTAs into the whole visible light range (Fig. 4(b)), which is in agreement with N-doped TiO2 NTAs[18]. It was reported that the extension of optical absorbance was ascribed to the synergetic effects of substitution of the crystal lattice oxygen by nitrogen and the existence of oxygen vacancies on the surface and interior of TiO2 NTAs[18-20]. The spectra of TiN NTAs in Fig. 4(c) and (d) exhibit absorption peaks in the wavelength range of 500~600 nm, resulting from their surface plasmon resonance effect. Furthermore, a red shift in the SPR peak is observed as the nitridation temperature increases from 800 to 900 ℃. Similar phenomenon is reported in the reference[19], where higher nitrogen content led to a red shift for TiN films.
图 4
图 4
UV-Vis diffuse reflection spectra of TiO2 NTAs and nitrided products at different temperatures
Figure 4.
UV-Vis diffuse reflection spectra of TiO2 NTAs and nitrided products at different temperatures
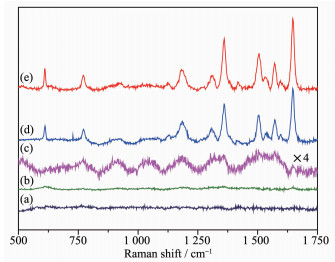
Rhodamine 6G was selected as the probe molecular to investigate the SERS performance of TiN NTAs substrates. Fig. 5 shows SERS spectra of 2.5×10⁻⁵ mol·L-1 R6G adsorbed on the samples nitrided at different temperatures and are compared with those on bare Ti sheet and TiO2 NTAs. While no Raman signals from R6G are recognized on bare Ti sheet and TiO2 NTAs, substantial Raman enhancement is observed on TiN NTAs substrates prepared at 800 and 900 ℃. The Raman peaks exhibited by these substrates correspond well with previous reports[5, 21]. It can be observed that the SERS signal intensities of R6G increase with increasing the nitridation temperatures, indicating that the SERS activity of the substrates mainly depends on the nitridation degree of the TiO2 NTAs.
图 5
图 5
Raman spectra of 2.5×10⁻⁵ mol·L-1 R6G adsorbed on Ti foil (a), TiO2 NTA (b), and the nitrided products at 700 ℃ (c), 800 ℃ (d) and 900 ℃ (e)
Figure 5.
Raman spectra of 2.5×10⁻⁵ mol·L-1 R6G adsorbed on Ti foil (a), TiO2 NTA (b), and the nitrided products at 700 ℃ (c), 800 ℃ (d) and 900 ℃ (e)
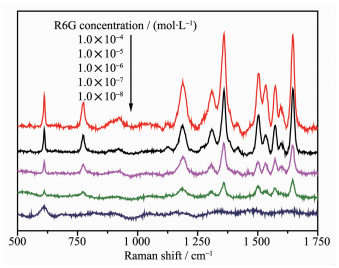
We further measured the SERS spectra as a function of the R6G concentrations and determined the detection sensitivity. The TiN NTAs prepared at 900 ℃ were immersed in a series of aqueous solutions with R6G concentration ranging from 2.5×10⁻⁴ to 2.5×10⁻⁸ mol·L-1 and their SERS spectra were recorded at an excitation wavelength of 532 nm. As expected, the Raman signal intensity of R6G gradually decreases with decreasing R6G concentrations (Fig. 6). However, all the characteristic peaks of R6G can be clearly identified at a low concentration of 2.5×10⁻⁷ mol·L-1, indicating the detection limit is in the order of 10-7 mol·L-1, which is higher than those of TiN thin films and nanorods[10-11]. The average enhancement factor (EF) for R6G was calculated according to the following equation[22]:
where ISERS and IRS represent peak intensities of the SERS spectra obtained from 2.5×10⁻⁵ mol·L-1 R6G on the TiN substrate and 2.5×10⁻² mol·L-1 R6G on a quartz substrate, respectively; NSERS and NRS are the numbers of R6G molecules excited by the laser beam on the TiN and quartz substrates, respectively. Here two Raman peaks at 612 and 1 362 cm-1 were selected for calculating the EFs, and the average EF value of the TiN NTA substrates was determined to be 2×10⁵.
Such high SERS performance of the TiN NTAs originates from synergistic combination of four effects. The major contribution to SERS enhancement is the SPR effect of the TiN component. The formation of oxygen vacancies on the surface and interior of TiN NTAs, due to substitution of the crystal lattice oxygen by nitrogen, enhances the interaction affinity between the R6G molecules and the substrates, therefore contributing to the overall SERS effect. Meanwhile, the unique tubular structure allows the incident light to undergo multiple scattering inside the small channels. The scattering folds the light path many times, causing an enhancement of the light adsorption, and making the excitation of the SPR more efficient[3]. Furthermore, the rough and highly porous tube walls of TiN NTAs facilitate the adsorption of R6G molecules, providing an additionally advantage for the SERS enhancement.
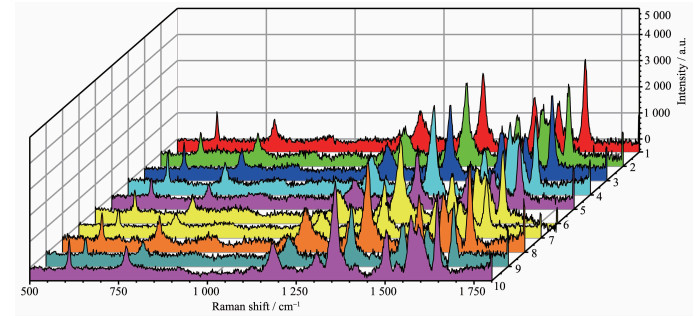
In order to examine the reproducibility of the TiN NTAs substrates, SERS spectra of 2.5×10⁻⁶ mol·L-1 R6G were collected from randomly selected 10 positions on the same substrate. As observed, these 10 SERS spectra in Fig. 7 exhibit excellent similarity. Furthermore, the relative standard deviation (RSD) of the peaks at 1 362 cm-1 was calculated to be 16.4%, revealing good uniformity and reproducibility of the TiN NTAs substrates.
图 7
图 7
SERS spectra of 10 positions in the same substrate of TiN NTAs with 2.5×10⁻⁶ mol·L-1 R6G
Figure 7.
SERS spectra of 10 positions in the same substrate of TiN NTAs with 2.5×10⁻⁶ mol·L-1 R6G
TiN NTAs were fabricated by calcining the anodized TiO2 NTAs in NH3 atmosphere above 800 ℃. The TiN NTAs exhibit wall-separated ordered tubular structures, and have relatively uniform pore size distribution ranging from 100 to 200 nm. Furthermore, the TiN nanotube walls are highly porous, which contributes to the adsorption of analytes. The SPR peaks of the TiN NTAs are in the range of 500~600 nm, and the SPR peak is red-shifted as the nitridation temperature increases from 800 to 900 ℃. The TiN NTAs exhibit strong and uniform SERS response toward R6G molecules, with an EF of ~105 and a detection limit of ~10-7 mol·L-1. Regarding the high sensitivity, good reproducibility and stability, the TiN NTAs can be considered as an alternative substrate for SERS detection.
[1]
Li X, Chen G, Yang L, et al. Adv. Funct. Mater., 2010, 20:2815-2824 doi: 10.1002/adfm.201000792
[2]
Rumaiz A K, Woicik J, Cockayne E, et al. Appl. Phys. Lett., 2009, 95:262111 doi: 10.1063/1.3272272
Figure 2
XPS Survey spectra of the nitrided products of TiO2 NTAs at different temperatures (a), and high resolution XPS spectra of Ti2p (b), N1s (c), and O1s (d) of TiN NTAs prepared at 900 ℃

 下载:
下载:

 下载:
下载:


 下载:
下载:
