
图 1
Chart of unit used to test the cracking activity of catalysts
Figure 1.
Chart of unit used to test the cracking activity of catalysts

Synthesis of Hierarchical ZSM-5 Zeolites via Two Stage Varying Temperature Crystallization with Enhanced Catalytic Cracking Performance
You-He WANG , Hong-Man SUN , Peng PENG , Peng BAI , Zi-Feng YAN , Fazle Subhan , Sheng-Fu JI


Zeolites are a class of crystalline microporous alunimosilicates which possess strong solid acidity and high hydrothermal stability. They are widely used as heterogeneous catalysts and supports in oil refining, petrochemistry, as well as environmental applica-tions[1-2]. ZSM-5 zeolite, as a fluid catalytic cracking (FCC) additive for maximizing propylene production or gasoline octane improvement, has attracted extensive attention in recent years due to its catalytic activity and shape selectivity[3-7]. However, the relative small and sole micropores in zeolite significantly influence the mass diffusion in many catalytic reactions, which limit the application of zeolite[8-10].
To overcome this problem, a series of new strategies have been developed to introduce large pores and enhance the accessibility of active sites in zeolites[11-13]. Among these strategies, one of most promising one is to synthesize the hierarchical ZSM-5, owing to the combination of shape selectivity and efficient mass transport[2, 7-13]. Currently, leaching with steam or acidic/basic chemicals is an effective way to create mesopores[14-15], however, suffers from the loss of acid sites[16]. Moreover, it is difficult to control the uniformity of mesopores[17-18]. In recent years, promising methods were developed to introduce mesopores into zeolites in a constructive way. Commonly, the synthesis of hierarchical zeolites in conventional approaches is often performed a double-template system including both mesoporous templates and zeolitic structure-directing templates[9, 13, 16]. Jacobsen et al.[19] point out hierarchical zeolites can be achieved via carbon particles and tetrapropylammonium hydroxide (TPAOH) as mesoporous template and zeolitic structure-directing template, respectively. Besides, Ryoo et al.[20] report that hierarchical ZSM-5 zeolite can be synthesized in the presence of hydrophilic [(CH3O)3SiC3H6N(CH3)2CnH2n+1]Cl. Although mesoporo-sity and catalytic performance are enhanced by these mentioned methods, both operating costs and severe experimental conditions require further consideration for industrialization[21].
Therefore, it is highly desirable to synthesize hierarchical zeolite without a secondary template[22-24], exhibiting high catalytic activity in the bulk molecular reaction. Su et al.[25-26] successfully fabricate hierar-chical interconnected micro-meso-macroporous solid-acid catalysts constructed from zeolite nanocrystals via a chemical crystallization process in a quasi solid state system using glycerin medium. However, the main drawback of this method was that expensive metal alkoxide must be used as raw materials, which would greatly increase the cost of industrialization. Yang et al.[22] report that hierarchical ZSM-5 microsphere-like particles were successfully synthesized by separate hydrolysis combined two stage varying temperature crystallization without any secondary template. However, this process was tedious due to the separate hydrolysis of raw materials. In addition, Zhang et al.[23] prepare a series of hierarchical ZSM-5 zeolites by self-assembly of in situ-formed nanocrystals via a traditional hydrothermal procedure. However, this procedure took 6 days at 180 ℃ for crystallization. Li et al.[27] manifeste that low temperature and high temperature are beneficial to nucleation and crystal growth, respectively during the synthesis of zeolites. In this study, we develop an accessible two-step hydrothermal process at low temperature aging and high temperature crystallization period to synthesize hierarchical ZSM-5 zeolites with spherical structure using TPAOH (industrial grade) as the single template, which reduces the cost of production and avoids environmental pollution caused by thermal decomposition of the organic secondary template.
The synthesis of hierarchical ZSM-5 zeolites was performed in hydrothermal condition using the two stage varying temperature technique. In the first step, silicic acid and sodium hydroxide was dissolved in distilled water under vigorous stirring followed by adding TPAOH as the single template. Then, the given amount of aluminum sulfate was added in the solution and the pH value of the whole system was adjusted to 10.8 with 2 mol·L-1 of sulfuric acid. The radio of nNa2O:nAl2O3:nSiO2:nTPAOH:nH2O of the final gel was 8:1:68:8.5:4 000. After continuously stirring for 30 min, the mixture was transferred into autoclave with Teflon-lined at 100 ℃ for 3 h.
In the second step, the cooled solution was stirred at room temperature for 30 min, and then the hydrothermal treatment was performed in autoclaves at 170 ℃ for 36 h. Eventually, the resulting solid product was recovered by filtration, washed and dried overnight and subsequently calcined at 550 ℃ for 6 h and the sample was marked as GS-2. For comparison, the sample directly crystallized at 170 ℃ for 36 h without being held at 100 ℃ for 3 h was denoted as GS-1.
X-ray diffraction (XRD) patterns at 5° to 60° were collected using PAN analytical X′Pert PRO MPD diffractometer with Cu Kα radiation (λ=0.154 1 nm). The X-ray tube was operated at 40 kV and 30 mA. Relative crystallinity was acquired by the ratio of five characteristic peaks intensity in the range of 7°~9° (7.9° and 8.8°) and 23°~25° (23.2°, 23.9° and 24.4°) of synthesized zeolites[28]. N2 adsorption-desorption isotherms were recorded at -196 ℃ using Micrometrics ASAP 2020 analyzer. The specific surface area was measured via Barrett-Emmett-Teller (BET) method in the relative pressure (P/P0) range of 0.06~0.2, and the micropore volume (Vmicro) was obtained using the t-plot method. The pore size distribution(PSD) was derived from nitrogen adsorption branch data based on the BJH method. Scanning electron microscopy (SEM) was performed using a Hitachi S4800 microscope working at 5 or 10 kV accelerating voltage. Transmission electron microscopy (TEM) micrographs were obtained using a JEOL JEM-2100UHR transmission electron microscope operating at 200 kV. Temperature-programmed desorption of ammonia (NH3-TPD) was measured in the range of 80~600 ℃ at a heating rate of 10 ℃·min-1 by the CHEMBET 3000 TPR/TPD equipment. Both pyridine absorbed fourier transform infrared spectroscopy (Py-FTIR) and collidine adsorbed fourier transform infrared spectroscopy (Coll-FTIR) were investigated by the Thermo Nicolet NEXUS spectrometer. The pre-treatment was performed at 300 ℃ for 3 h and then the adsorption of pyridine or collidine was conducted at room temperature for 24 h. After equilibrium was achieved, sample was performed at 150 ℃ for 3 h to remove physical adsorbed species. In order to further investigate the accessibility of acid sites, which is available to larger molecules, "accessi-bility index" (ACI) was calculated by the following equation[11]:
|
$ {\rm{ACI = }}{C_{{\rm{BC}}}}/{C_{{\rm{whole}}}} \approx {C_{{\rm{BC}}}}/{C_{{\rm{BP}}}} $ |
Where CBC represents the amount of collidine adsorbed on Br∅nsted acid sites, Cwhole represent the amount of Br∅nsted acid sites obtained by Py-FTIR and CBP represents the amount of pyridine adsorbed on Br∅nsted acid sites; Cwhole approximately equals to CBP.
The H-ZSM-5 zeolites were prepared by three consecutive ion-exchanges in aqueous ammonium chloride solution and then calcined. The detailed preparation method of catalytic cracking catalyst is as follows: H-ZSM-5, kaolin and binder (pseudo-boehmite) at a mass ratio of 50:35:15 were added into amount of deionized water, after the completely dissolved under continuous stirring, the solvent was removed by evaporation to dryness at 100 ℃. Then, the products were calcined at 700 ℃ for 2 h and sieved through 80~100 mesh. Finally, the samples were treated at 800 ℃ under atmospheric pressure in 100% water vapor for 4 h prior to catalytic evaluation.
The operation process of catalytic cracking evaluation is shown in Fig. 1. 1.0 g oil and 4.0 g catalyst were utilized at 550 ℃. The yield was calcul-ated by following equation[29]:
|
$ Y = m/{m_{{\rm{total}}}} \times 100\% $ |
m and mtotal represent the mass of product and total mass in the feed, respectively.
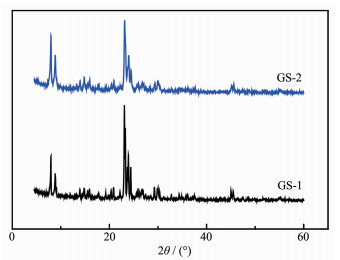
XRD patterns of all synthesized samples are shown in Fig. 2. All the samples exhibit two diffraction peaks ranging from 7° to 9° and three characteristic peaks in the range of 23°~25° which were all identified as the characteristic peaks of ZSM-5 zeolites (PDF No.01-085-1208). As shown in Table 1, GS-1 exhibits a higher relative crystallinity (100%) than GS-2 (86%), because GS-1 was directly crystallized at 170 ℃, which is more suitable for the crystal growth of ZSM-5 zeolite. It is also indicated that the first stage of GS-2 at 100 ℃ for 3 h plays an important role in the fast nucleation caused by the interaction between TPA+ and aluminosilicate materials[27].

 下载:
导出CSV
下载:
导出CSV
| Samples | R.C.a/% | SBETb/ (m2·g-1) |
Smicroc/ (m2·g-1) |
Smesod/(m2·g-1) | Vtatale/(cm3·g-1) | Vmicrof/ (cm3·g-1) |
Vmesog/ (cm3·g-1) |
| GS-1 | 100 | 328 | 252 | 76 | 0.B85 | 0.133 | 0.052 |
| GS-2 | 86 | 356 | 193 | 163 | 0.247 | 0.103 | 0.144 |
| aRelative crystallinity calculated by XRD; bBET surface areas; cMicropore surface areas calculated by t-plot method; dMesopore surface areas equal to SBET minus Smicro; eTotal pore volume measured at a relative pressure (P/P0) of 0.99; ft-plot micropore volume; gBJH adsorption cumulative volume. | |||||||
N2 adsorption-desorption isotherms was utilised to investigate the porous structure of the synthesized zeolites, with the isotherms and corresponding BJH pore size distribution (PSD) shown in Fig. 3. GS-1 displays the characteristic type Ⅰ isotherm, revealing the microporous nature (Fig. 3A). However, in the case of GS-2, the isotherm changes to type Ⅳ with a significant H3 hysteresis loops after relative pressure (P/P0) of 0.42, indicating the formation of mesopores. The PSD curves calculated from BJH adsorption branch as shown in Fig. 3B manifests the formation of abundant mesopores ranging from 6 to 30 nm in the GS-2 using two stage varying temperature technique, attributing to the accumulation of the small crystal particles.
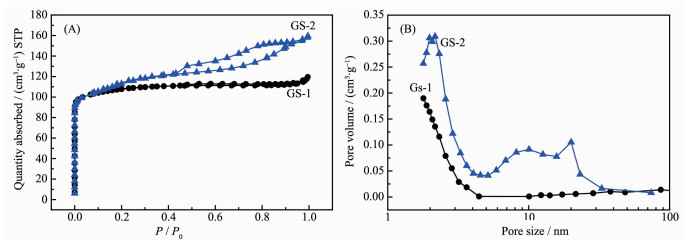
The textural properties summarized in Table 1 also indicate the mesopore surface area and pore volume of GS-2 are increased compared with GS-1. Even though only using a single template, two stage varying temperature technique is critical to synthesis hierarchical ZSM-5. The formation of the developed mesopores could enhance catalytic cracking performance.
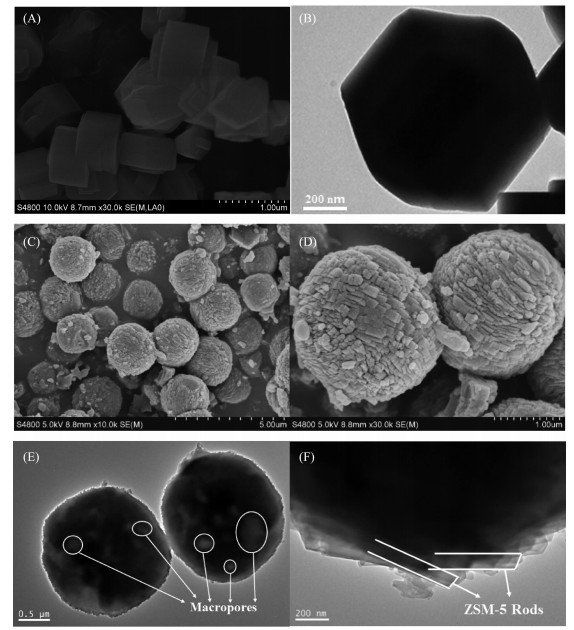
SEM micrographs of the synthesized samples are presented in Fig. 4. The morphology of GS-1 is rectan-gular or hexagonal particulates with the relatively flat surface as shown in Fig. 4(A, B). However, GS-2 possess a spherical structure with the particle size around 2 μm in diameter (Fig. 4(C, D)), which can reduce surface energy of particles with maximum limitation[30]. Accor-ding to the higher resolution image of the sample, it is obvious that the polycrystalline zeolite rods aggregate together to form small particles, which provide higher surface area as well as three-dimensionally connected mesoporous network. This indicates the formation of intercrystalline mesopores caused by the stack of nanocrystals, which is consistent with N2 sorption analysis results. TEM images in Fig. 4(E, F) further evidence the formation of meso-and macropores in the zeolite particles with spherical structure corres-ponding with the enhanced textural properties in Table 1. On the edge of the spherical zeolite, it is noteworthy that the whole structure was formed by the aggregation of many bar-shaped nanocrystals which generate the intercrystalline meso-and macropores. The possible assembly mechanism of the hierarchical ZSM-5 zeolites with spherical structure is as follow: First, the aluminosilicate materials experience a fast nucleation process with the induction effect of TPA+ at the low temperature aging stage[27], while many crystal nuclei first appeared in the silica gel after the aging process. Then, with the consumption of aluminosili-cate materials, the crystal nucleus grew gradually to become nanocrystalline under the high temperature crystallization process. Finally, the aggregated nanocr-ystalline continued to grow up and self-assemble into regular spherical structure in order to reduce the surface free energy[16], while the aluminosilicate materials continue to be consumed.
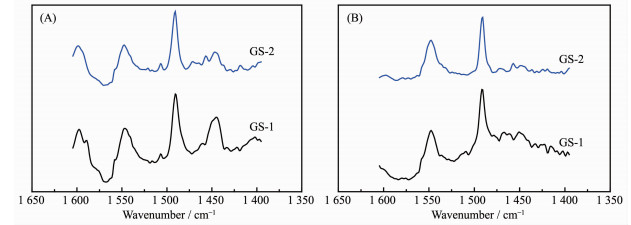
The pyridine absorbed FT-IR was performed to study the acidity of the synthesized zeolites[31], which is critical important in practical application. Three characteristic bands of pyridine adsorption are observed in Fig. 5. The vibration bands at 1 445 and 1 547 cm-1 are assigned to the adsorption of pyridine on Lewis and Br∅nsted acid sites, respectively. The band at 1 490 cm-1 is corresponded to adsorption of pyridine on both Br∅nsted and Lewis acid sites[21]. The detailed information of acidic properties is summa-rized in Table 2. The quantity of Br∅nsted acid sites of GS-1 (0.026 4 mmol·g-1) is more than that of GS-2 (0.015 6 mmol·g-1), attributing to the higher relative crystallinity of GS-1. But the Br∅nsted acid to Lewis acid ratio (CBP/CLP) exhibits a sharp increase from 3.181 (GS-1) to 5.778 (GS-2), which is beneficial to the catalytic cracking reaction. Coll-FTIR test and ACI calculation[11, 21] are introduced to investigate the accessibility of acid sites. Compared to the molecular diameter of 0.54 nm in conventional ZSM-5, collidine exhibits a strong steric effect due to the large molecular diameter of 0.74 nm[11]. Therefore, it is used as probe molecule to verify the availability of acid sites in larger pores. As shown in Table 2, the absorbance for Py-and Coll-FTIR in GS-1 are 0.007 1 and 0.026 4 mmol·g-1, respectively. Therefore, ACI value is 0.269. These parameters indicate that most of the collidine is adsorbed on the external surface of GS-1 due to the microporous structure. As for GS-2, the concentration of Br∅nsted acid sites detected by collidine adsorption FT-IR is increased due to the formation of meso-and macropores[21], and the ACI value exhibit a dramatic increase from 0.269 to 0.609.
下载:
导出CSV
| Sample | CBP/(mmol.g-1) | CLPa/(mmol · g-1) | CBP/CLP | CBC/(mmol.g-1) | ACI |
| GS-1 | 0.026 4 | 0.008 3 | 3.181 | 0.007 1 | 0.269 |
| GS-2 | 0.015 6 | 0.002 7 | 5.778 | 0.009 5 | 0.609 |
| aCLP represents the amount of pyridine adsorbed on Lewis acid sites. | |||||
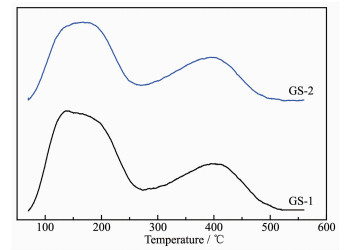
Ammonia temperature-programmed desorption (NH3-TPD) was conducted to investigate acid sites on the surface of synthesized samples. As showed in Fig. 6, two samples all have two principal desorption peaks in NH3 spectrum at about 170 and 410 ℃ in the temperature range of 80~600 ℃, corresponding to weak and strong acid sites respectively. The acidity and acid distribution summarized in Table 3 indicates the quantity of strong acid sites of GS-1 (5.434 mmol·g-1) is more than that of GS-2 (2.689 mmol·g-1). How-ever, the strong acid to weak acid ratio (Cs/Cw) of samples exhibits an increase from 0.436 (GS-1) to 0.520 (GS-2). It is obvious that the amount of strong acid sites in GS-2 is higher than that of GS-1, which is also beneficial to the catalytic cracking reaction.
下载:
导出CSV
| Sample | Cwa/(mmol · g-1) | Csb/(mmol · g-1) | (Cw+Cs)/(mmol · g-1) | CsCw |
| GS-1 | 5.434 | 2.371 | 7.811 | 0.436 |
| GS-2 | 2.689 | 1.399 | 4.088 | 0.520 |
| aNH3 adsorption capacity on weaker acid sites; bNH3 adsorption capacity on strong acid sites. | ||||
Table 4 demonstrates the catalytic cracking performance of synthesized catalysts using n-heptane as model compounds. It is obvious that the gaseous products are mainly C3~C4 component accounting for 70%. This phenomenon is attributed to the middle of the carbon chain is easily attracted by the proton of catalyst and then forms pentacoordinate carbonium ion. This carbonium ion can split into C-C-C+ and butane or C-C-C-C+ and propane. Then C-C-C+ and C-C-C-C+ can form propylene and butane after a proton desorption, respectively. Interestingly, the ethylene yield and propylene yield of GS-2-contained cracking catalyst are up to 1.293% and 3.751%, respectively, Besides, GS-2-contained cracking catalyst shows superior conversion (18.08%) compared with GS-1-contained catalyst. The outstanding performance of GS-2 can be ascribed to the introduction of intercrystalline meso-and macropores via two stage synthesis method. The introduced intercrystalline meso-and macropores can reduce the diffusional limitation and improve the accessibility of the active sites situated inside the micropores of ZSM-5 zeolite.
下载:
导出CSV
| Product | Y/% | |
| GS-1 catalyst | GS-2 catalyst | |
| H2 | 0.003 | 0.003 |
| C10 | 0.251 | 0.436 |
| C20 | 1.034 | 1.587 |
| C2= | 0.815 | 1.293 |
| C30 | 1.075 | 1.630 |
| C3= | 2.753 | 3.751 |
| C40 | 0.993 | 1.019 |
| (i-butane) | 0.214 | 0.295 |
| C4= | 2.060 | 2.196 |
| C50 | 1.013 | 0.892 |
| C5= | 0.408 | 0.422 |
| Conversion/% | 13.95 | 18.08 |
A facile two stage varying temperature hydro-thermal process at low temperature aging and high temperature crystallization period has been developed to synthesize hierarchical ZSM-5 zeolites at the presence of single template, where no secondary template or additives were added. During the high temperature hydrothermal crystallization period, zeolite nanocrystals were spontaneously self-assembled into uniform microspheres around 2 μm in size. The obtained ZSM-5 zeolite possesses intercrystalline meso-and macropores generated from the aggregation of bar-shape ZSM-5 nanocrystals. Compared to the one stage synthesized ZSM-5-contained catalyst, the two stage synthesized hierarchical ZSM-5-contained catalytic cracking catalyst shows enhanced propylene yield and conversion, which can be ascribed to the enhanced accessibility of the active sites due to its well-connected network of intercrystalline meso-and macropores.
Cundy C S, Cox P A. Chem. Rev., 2003, 103:663-702 doi: 10.1021/cr020060i
Sun M H, Huang S Z, Chen L H, et al. Chem. Soc. Rev., 2016, 45(12):3479-3563 doi: 10.1039/C6CS00135A
高禾鑫, 李鹏, 杜艳泽, 等.无机化学学报, 2017, 33(7):1249-1256 http://www.wjhxxb.cn/wjhxxbcn/ch/reader/view_abstract.aspx?flag=1&file_no=20170718&journal_id=wjhxxbcnGAO He-Xin, LI Peng, DU Yan-Ze, et al. Chinese J. Inorg. Chem., 2017, 33(7):1249-1256 http://www.wjhxxb.cn/wjhxxbcn/ch/reader/view_abstract.aspx?flag=1&file_no=20170718&journal_id=wjhxxbcn
陈艳红, 崔红霞, 韩东敏, 等.无机化学学报, 2018, 34(3):461-466 doi: 10.11862/CJIC.2018.049CHEN Yan-Hong, CUI Hong-Xia, HAN Dong-Min, et al. Chinese J. Inorg. Chem., 2018, 34(3):461-466 doi: 10.11862/CJIC.2018.049
Degnan T F, Chitnis G K, Schipper P H. Microporous Mesoporous Mater., 2000, 35-36:245-252 doi: 10.1016/S1387-1811(99)00225-5
Primo A, Garcia H. Chem. Soc. Rev., 2014, 43:7548-7561 doi: 10.1039/C3CS60394F
Vogt E T C, Weckhuysen B M. Chem. Soc. Rev., 2015, 44:7342-7370 doi: 10.1039/C5CS00376H
Pérez-Ramírez J, Christensen C H, Egeblad K, et al. Chem. Soc. Rev., 2008, 37:2530-2542 doi: 10.1039/b809030k
Meng X J, Nawaz F, Xiao F S. Nano Today, 2009, 4:292-301 doi: 10.1016/j.nantod.2009.06.002
Shi J, Wang Y D, Yang W M, et al. Chem. Soc. Rev., 2015, 44:8877-8903 doi: 10.1039/C5CS00626K
Thibault-Starzyk F, Stan I, Abelló S, et al. J. Catal., 2009, 264(1):11-14 doi: 10.1016/j.jcat.2009.03.006
Wei Y, Parmentier T E, Jong K P, et al. Chem. Soc. Rev., 2015, 44:7234-7261 doi: 10.1039/C5CS00155B
Schwieger W, Machoke A G, Weissenberger T, et al. Chem. Soc. Rev., 2016, 45:3353-3376 doi: 10.1039/C5CS00599J
Jin L J, Zhou X J, Hu H Q, et al. Catal. Commun., 2008, 10:336-340 doi: 10.1016/j.catcom.2008.09.024
Gopalakrishnan S, Zampieri A, Schwieger W. J. Catal., 2008, 260:193-197 doi: 10.1016/j.jcat.2008.09.002
Bai P, Wu P P, Xing W, et al. J. Mater. Chem. A, 2015, 3:18586-18597 doi: 10.1039/C5TA05350A
Tao Y S, Kanoh H, Abrams L, et al. Chem. Rev., 2006, 106:896-910 doi: 10.1021/cr040204o
Donk S V, Janssen A H, Bitter J H, et al. Catal. Rev., 2003, 45:297-319 doi: 10.1081/CR-120023908
Jacobsen C J, Madsen C, Houzvicka J, et al. J. Am. Chem. Soc., 2000, 122:7116-7117 doi: 10.1021/ja000744c
Choi M, Cho H S, Srivastava R, et al. Nat. Mater., 2006, 5:718-723 doi: 10.1038/nmat1705
Sun H M, Peng P, Wang Y H, et al. J. Porous Mater., 2017, 24(6):1513-1525 doi: 10.1007/s10934-017-0391-4
Yang J H, Yu S X, Hu H Y, et al. Chem. Eng. J., 2011, 166:1083-1089 doi: 10.1016/j.cej.2010.11.071
Zhang H Y, Wang G S, Zheng J J, et al. Chem. Lett., 2016, 45:481-483 doi: 10.1246/cl.160010
Zhou D, Zhang T J, Xia Q H, et al. Chem. Sci., 2016, 7:4966-4972 doi: 10.1039/C6SC01735E
Yang X Y, Tian G, Chen L H, et al. Chem.-Eur. J., 2011, 17:14987-14995 doi: 10.1002/chem.201101594
Sun M H, Chen L H, Li X Y, et al. Microporous Mesoporous Mater., 2013, 182:122-135 doi: 10.1016/j.micromeso.2013.08.034
Li Q, Creaser D, Sterte J. Microporous Mesoporous Mater., 1999, 31(1/2):141-150
Zhao L, Xu C M, Gao S, et al. J. Mater. Sci., 2010, 45:5406-5411 doi: 10.1007/s10853-010-4593-2
Arandes J M, Torre I, Azkoiti M J, et al. Energy Fuels, 2009, 23:4215-4223 doi: 10.1021/ef9002632
Chen X Y, Qiao M H, Xie S H, et al. J. Am. Chem. Soc., 2007, 129:13305-13312 doi: 10.1021/ja074834u
Emeis C A. J. Catal., 1993, 141:347-354 doi: 10.1006/jcat.1993.1145

Figure 1 Chart of unit used to test the cracking activity of catalysts
(1) Cut off valve; (2) Pressure stabilization valve; (3) Flow valve; (4) Four-way valve; (5) Reactor; (6) Ice bath; (7) Gas collection system; (8) Storage water tank; (9) Liquid collection bottle; KV1-7 are switch valves; PI 1 is a piezometer

Figure 5 FT-IR spectra of GS-1 and GS-2
(A) Pyridine adsorption; (B) Collidine adsorption
Table 1. Textural properties and relative crystallinity of samples
| Samples | R.C.a/% | SBETb/ (m2·g-1) |
Smicroc/ (m2·g-1) |
Smesod/(m2·g-1) | Vtatale/(cm3·g-1) | Vmicrof/ (cm3·g-1) |
Vmesog/ (cm3·g-1) |
| GS-1 | 100 | 328 | 252 | 76 | 0.B85 | 0.133 | 0.052 |
| GS-2 | 86 | 356 | 193 | 163 | 0.247 | 0.103 | 0.144 |
| aRelative crystallinity calculated by XRD; bBET surface areas; cMicropore surface areas calculated by t-plot method; dMesopore surface areas equal to SBET minus Smicro; eTotal pore volume measured at a relative pressure (P/P0) of 0.99; ft-plot micropore volume; gBJH adsorption cumulative volume. | |||||||
 下载: 导出CSV
Table 2. Total acidity, acid distribution and acid site accessibility of GS-1 and GS-2
| Sample | CBP/(mmol.g-1) | CLPa/(mmol · g-1) | CBP/CLP | CBC/(mmol.g-1) | ACI |
| GS-1 | 0.026 4 | 0.008 3 | 3.181 | 0.007 1 | 0.269 |
| GS-2 | 0.015 6 | 0.002 7 | 5.778 | 0.009 5 | 0.609 |
| aCLP represents the amount of pyridine adsorbed on Lewis acid sites. | |||||
下载: 导出CSV
Table 3. Acidity and acid distribution of GS-1 and GS-2
| Sample | Cwa/(mmol · g-1) | Csb/(mmol · g-1) | (Cw+Cs)/(mmol · g-1) | CsCw |
| GS-1 | 5.434 | 2.371 | 7.811 | 0.436 |
| GS-2 | 2.689 | 1.399 | 4.088 | 0.520 |
| aNH3 adsorption capacity on weaker acid sites; bNH3 adsorption capacity on strong acid sites. | ||||
下载: 导出CSV
Table 4. Comparison of gas phase cracking results of n-heptane over catalysts
| Product | Y/% | |
| GS-1 catalyst | GS-2 catalyst | |
| H2 | 0.003 | 0.003 |
| C10 | 0.251 | 0.436 |
| C20 | 1.034 | 1.587 |
| C2= | 0.815 | 1.293 |
| C30 | 1.075 | 1.630 |
| C3= | 2.753 | 3.751 |
| C40 | 0.993 | 1.019 |
| (i-butane) | 0.214 | 0.295 |
| C4= | 2.060 | 2.196 |
| C50 | 1.013 | 0.892 |
| C5= | 0.408 | 0.422 |
| Conversion/% | 13.95 | 18.08 |
下载: 导出CSV

 扫一扫看文章


扫一扫关注我们


 下载:
下载: