表 1
Crystallographic data for complexes 1 and 2
Table 1.
Crystallographic data for complexes 1 and 2

The coordination polymers formed by the self-assembly of metal ions and organic ligands are an important branch of supramolecular chemistry. Comp-lexes have unique structure and properties, and they have potential application value in many fields, such as magnetic[1-2], optical materials[2-6], catalysis[7-8], biochemistry[9-10], host and guest chemistry[11], gas adsorption and separation[12-16], biopharmaceutical[17-18]. The novel structure of the coordination polymers is mainly reflected in the design and synthesis of novel organic ligands according to their own needs, so that it can coordinate with the geometrical configuration of the central metal ions to construct a variety of structures.
These coordination polymers constructed by organic carboxylic acid ligands have already attracted much interest in research, mainly because the carboxyl groups not only have a variety of flexible coordination modes, but also combine with metal ions to form multinuclear metals ion complexes or secondary units (SBUs)[19], which in turn makes the structure more novel and the topology more unique. In addition, due to the carboxyl groups being partially or fully deprotonated, it can be used as a donor or acceptor of hydrogen bonds to participate in the self-assembly of supramolecules in a synergistic coordination bond or metal bond.
Thiadiazol is a class of important heterocyclic compounds containing N, S atoms. When forming complexes with metal ions, the electron-rich hetero-cycles are easy to form hydrogen bonds and π-π aromatic ring stacking, which makes the structure of the polymer richer. Therefore, such polymers have a variety of biological activities and can be widely used in pesticides and pharmaceuticals fields. On the other hand, zinc is the second most abundant trace metal element in the body, and plays an important role in the life process[26-27]. Thus, it is of great value to study the coordination and properties of zinc and thiadiazol organic ligands, and to understand the behavior and mechanism of drug action in life system.
So far, there have been extensive reported on the wide range of biological activities of 1, 3, 4-thiadiazol compounds and 1, 2, 3-thiadiazol compounds. However, 1, 2, 3-thiadiazol complexes have been relatively few studied and reported, especially for its biological activity reported less. In this paper, we used 4-methyl-1, 2, 3-thiadiazol-5-carboxylic acid and bpp, phen respectively to design and synthesize two zinc(Ⅱ) complexes. The interaction of ligand and complexes with DNA was determined by the ethidium bromide fluorescent probe.
All reagents and solvents employed were commercially available and used without further purification. Elemental analyses of C, H, N were performed on elemental analyzer, Elementar Vario EL Ⅲ. FTIR spectra were recorded on a Nicolet NEXUS 670 FTIR spectrophotometer using KBr discs in the range of 4 000~400 cm-1. Crystallographic data of the polymers were collected on a Bruker Smart Apex Ⅱ CCD diffractometer. A Mettler Toledo thermal analyzer TGA/SDTA 851e was used to carry out the thermoa-nalytical analysis with a heating rate of 10 ℃·min-1 from 30 to 800 ℃ in air atmosphere. Powder X-ray diffraction (PXRD) data were collected on a PW 3040/60 Focus X-Ray diffractometer using Cu Kα radiation(λ=0.154 06 nm, U=40 kV, I=40 mA, 2θ=10°~30°). Fluorescence spectra were measured at room tempera-ture with an Edinburgh FL-FS920 TCSPC system.
A mixture of HMTC (1 mmol, 0.144 g), NaOH (1.0 mmol, 0.040 g), ZnSO4·7H2O (0.5 mmol, 0.144 g), bpp (0.5 mmol, 0.095 g) and EtOH(5 mL)/H2O(10 mL) was put into a 50 mL vessel and stirred for 12 h at room temperature. The resulted solution was allowed to evaporation at room temperature for two weeks. Buff crystals suitable for single-crystal analysis and physical measurements were obtained, washed with distilled water, and dried in air. Yield: 45% (based on HMTC). Anal. Calcd. for C21H20N6O4S2Zn(%): C 45.78, H 3.61, N, 15.21; Found(%): C 45.89, H 3.64, N 15.27. IR(KBr, cm-1): 2 951(w), 2 927(w), 1 635(s), 1 623(s), 1 509(m), 1 433(m), 796(s), 786(s).
The synthetic method is the same as 1, just replacing bpp with phen. Colorless crystals suitable for single-crystal analysis and physical measurements were obtained, washed with distilled water, and dried in air. Yield: 76% (based on HMTC). Anal. Calcd. for C20H18N6O6S2Zn(%): C 42.30, H 3.19, N 14.80; Found(%): C 42.22, H 3.16, N 14.87. IR(KBr, cm-1): 3 270(w), 1 628(s), 1 582(m), 1 519(s), 1 385(s), 1 212(s), 1 148(m), 1 103(m), 848(s), 783(m), 726(s), 581(m).
The single crystals of the two complexes with approximate dimensions (0.202 mm×0.121 mm×0.098 mm, 1; 0.360 mm×0.150 mm×0.100 mm, 2) were selected and mounted on a Bruker Smart Apex Ⅱ CCD diffractometer. The diffraction data were collected using a graphite monochromated Mo Kα radiation (λ=0.071 073 nm) at 296(2) K. Absorption corrections were applied using SADABS[28]. The correction for Lp factors was applied. The structure was solved by using the SHELXS-97[29] program package and refined with the full-matrix least-squares technique based on F2 using the SHELXL-97[30] program package. Hydrogen atoms on water molecules were located in a difference Fourier map and included in the subsequent refinement using restrains (dO-H=0.085 nm, dH…H=0.130 nm) with Uiso(H)=1.5 Ueq(O). Other hydrogen atoms were added theoretically. Detail information about the crystal data is summarized in Table 1, and the selected bond lengths and angles are given in Table 2 and 3. All hydrogen bonds are given in Table 4.
 下载:
导出CSV
下载:
导出CSV
| Complex | 1 | 2 |
| Empirical formula | C21H20N6O4S2Zn | C20H18N6O6S2Zn |
| Formula weight | 549.92 | 567.89 |
| Crystal system | Monoclinic | Triclinic |
| Space group | P21/c | P1 |
| a/nm | 1.018 49(2) | 0.722 36(4) |
| b/nm | 2.101 26(4) | 1.199 32(7) |
| c/nm | 1.108 22(2) | 1.422 10(8) |
| α/(°) | 66.431(3) | |
| β/(°) | 99.251 0(1) | 80.379(3) |
| γ/(°) | 86.721(4) | |
| V/nm3 | 2.340 87(8) | 1.113 30(11) |
| Z | 4 | 2 |
| Dc/(g·cm-3) | 1.560 | 1.694 |
| Absorption coefficient/mm-1 | 1.269 | 1.343 |
| F(000) | 1 128 | 580 |
| Reflection collected | 21 717 | 15 830 |
| Unique reflection | 5 352 | 3 920 |
| θ range/(°) | 2.70~27.50 | 1.58~25.00 |
| R1, wR2 [I>2σ(I)] | 0.030 1, 0.079 1 | 0.048 2, 0.132 3 |
| R1, wR2 (all data) | 0.040 6, 0.084 9 | 0.060 2, 0.139 8 |
| Goodness-of-fit (on F2 | 1.019 | 1.038 |
| (Δρ)max, (Δρ)min/(e·nm-3) | 310, -300 | 1 104, -379 |
下载:
导出CSV
| Zn1-O4 | 0.196 28(15) | Zn1-O2 | 0.198 63(13) | Zn1-N2 | 0.202 47(16) |
| Zn1-N1i | 0.203 57(17) | ||||
| O4-Zn1-O2 | 104.18(6) | O2-Zn1-N2 | 105.73(6) | O4-Zn1-N2 | 109.04(6) |
| O4-Zn1-N1i | 109.64(6) | O2-Zn1-N1i | 106.69(6) | N2-Zn1-N1i | 120.29(6) |
| Symmetry codes: i-x, -0.5+y, -0.5-z. | |||||
下载:
导出CSV
| Zn1-O2W | 0.197 0(2) | Zn1-O1W | 0.201 3(2) | Zn1-O1 | 0.202 2(2) | |
| Zn1-N5 | 0.217 0(3) | Zn1-N6 | 0.212 5(3) | |||
| O2W-Zn1-O1W | 110.04(11) | O2W-Zn1-O1 | 96.03(11) | O1W-Zn1-O1 | 95.37(11) | |
| O2W-Zn1-N6 | 113.98(12) | O2W-Zn1-N5 | 96.23(11) | O1W-Zn1-N6 | 135.38(11) | |
| O1-Zn1-N6 | 87.12(11) | N6-Zn1-N5 | 77.27(11) | O1W-Zn1-N5 | 91.31(10) | |
| O1-Zn1-N5 | 163.09(11) |
下载:
导出CSV
| D-H…A | d(D-H)/nm | d(H…A)/nm | d(D…A)/nm | ∠DHA/(°) |
| O1W-H1WA…O2i | 0.085 | 0.187 | 0.269 9(3) | 163.8 |
| O1W-H1WB…O3ii | 0.085 | 0.201 | 0.280 4(3) | 156.3 |
| O2W-H2WA…O4iii | 0.085 | 0.179 | 0.260 0(4) | 158.6 |
| O2W-H2WB…O3 | 0.085 | 0.189 | 0.272 3(4) | 167.1 |
| Symmetry codes: i-x, 1-y, -z; ii-1+x, y, z; iii1-x, 1-y, -z. | ||||
CCDC: 1564691, 1; 1564890, 2.
The interactions of the HMTC ligand and complexes with calf thymus DNA were studied by ethidium bromide fluorescent probe. The experiment was carried out by adding different volumes of compound solution to 10 mL colorimetric tube prepared 2 h in advance, which contained 1.0 mL 200 μg·mL-1 ct-DNA, 1.0 mL 200 μg·mL-1 EB and 2.0 mL Tris-HCl buffer solution (pH=7.4). And then different amounts of HMTC ligand and complexes solution (0.1 mmol·L-1) were diluted with distilled water to the scale. The reactions were carried out for 12 h at 4 ℃. The fluorescence spectra of the composite system were scanned in the wavelength range of 520~700 nm with 251 nm as the excitation wavelength.
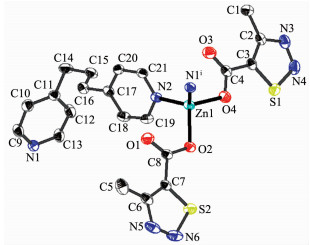
Single-crystal analysis shows the complex 1 crystallizes in the monoclinic space group P21/c and Z=4. As shown in Fig. 1, each asymmetric unit consists of one Zn2+, two MTC- ligands, one bpp ligand. The Zn(Ⅱ) exhibits distorted four-coordinated geometry by considering short-range atomic interactions. Each Zn(Ⅱ) ion is four-coordinated with two O atoms from two ligands (O2, O4) and two N atoms from bpp ligands (N2, N1i). The distance of Zn-O is respectively 0.198 63(13) and 0.196 28(15) nm, and Zn-N is respectively 0.202 47(16) and 0.203 57(17) nm, according with the distance of Zn-O and Zn-N in the literature[31-32].
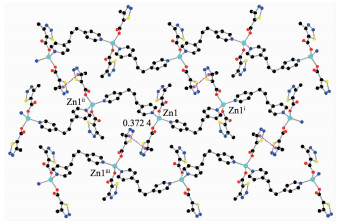
The auxiliary ligand bpp acts as a bridge and forms a 1D fishbone chain structure along the b axis direction. There is no typical hydrogen bond because of no hydrogen bond donor in the complex 1. As show in Fig. 2, there are many thiadiazol rings in the complex, and the centroid distance between the adjacent thiadiazol rings is 0.372 4 nm. It indicates that there are obviously face to face π-π stacking interacting between 1D chains. Finally, the π-π stacking interactions between thiadiazol rings made the 1D chain deposit into a 2D network.
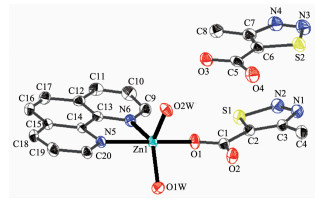
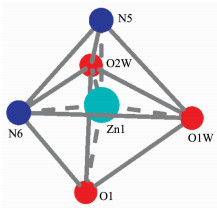
Single-crystal analysis shows the complex 2 crystallizes in the triclinic space group P1 and Z=2. As illustrated in Fig. 3, the asymmetric unit of complex 2 contains one Zn2+, one MTC- ligand, one phen ligand, two coordination water molecules and one free MTC- ligand. Each Zn(Ⅱ) ion adopts five-coordinated mode with a distorted trigonal bipyramid geometry by considering short-range atomic interac-tions. As shown in Fig. 4, each Zn(Ⅱ) ion is five-coordinated with one O atom from one MTC- ligand (O1), two N atoms from one phen ligand (N5, N6) and two O atoms from two coordination water molecules. The distance of Zn-O is in the range of 0.197 0(2)~0.202 2(2) nm, and Zn-N is respectively 0.217 0(3) and 0.212 5(3) nm, according with the distance of Zn-O and Zn-N in the literature[33].
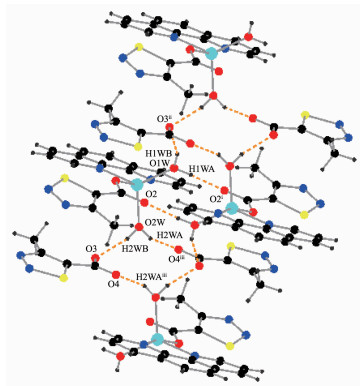
As show in Fig. 5, in the complex 2, there are abundant hydrogen bonds in the molecule, the O1W, O2W, act as hydrogen donors, contributing hydrogen atoms (H1WA, H1WB, H2WA and H2WB) to O2i, O3iii, O3, O4ii forming the hydrogen bonds. The bond length ranges from 0.179 to 0.283 nm. In addition, phen is almost coplanar with thiadiazol formic acid ligands and the free MTC- is located in the grooves formed by two adjacent units. There is obviously π-π stacking between the same structural units and adjacent structural units involved in the coordination of the MTC-. The center distances between the same structural units and adjacent structural units are 0.369 7 and 0.357 2 nm, respectively. The 2D layered structure is formed by the interaction of π-π and hydrogen bonding (Fig. 6).

In the IR spectrum of complex 1, the asymmetric and symmetric stretching of COO- appear at 1 622 cm-1 (ν(OCO)asym) and 1 433 cm-1 (ν(OCO)sym), respec-tively, showing the presence of monodentate carboxy-late linkage. Besides, the peak at (750~800) cm-1 is the C-H stretching vibration of the pyridine hetero-cycle, indicating the presence of the pyridine hetero-cycle. So is the complex 2, the asymmetric and symmetric stretching of COO- appear at 1 627 cm-1 (ν(OCO)asym) and 1 384 cm-1 (ν(OCO)sym) respectively, showing the presence of monodentate carboxylate linkage. There are two strong peaks near 3 269 cm-1 (ν(O-H)) and 580 cm-1 (δ(O-H)), which corresponds to presence of coordinated water molecules. Two bands occurring at 1 582 cm-1 (ν(C=N)), 848 cm-1 (δ(O-H)) show the coordination of nitrogen atoms from phen.
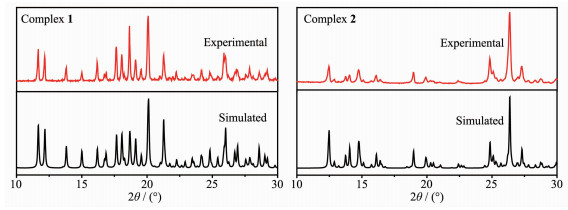
In order to confirm the phase purity of the complexes, PXRD tests were carried out on complexes 1 and 2 room temperature. As shown in Fig. 7, the positions of the experimental PXRD peaks and the simulated peak positions are almost identical. This shows that the crystal purity of the complex is quite well.
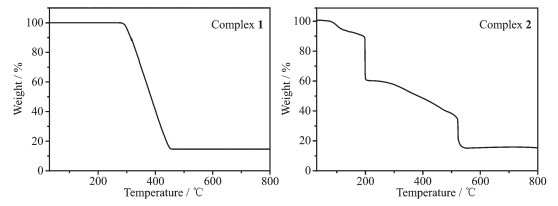
The TG curves of the title complexes are shown in Fig. 8. The TG curve shows that complex 1 is thermally stable up to about 271 ℃, indicating there is no solvent molecules in the complex 1. The weight loss in the range of 271~458 ℃ corresponds to the decomposition of two ligands and three bpp molecules, then, the residue weight of 14.65% corresponds to the ZnO (Calcd. 14.80%). The decomposition process of complex 2 is roughly divided into two stages. The first stage occurs with weight loss of 6.29% between 90 and 120 ℃, corresponding to the loss of two water molecules (Calcd. 6.34%). The second stage occurs with weight loss of 79.26% between 120 and 523 ℃, corresponding to the loss of a phen molecule (Calcd. 31.73%) and two thiadiazol molecules (Calcd. 49.35%); the final residue weight of 14.45% corresponds to ZnO (Calcd. 14.33 %).
The effects of the HMTC ligand and complexes on the fluorescence spectra of EB-DNA system are presented in Fig. 9. As concentrations of the compounds increasing, the emission intensity at 592 cm of EB-DNA system decreased in different degrees, indicating that some EB molecules are released into solution after the exchange with the compounds which resulted in the fluorescence quenching of EB. The quenching of EB bound to DNA by the compounds is in agreement with the linear Stern-Volmer equation: I0/I=1+Ksqr[34], where I0 and I represent the fluorescence intensities in the absence and presence of quencher, respectively. Ksq is the linear Stern-Volmer quenching constant, r is the ratio of the concentration of quencher and DNA. The Ksq vaule is obtained as the slop of plot of I0/I versus r.

In Fig. 9, the Ksq values are 0.240, 1.480 and 1.558 for the HMTC ligand and complexes 1 and 2, respectively. The results indicate that the interaction of the complexes with DNA are stronger than ligands.
Two zinc(Ⅱ) complexes [Zn(MTC)2(bpp)]n (1) and [Zn(MTC)(phen)(H2O)2](MTC) (2) based on the thiadia-zol derivative HMTC have been successfully synthes-ized. The complex 1 shows a 2D network structure by thiadiazol rings π-π stacking interactions, and the complex 2 exhibits a 2D layered structure by the interaction of π-π stacking and hydrogen bonding. The complexes have more stronger interaction with DNA, which can release more free EB molecules from EB-DNA.
Wang H L, Zhang D P, Sun D F, et al. CrystEngComm, 2010, 12:1096-1102 doi: 10.1039/B917659D
Feng X, Ma L F, Liu L, et al. Cryst. Growth Des., 2013, 13(10):4469-4479 doi: 10.1021/cg4009587
Sakamoto R, Iwashima T, Kogel J F, et al. J. Am. Chem. Soc., 2016, 138(17):5666-5677 doi: 10.1021/jacs.6b02128
Medishetty R, Nalla V, Nemec L, et al. Adv. Mater., 2017, 29(17):1605637 doi: 10.1002/adma.v29.17
Zhao J, Wang X L, Shi X, et al. Inorg. Chem., 2011, 50(8):3198-3205 doi: 10.1021/ic101112b
Shi Z Z, Pan Z R, Jia H L, et al. Cryst. Growth Des., 2016, 16(5):2747-2755 doi: 10.1021/acs.cgd.6b00056
Hwang I H, Jo Y D, Kim H Y, et al. Polyhedron, 2012, 42(1):282-290 doi: 10.1016/j.poly.2012.05.040
Li Q Y, Chen D Y, He M H, et al. J. Solid State Chem., 2012, 190:196-201 doi: 10.1016/j.jssc.2012.02.007
Okamoto K, Matsumoto K, Hille R, et al. Biochemsitry, 2004, 101(21):7931-7936
Pinto L D, Puppin P A L, Behring V M, et al. Inorg Chim. Acta, 2010, 363(10):2624-2630 https://www.sciencedirect.com/science/article/pii/S0162013412000074
Beckmann J, Dakternieks D, Duthie A, et al. J. Organomet. Chem., 2003, 688(1/2):56-61
Chen B L, Ockwig N W, Contreras D S, et al. Angew. Chem. Int. Ed., 2005, 117(30):4823-4827 doi: 10.1002/(ISSN)1521-3757
Kumar K V, Preuss K, Titirici M M, et al. Chem. Rev., 2017, 117(3)1796-1825 doi: 10.1021/acs.chemrev.6b00505
Lin J Y S. Science, 2016, 353(6295):121-122 doi: 10.1126/science.aag2267
Rodenas T, Luz I, Prieto G, et al. Nat. Mater., 2015, 14:48-55 doi: 10.1038/nmat4113
Semerci F, Yesilel O Z, Soylu M S, et al. Polyhedron, 2013, 50(1):314-320 doi: 10.1016/j.poly.2012.10.009
Ma Z B, Moulton B. Coord. Chem. Rev., 2011, 255(15/16):1623-1641
Efthimiadou E K, Karaliota A, Psomas G. J. Inorg. Biochem., 2010, 104(4):455-466 doi: 10.1016/j.jinorgbio.2009.12.019
Rosi N L, Kim J, Eddaoudi M, et al. J. Am. Chem. Soc., 2005, 127(5):1504-1518 doi: 10.1021/ja045123o
胡德禹, 宋宝安, 何伟, 等.合成化学, 2006, 14(4):319-328 http://www.docin.com/p-1081487701.htmlHU De-Yu, SONG Bao-An, HE Wei, et al. Chinese Journal of Synthetic Chemistry, 2006, 14(4):319-328 http://www.docin.com/p-1081487701.html
Cui Y J, Qian G, Chen L, et al. Dyes Pigm., 2008, 77(1):217-222 doi: 10.1016/j.dyepig.2007.05.005
Yamamoto T, Otsuka S I, Fukumoto H, et al. J. Polym. Sci. Part A:Polym. Chem., 2011, 49(6):1508-1512 doi: 10.1002/pola.24557
Osaka I, Zhang R, Liu J Y, et al. Chem. Mater., 2010, 22(14):4191-4196 doi: 10.1021/cm101052b
Lyu F J, Zhang Y F, Zare R N, et al. Nano Lett., 2014, 14(10):5761-5765 doi: 10.1021/nl5026419
Yang J, Chen X J, Li Y S, et al. Chem. Mater., 2017, 29(10):4580-4589 doi: 10.1021/acs.chemmater.7b01329
陈青, 卢丽萍.无机化学学报, 2016, 32(6):1001-1008 doi: 10.11862/CJIC.2016.123CHEN Qing, LU Li-Ping. Chinese J. Inorg. Chem., 2016, 32(6):1001-1008 doi: 10.11862/CJIC.2016.123
朱兴城, 黄超, 张奇龙, 等.无机化学学报, 2016, 32(6)1041-1046 doi: 10.11862/CJIC.2016.128ZHU Xing-Cheng, HUANG Chao, ZHANG Qi-Long, et al. Chinese J. Inorg. Chem., 2016, 32(6)1041-1046 doi: 10.11862/CJIC.2016.128
Sheldrick G M. SADABS: Program for Empirical Absorption Correction of Area Detector Data, University of Göttingen, Germany, 1996.
Sheldrick G M. SHELXS-97, Program for the Solution of Crystal Structure, University of Göttingen, Germany, 1997.
Sheldrick G M. SHELXL-97, Program for the Refinement of Crystal Structure, University of Göttingen, Germany, 1997.
Li X M, Dong Y H, Wang Q W, et al. Acta Crystallogr. Sect. E:Struct. Rep. Online, 2007, 63:1274-1276 http://www.ntu.edu.sg/home/hzhang
Lin X F. Acta Crystallogr. Sect. E:Struct. Rep. Online, 2006, 62:2039-2040 doi: 10.1107/S1600536806029928
郭航鸣, 赵国良, 吴小勇, 等.无机化学学报, 2011, 27(5):855-859 http://www.wjhxxb.cn/wjhxxbcn/ch/reader/view_abstract.aspx?flag=1&file_no=20110509&journal_id=wjhxxbcnGUO Hang-Min, ZHAO Guo-Liang, WU Xiao-Yong, et al. Chinese J. Inorg. Chem., 2011, 27(5):855-859 http://www.wjhxxb.cn/wjhxxbcn/ch/reader/view_abstract.aspx?flag=1&file_no=20110509&journal_id=wjhxxbcn
Lakowicz J R, Webber G. Biochemistry, 1973, 12(21):4161-4170 doi: 10.1021/bi00745a020

Figure 1 Ellipsoidal structural view of 1 with probability level of 30%
Symmetry codes: i-x, -0.5+y, -0.5-z

Figure 2 π-π packing interactions in complex 1
Symmetry codes: i-x, -0.5+y, -0.5-z; ii-x, 0.5+y, -0.5-z; iii 1-x, 1-y, -z

Figure 5 Hydrogen bonding interactions of complex 2
Symmetry codes: i-x, 1-y, -z; ii-1+x, y, z; iii 1-x, 1-y, -z

Figure 6 π-π packing interactions in complex 2
Symmetry codes: i-x, 1-y, -z; ii-1+x, y, z

Figure 9 Emission spectra of EB-DNA system in the absence and presence of HMTC ligand and complexes
(1)~(6): r=0, 0.13, 0.27, 0.4, 0.54, 0.67, respectively
Table 1. Crystallographic data for complexes 1 and 2
| Complex | 1 | 2 |
| Empirical formula | C21H20N6O4S2Zn | C20H18N6O6S2Zn |
| Formula weight | 549.92 | 567.89 |
| Crystal system | Monoclinic | Triclinic |
| Space group | P21/c | P1 |
| a/nm | 1.018 49(2) | 0.722 36(4) |
| b/nm | 2.101 26(4) | 1.199 32(7) |
| c/nm | 1.108 22(2) | 1.422 10(8) |
| α/(°) | 66.431(3) | |
| β/(°) | 99.251 0(1) | 80.379(3) |
| γ/(°) | 86.721(4) | |
| V/nm3 | 2.340 87(8) | 1.113 30(11) |
| Z | 4 | 2 |
| Dc/(g·cm-3) | 1.560 | 1.694 |
| Absorption coefficient/mm-1 | 1.269 | 1.343 |
| F(000) | 1 128 | 580 |
| Reflection collected | 21 717 | 15 830 |
| Unique reflection | 5 352 | 3 920 |
| θ range/(°) | 2.70~27.50 | 1.58~25.00 |
| R1, wR2 [I>2σ(I)] | 0.030 1, 0.079 1 | 0.048 2, 0.132 3 |
| R1, wR2 (all data) | 0.040 6, 0.084 9 | 0.060 2, 0.139 8 |
| Goodness-of-fit (on F2 | 1.019 | 1.038 |
| (Δρ)max, (Δρ)min/(e·nm-3) | 310, -300 | 1 104, -379 |
 下载: 导出CSV
Table 2. Selected bond lengths (nm) and angles (°) of complex 1
| Zn1-O4 | 0.196 28(15) | Zn1-O2 | 0.198 63(13) | Zn1-N2 | 0.202 47(16) |
| Zn1-N1i | 0.203 57(17) | ||||
| O4-Zn1-O2 | 104.18(6) | O2-Zn1-N2 | 105.73(6) | O4-Zn1-N2 | 109.04(6) |
| O4-Zn1-N1i | 109.64(6) | O2-Zn1-N1i | 106.69(6) | N2-Zn1-N1i | 120.29(6) |
| Symmetry codes: i-x, -0.5+y, -0.5-z. | |||||
下载: 导出CSV
Table 3. Selected bond lengths (nm) and angles (°) of complex 2
| Zn1-O2W | 0.197 0(2) | Zn1-O1W | 0.201 3(2) | Zn1-O1 | 0.202 2(2) | |
| Zn1-N5 | 0.217 0(3) | Zn1-N6 | 0.212 5(3) | |||
| O2W-Zn1-O1W | 110.04(11) | O2W-Zn1-O1 | 96.03(11) | O1W-Zn1-O1 | 95.37(11) | |
| O2W-Zn1-N6 | 113.98(12) | O2W-Zn1-N5 | 96.23(11) | O1W-Zn1-N6 | 135.38(11) | |
| O1-Zn1-N6 | 87.12(11) | N6-Zn1-N5 | 77.27(11) | O1W-Zn1-N5 | 91.31(10) | |
| O1-Zn1-N5 | 163.09(11) |
下载: 导出CSV
Table 4. Hydrogen bond parameters of complex 2
| D-H…A | d(D-H)/nm | d(H…A)/nm | d(D…A)/nm | ∠DHA/(°) |
| O1W-H1WA…O2i | 0.085 | 0.187 | 0.269 9(3) | 163.8 |
| O1W-H1WB…O3ii | 0.085 | 0.201 | 0.280 4(3) | 156.3 |
| O2W-H2WA…O4iii | 0.085 | 0.179 | 0.260 0(4) | 158.6 |
| O2W-H2WB…O3 | 0.085 | 0.189 | 0.272 3(4) | 167.1 |
| Symmetry codes: i-x, 1-y, -z; ii-1+x, y, z; iii1-x, 1-y, -z. | ||||
下载: 导出CSV

 扫一扫看文章

扫一扫关注我们


 下载:
下载: