Citation:
WANG Yong, LIU Wen, GUO Rui, LUO Ying, LI Yong, PEI Hai-Juan, XIE Jing-Ying. Mechanism on Capacity Fading at Higher Charging Potential of NaNi1/3Co1/3Mn1/3O2 for Sodium Ion Batteries[J]. Chinese Journal of Inorganic Chemistry,
2018, 34(4): 750-756.
doi:
10.11862/CJIC.2018.074
Received Date:
23 October 2017 Revised Date:
17 December 2017 Available Online:
10 April 2018
Abstract:
NaNi1/3Co1/3Mn1/3O2 material was synthesized by a facile method, and the suitable working voltages (3.75 V, 4 V) are investigated afterwards. The mechanisms of capacity fading when charging to 4 V are studied by ex-situ XRD and EIS measurements, which revealed a collective effect between the thicker of the SEI layer and the irreversible variation of the material structure.
Due to the abundance and relatively low cost of sodium-containing resources, the development of the sodium ion battery is rapidly growing[1-2]. However, the lack of high performance cathodes still prevents the commercialization of sodium ion battery. Among the cathode materials of sodium ion battery, O3 type layered oxides NaMO2 (M=metals, such as Ni, Co, Mn, Ti, Fe, Cr and so on[3-8]) have been widely investigated because of their high specific capacity and good cyclic retention[9-13]. During the investigation of transition layered oxides, many materials have shown good cyclic performance or specific capacity. For example, NaNi1/2Mn1/2O2 delivers a reversible capacity of 125 mAh·g-1[14] with over 90% capacity retention after 50 cycles, whereas Na(FeCrMn)1/3O2 exhibits an initial capacity of 186 mAh·g-1[15] with 50% capacity retention after 30 cycles. For one given material, a wider voltage range often means a larger capacity. Also, a higher charge voltage is pursued for a larger specific energy density. However, different voltage range would affect significantly upon the properties during the charge/discharge process, which mainly caused by the different ratio of Na+ extraction/insertion from the structure. As a classical cathode material, O3-type NaFeO2 can deliver 80~100 mAh·g-1 of reversible capacity when charging to different potential. When charging to 3.40 V, 0.30 mol Na+ can be extracted from the structure, accompanying with 80 mAh·g-1 of discharge capacity. When charging to 3.50 V, approximately 0.45 Na+ can be extracted from the structure, accompanying with 110 mAh·g-1 of discharge capacity[16]. But with the increasing charge voltage afterwards, the capacity fades fast, it could only deliver ~30 mAh·g-1 of discharge capacity when charging to 4.50 V. Similarly, NaNi0.5Mn0.5O2 material owns 120 mAh·g-1 reversible capacity and a good capacity retention at the potential range of 2~3.80 V. However, it shows poor capacity retention when charging to 4.50 V[14]. Therefore, a suitable working voltage is quite important for a better electrochemical behavior.
Similar to LiNi1/3Co1/3Mn1/3O2 in lithium ion battery, NaNi1/3Co1/3Mn1/3O2 material is an attractive cathode for sodium ion battery. Prakash et al.[17] have successfully prepared NaNi1/3Co1/3Mn1/3O2 by sol-gel method using corresponding acetates, which shows a capacity of 120 mAh·g-1 between 2~3.75 V at the rate of 0.10C. After 50 cycles, the capacity retention is about 93%, which has superiority over the other layered oxide materials. In previous work, sol-gel method is applied to manufacture the O3 type NaNi1/3Co1/3Mn1/3O2 material, which is not suitable for the application when it comes to industrial scale. Comparing to the sol-gel preparation process, solidstate reaction owns more convenience and lower costs with little waste during the production process, which means that solid-state reaction would possibly be a feasible way for a material preparation at industrial scale.
In this work, a facile method to prepare NaNi1/3Co1/3Mn1/3O2 (denoted as NNCM-333) was studied. Using a solid-state reaction, NaNi1/3Co1/3Mn1/3O2 had been successfully prepared, and its electrochemical performances were tested. This material exhibits an initial discharge capacity of 120 mAh·g-1 and a capacity retention of 93% after 50 cycles at a rate of 0.10C at the potential range of 2~3.75 V. A compre-hensive study for an optimized working voltage has been investigated. A possible mechanism for the capacity fade when working at the potential of 2~4 V is proposed.
1.
Experimental
1.1
Material synthesis
NaNi1/3Co1/3Mn1/3O2 material is synthesized via a conventional solid-state reaction. Na2CO3, NiO, Co2O3, MnO2 are mixed with respective mole ratio and then pressed into pellets. The precursors are sintered at 900 ℃ for 12 hours, and then cooled to room temperature at atomsphere.
1.2
Material characterization
The morphology of the product is characterized by field emission scanning electron microscopy (FE-SEM, Hitachi S-4800) operated at an accelerating voltage of 10 kV. High resolution transmission electron microscopy (HRTEM) and select-area electron diffraction (SAED) are examined for the structure of the as-prepared sample operated at an accelerating voltage of 200 kV. Powder X-ray diffraction (XRD) patterns are collected on an X-ray diffractometer (Bruker D8 Advance, Germany) with Cu Kα radiation (λ=0.154 18 nm) at 40 kV, 40 mA. Data are obtained over the 2θ=10°~90° with a scan rate of 1°·min-1.
1.3
Electrochemical characterization
The working electrodes are composed of NNCM-333, Super P and polyvinylidenefluoride (PVDF) with a mass ratio of 7: 2: 1 on aluminum foil. The loading amount of active materials is about 1 mg·cm-2. Coin cells (CR2016) are assembled in an Ar-filled glovebox. 0.90 mol·L-1 NaPF6 in the non-aqueous solution of 1, 2-dimethoxyethane (DME) is used as electrolyte. A glass-fiber (Whatman GF/F) is used as the separator and pure sodium foil is used as the counter electrode (anode). Galvanostatic charge-discharge measurements are carried out at 25 ℃ with a LAND battery test system. And the current density is calculated on the basis of the specific capacity and the weight of active material. The cyclic voltammetry tests are carried out at 25 ℃ with a Princeton Applied Research electro-chemical workstation at the scan rate of 0.10 mV·s-1.
2.
Results and discussion
2.1
Morphology and structure characterization
The crystalline structure is analyzed using XRD, as shown in Fig. 1a. All peaks can be well indexed to the hexagonal phase, which refer to a space group of R3m and is consistent with the standard literature[17] (PDF No.00-032-1068). This indicates that the single phase O3 type NNCM-333 is synthesized. The lattice parameters are listed as follows: a=0.297 02 nm, b=0.297 02 nm, c=1.683 80 nm; α=90°, β=90°, γ=120°. As we all known that the NNCM-333 material is unstable in air, accompanying with the structural transition from rhombohedral to monoclinic, which always associated with the gliding of Ni1/3Co1/3Mn1/3O2 slabs[18]. SEM image shows that the average particle size of the material is about 20~30 μm. For further characterizing the structure of the NNCM-333 sample, HRTEM and SAED tests are carried out, which are listed in Fig. 1(c~d). The SAED image shows a lattice structure that indicates a hexagonal symmetry. In Fig. 1d, the TEM image is observed from [100] direction, which is favorable for Na+ insertion and extraction. The d-spacing is 0.20 nm.
图 1
图 1
(a) XRD pattern; (b) SEM image; (c) SAED pattern and (d) HRTEM image of as-prepared NNCM-333
Figure 1.
(a) XRD pattern; (b) SEM image; (c) SAED pattern and (d) HRTEM image of as-prepared NNCM-333
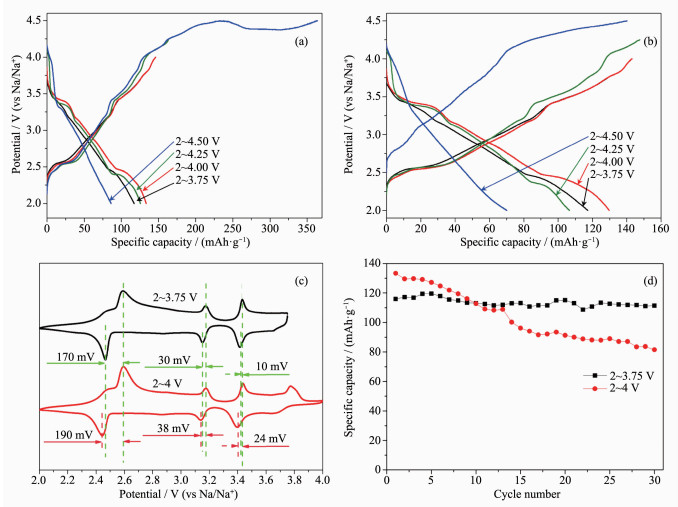
Na/NNCM-333 cells are charging to different charge voltages of 3.75, 4, 4.25 and 4.50 V. Fig. 2(a~b) depicts the first two charge-discharge curves. The open circuit voltage (OCV) lies close to 2.60 V. In the 1st charge process, an obvious plateau is observed between 2.50 and 2.60 V firstly, followed by a sloping voltage plateau to 3.30 V. Another plateau occurs at the potential range of 3.50~3.60 V. When charging over 3.80 V, a plateau between 3.80~4 V is observed. With the cell charging to 4.50 V, a persistent plateau appears close to 4.50 V. In the following discharge process, a symmetrically corresponding curve is observed, expcept for charging to 4.50 V. The electrolyte (NaPF6 in DME) is stable below the voltage of 4.40 V[19]. It would be decomposed at the voltage of 4.50 V. This may be the main reason for the bad electrochemical property when charging to 4.50 V. Furthermore, there is severe capacity fade during the first two cycles when being charged to 4.25 V and 4.50 V. Therefore, NNCM-333 cells are cycled at the potential range of 2~3.75 V and 2~4 V below.
图 2
图 2
(a) First and (b) 2nd charge-discharge curves with different charge voltage of NNCM-333 sample; (c) CV curves and (d) cyclic performance of NNCM-333 at different potential ranges
Figure 2.
(a) First and (b) 2nd charge-discharge curves with different charge voltage of NNCM-333 sample; (c) CV curves and (d) cyclic performance of NNCM-333 at different potential ranges
Fig. 2c show the CV curves of NNCM-333 in the potential range of 2~3.75 V and 2~4 V at a scan rate of 0.10 mV·s-1, respectively. There are three cathodic peaks located at 2.65, 3.15 and 3.45 V in the charge process when charging to 3.75 V, and an additional peaks at 3.76 V when charging to 4 V. Conversely, symmetrically corresponding anodic peaks are observed for the next discharge process. A larger polarization of the cathodic and anodic peaks is observed at the potential range of 2~4 V. Na/NNCM-333 cell working in the potential range of 2~4 V shows worse cyclic (57% of initial capacity after 30 cycles) performance than that in 2~3.75 V (97% of initial capacity after 30 cycles), as shown as Fig. 2d.
The possible reasons for the capacity fading when charging to 4 V may be listed as following:
(ⅰ) When charging to 4 V, the structure of the material may be destroyed, and in the following process of discharging, it cannot release the capacity acquired during the charge process. This could be confirmed by comparing the structure of the pristine and cycled materials, respectively, using ex-situ XRD.
(ⅱ) When charging to 4 V, the solid electrolyte interface (SEI) layer might be thicker than when charged to 3.75 V. This would increase the impedance between the active material and the current collector, which could be identified using an EIS measurement.
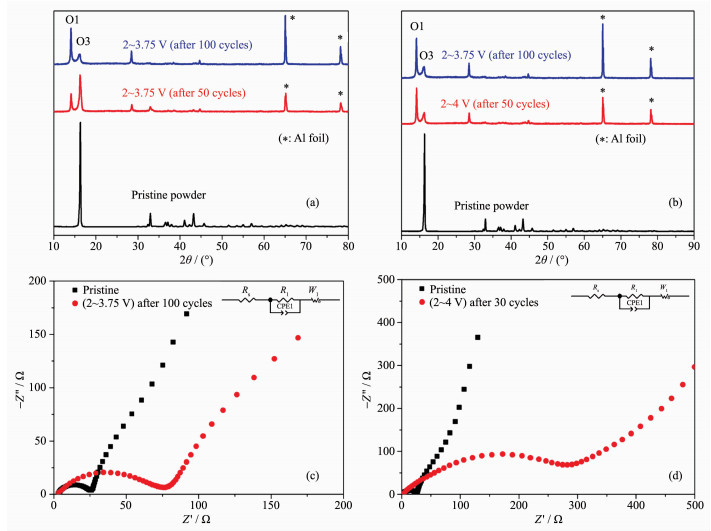
To investigate structural variation during the charge/discharge process, ex-situ XRD tests are performed after 0 (pristine material), 50 and 100 cycles when working in the range of 2~3.75 V and after 30 cycles when working at the potential range of 2~4 V, respectively, as shown in Fig. 3(a~b). (When the material cycling at the potential range of 2~4 V, the cell comes to the termination of life after 30 cycles.) The peaks labled as star (*) are assigned to Al current collector. Corrsponding Rietveld refinements are listed in the Table S1. When working in the range of 2~3.75 V (Fig. 3a), it is clearly shown that the phase varied from O3 to O1 during the charge/discharge process, which possibly causes most of the irreversible loss of capacity during the cycle. After 30 cycles in the range 2~4 V (Fig. 3b), the structure is almost identical to that after 100 cycles in the range 2~3.75 V, which indicates that the phase variation is accelerated when charging to a higher voltage. After this, the assumption (ⅰ) may be reasonably explained.
图 3
图 3
(a) XRD patterns of the pristine material and the NNCM-333 electrodes after 50 and 100 cycles in a voltage range of 2~3.75 V; (b) XRD patterns of the electrode after 30 cycles in a voltage range of 2~4 V and that after 100 cycles in a voltage range of 2~3.75 V for comparison; EIS measurements during cycles at the potential range of (c) 2~3.75 V and (d) 2~4 V (with the insets are the equivalent circuits)
Figure 3.
(a) XRD patterns of the pristine material and the NNCM-333 electrodes after 50 and 100 cycles in a voltage range of 2~3.75 V; (b) XRD patterns of the electrode after 30 cycles in a voltage range of 2~4 V and that after 100 cycles in a voltage range of 2~3.75 V for comparison; EIS measurements during cycles at the potential range of (c) 2~3.75 V and (d) 2~4 V (with the insets are the equivalent circuits)
EIS curves during cycles at the potential range of 2~3.75 V (Fig. 3c) and 2~4 V (Fig. 3d) indicate the variation of the SEI layer. A proposed equivalent circuit comprising of resistors (R1), constant phase elements (CPE) and Warburg element (W1) is listed in the inset of Fig. 3(c~d). In Fig. 3(c~d), a gap is observed between zero point and the start point, which indicates the negligible solution resistance (Rs). The R1 refers to the resisitance of the interface of the active material with the current collector, which is gradually larger along with the cycles at the potential range of 2~3.75 V, as shown in Fig. 3c, which reveals a thicker SEI layer. Similarly as the structural variation, when the cell comes to the end of life after 30 cycles at the potential of 2~4 V, the increase of the impendence is much more aggravated than that at 2~3.75 V[20].
As mentioned above, it could be summarized that a higher charge potential may acclerate the structural aging of the NNCM-333 material and aggravate the thickness increase of the SEI layer, which would result in the fade of the capacity and the increase of the resistence.
2.3
Electrochemical properties
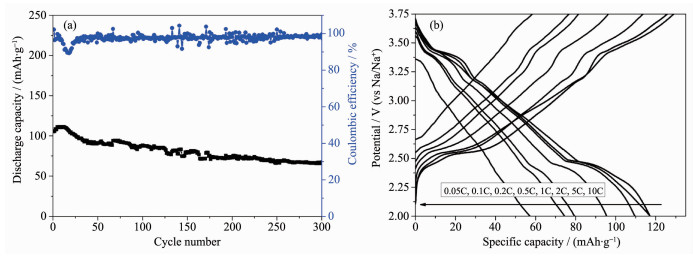
Considering the poor electrochemical properties at the potential range of 2~4 V, the long cycle performance and rate capability are examined under the potential range of 2~3.75 V. Galvanostatic charge-discharge measurements are performed to test the electrochemical properties of NNCM-333. Shown as Fig.S1, the potential-capacity curves show that the electrode yields a 2nd discharge capacity of 118.0 mAh·g-1 at the rate of 0.10C. With further cycling, the capacity fades slowly and the polarization becomes larger gradually. The long cycle performance is tested at the rate of 0.20C, depicted as Fig. 4a. The sloping increase in the first 10 cycles indicates an activation of the NNCM-333 electrode. NNCM-333 shows a good capacity retention and coulombic efficiency for the first 50 cycles. However, the capacity fades over the subsequent cycles, trending to a stable capacity of 70 mAh·g-1. After 300 cycles, the NNCM-333 holds 60% of the initial capacity. The rate performance is examined of 0.10C, 0.20C, 0.50C, 1C, 2C and 5C, shown as Fig. 4b and Fig.S2. The discharge capacity of the NNCM-333 electrode is approximately 60 mAh·g-1 even at the rate of 5C. Also, it shows a good rate retention when transferring from 2C to 0.10C after cycling.
图 4
图 4
(a) Long cycle performance of the NNCM-333 in the potential range of 2~3.75 V at 0.20C; (b) Second charge-discharge curves of the NNCM-333 at different rates
Figure 4.
(a) Long cycle performance of the NNCM-333 in the potential range of 2~3.75 V at 0.20C; (b) Second charge-discharge curves of the NNCM-333 at different rates
In summary, a stable O3-NaNi1/3Co1/3Mn1/3O2 is synthesized via solid-state reaction for sodium ion batteries. To find a possible reason for capacity fading when charging to higher potential, a seriel of experiments are tested to confirm the structural and resistance variation between the charge/discharge processes. It is concluded that a higher charge voltage could accelerate the irreversible structure changes and aggravate the increase of SEI layer thickness, which will finally cause the capacity fade. A proper working voltage of 2~3.75 V is settled and the O3-NaNi1/3Co1/3Mn1/3O2 could deliver a reversible capacity of 118 mAh·g-1 and over 60% capacity retention after 300 cycles at 0.20C. The O3-NaNi1/3Co1/3Mn1/3O2 has the potential to be a cathode material for energy storage device. With this facile and inexpensive synthesis method, large-scale and room-temperature sodium ion batteries could be more easily commercialized.
Acknowledgments
This work is financially supported by Natural Science Foundation of China (Grant No.21373137), National 863 Program (Grant No.2014AA052202) and Shanghai Science and Technology Development Funds (Grant No.15DZ2282000).
Figure 2
(a) First and (b) 2nd charge-discharge curves with different charge voltage of NNCM-333 sample; (c) CV curves and (d) cyclic performance of NNCM-333 at different potential ranges
Figure 3
(a) XRD patterns of the pristine material and the NNCM-333 electrodes after 50 and 100 cycles in a voltage range of 2~3.75 V; (b) XRD patterns of the electrode after 30 cycles in a voltage range of 2~4 V and that after 100 cycles in a voltage range of 2~3.75 V for comparison; EIS measurements during cycles at the potential range of (c) 2~3.75 V and (d) 2~4 V (with the insets are the equivalent circuits)
Figure 4
(a) Long cycle performance of the NNCM-333 in the potential range of 2~3.75 V at 0.20C; (b) Second charge-discharge curves of the NNCM-333 at different rates


 下载:
下载:

 下载:
下载:


 下载:
下载:
