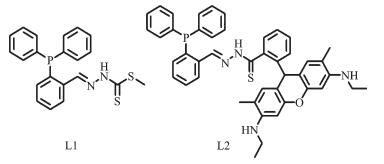
 Scheme 1.
Structures of thiosemicarbazone ligands L1 and L2

氧杂蒽染料修饰钴-硫脲配合物的光解水放氢性能
English
Photocatalytic Hydrogen Production Based on Cobalt-Thiosemicarbazone Complex with the Xanthene Dye Moiety
-
Key words:
- photoinduced electron transfer
- / cobalt
- / thiosemicarbazone
- / light driven H2 production
-
0 Introduction
The global increase in CO2 emissions due to uninhibited fossil fuel use has led to explore new renewable and clean energy resources. Photo-induced catalytic splitting of water to non-carbon-contain fuels, i.e. hydrogen, is a promising approach in converting solar energy into storable chemical energy[1-5]. As a redox reaction, water splitting can be divided into two reactions: (i) water oxidation, to yield O2 and (ii) water reduction, producing H2. In an artificial photosynthetic (AP) system, the reductive side of water splitting is the light-driven generation of hydrogen from aqueous protons. A variety of photocatalytic systems have been broadly investigated for solar hydrogen production[6-13]. Most of the photocatalytic H2-production systems involve three important components: a light-absorbing photosensitizer (PS), a water-reducing catalyst (WRC), and a sacrificial reductant. While noble metal co-catalysts such as Pt and Pd were widely used for photocatalytic H2 evolution, but the scarcity and high cost of precious metals pose serious limitations to wide use. Hence, the development of efficient catalysts for water reduction to H2 made of inexpensive, earth-abundant elements such as Fe, Co, Ni, and Cu has become a prime focus of research on light-driven hydrogen generation.
In an effort to find stable earth-abundant WRCs, a few recent reviews on catalysts made of earth-abundant elements for water splitting have been published[14-16]. In particular, thiosemicarbazone ligands have been used as versatile molecules, arising from the possibility to act as N, S-donor systems[17-18]. And the number of potential donor atoms can be increased by using carbonylic compounds that contain additional donor groups in suitable positions for chelation. Moreover, they provide a conventional proton immi-gration path through the thiolate/thioamide resonance tautomer equilibrium[19-20], which have potential future for multi-electron transfer chemistry in H2 reduction. And these cobalt thiosemicarbazone complexes have gained much interest and might be promising candidates for proton reduction, in the case that the redox potential of the complex was well modified[21-22]. In this article, we introduced a triphenylphosphine moiety as the additional donor to enhance the coordination ability and modify the redox potential of the metal centres (Scheme 1)[23-24]. Recent advances have reported Ni-bis(diphosphine) complexes act as effective reduction catalysts for electrochemical photocatalytical hydrogen production in homogeneous system[25-26]. We expected that the presence of S and P donors would possibly facilitate the formation of reducing species and increase the catalytic efficiency for the H2 evolution[27]. Herein, we introduced the rhodamine-modified ligands to improve the light absorption efficiency and electron transfer ability between the catalyst 2 and photosensitizer Fl. The photocatalytic activity of catalyst 2 was higher than that of 1 under low catalyst concentration. The photo-induced electron transfer pathway mechanisms for the hydrogen evolution in these cobalt-thiosemicarbazone complexes were also proposed.
1 Experimental
1.1 Materials and physical measurements
All chemicals were of reagent grade quality obtained from commercial sources and used without further purification. The elemental analyses of C, H and N were performed on a Vario EL Ⅲ elemental analyzer. 1H NMR spectra were measured on a Varian INOVA 400M spectrometer. ESI mass spectra were carried out on a HPLC-Q-Tof MS spectrometer. The fluorescent spectra were measured on a JASCO FP-6500.
Cyclic Voltammogram measurements: Electro-chemical measurements of catalysts 1 and 2 were performed in CH3CN solutions with 0.1 mol·L-1 TBAPF6 working on ZAHNER ENNIUM Electro-chemical Workstation with a homemade Ag/AgCl electrode as a reference electrode, a platinum silk with 0.5 mm diameter as a counter electrode, and glassy carbon electrode as a working electrode. The addition of NEt3HCl (0.1 mol·L-1 in CH3CN) was carried out with syringe.
Fluorescence quenching experiments: A solution (2.0 mL) of Fl at 10 μmol·L-1 concentration in a EtOH/H2O solution (1:1, V/V, pH=11.6) was prepared in a quartz cuvette fitted with a septum cap, and the solution was degassed under N2 for 5 min. Aliquots of 20 μL of NEt3 and the catalysts (2.5 μmol·L-1) were added, and the intensity of the fluorescence was monitored by steady state fluorescence exciting at 460 nm on a Spex Fluoromax-P fluorimeter with a photomultiplier tube detector.
Photocatalytic water splitting experiments: Varying amounts of the catalysts 1 and 2, Fl and NEt3 in EtOH/H2O solution (1:1, V/V) were added to obtain a total volume of 5.0 mL in a 20 mL flask. The flask was sealed with a septum and degassed by bubbling argon for 15 min. The pH value of this solution was adjusted to a specific pH value by adding HCl or NaOH and measured with a pH meter. After that, the samples were irradiated by a 500 W Xenon lamp with the 400 nm light filter, and the reaction temperature was maintained at 293 K by using a thermostat water bath. The generated photoproduct of H2 was chara-cterized by GC 7890T instrument analysis using a 5A molecular sieve column (0.6 m×3 mm), thermal conductivity detector, and argon used as carrier gas. The amount of hydrogen generated was determined by the external standard method.
1.2 Synthesis of L1 and L2
The ligand L1 was synthesized by using the reported methods[28]. Anal. Calcd. for C21H19N2PS2(%): H, 4.85; C, 63.9; N, 7.1; Found(%): H, 5.10; C, 63.3; N, 7.2. 1H NMR (CDCl3, 400 MHz): 10.2 (s, 1H), 8.6 (d, 1H), 8.2 (m, 1H), 7.1~7.5 (m, 13H), 2.6 (s, 3H). API-MS m/z: 393.07 ([M-H]+).
The ligand L2 was synthesized according to procedures reported previously[29]. Anal. Calcd. for C45H43N4SOP(%): H, 6.03; C, 75.2; N, 7.8; Found(%): H, 6.11; C, 74.9; N, 8.0. 1H NMR (CDCl3, 400 MHz): 9.37 (s, 1H), 8.4 (t, 1H), 8.11 (d, 1H), 8.08 (m, 1H), 7.6~7.7 (m, 4H), 7.4~7.6 (m, 10H), 7.38 (m, 3H), 7.3 (m, 2H), 6.5 (s, 2H), 6.2 (s, 2H), 3.1 (m, 2H), 1.13 (m, 3H); API-MS m/z: 715.0 ([M-H]+).
1.3 Synthesis of complex 1
The ligand L1 (0.6 mmol, 0.236 g) and Co(BF4)2·6H2O (0.3 mmol, 0.1 g) was dissolved in 10 mL ethanol. The solution was refluxed for 2 h, and then slowly evaporated at room temperature. The red block crystals were obtained in several days. Yield: ~55%. ESI-MS m/z: 845.23 for the +1 charge cation. Anal. Calcd. for CoC42H37N4OP2S4BF4·0.5H2O(%): H, 3.99; C, 52.6; N, 5.84; Found(%): H, 4.02; C, 52.1; N, 5.89. IR (KBr, cm-1): 3 424 (br), 3 056 (m), 1 630 (s), 1 586 (s), 1 480 (m), 1 460 (m), 1 436 (m), 1 313 (s), 1 127 (m), 1 063 (m), 1 012 (m), 875 (s), 754 (m), 727 (m), 696 (m), 562 (m), 526 (m), 498 (m).
1.4 Synthesis of complex 2
Co(BF4)2·6H2O (0.05 mmol, 0.017 g) and the ligand L2 (0.05 mmol, 0.035 g) was dissolved in 15 mL of dichloromethane/ethanol (1:1, V/V). The solution was stirred at boiling temperature for 2 h to obtain a clear black red solution and allowed to stand at room temperature. The red block crystals suitable for single-crystal X-ray diffraction were obtained. Yield: ~40%. ESI-MS m/z: (2L2+Co)3+, 497.16; (2L2+Co+BF4)2+, 789.76. Anal. Calcd. for CoC91H85.5N8O3P2S2B2.50F10·H2O ·0.5C2H5OH(%): H, 5.15; C, 61.7; N, 6.33; Found(%): H, 5.20; C, 61.1; N, 6.37. IR (KBr, cm-1): 3 243 (br), 2 973(s), 1 647 (m), 1 606 (m), 1 560 (m), 1 527 (m), 1 499 (m), 1 446 (s), 1 366 (s), 1 306 (m), 1 243 (m), 1 186 (m), 1 124 (m), 1 083 (m), 944 (s), 882 (s), 748 (s), 693 (m), 611 (m), 522 (s).
1.5 X-ray crystallography
The data were collected on a Bruker Smart APEX Ⅱ X-diffractometer equipped with graphite monochromated Mo Kα radiation (λ=0.071 073 nm) using the SMART and SAINT[30] programs at 296 K for complexes 1 and 2. Final unit cell parameters were based on all observed reflections from integration of all frame data. The structures were solved in the space group by direct method and refined by the full-matrix least-squares using SHELXTL-97 fitting on F2 [31]. For complexes 1 and 2, all non-hydrogen atoms were refined anisotropically. Except the solvent water molecules, the hydrogen atoms of organic ligands were located geometrically and fixed isotropic thermal para-meters. The BF4- groups in complex 2 were disordered; therefore, large thermal displacement parameters were found for these atoms and refined with partial occupancy. One of the benzene rings was disordered into two parts with the S. O. F. (sites occupied factor) of each part being fixed as 0.5. One ethylamine moiety and ethyl groups in complex 2 were disordered into two parts with the S.O.F. of each part being fixed as 0.5. The crystal data and details of the structure refine-ment of complexes 1 and 2 are summarized in Table 1.
CCDC: 1523357; 1, 1523358, 2.
2 Results and discussion
2.1 Crystal structural description
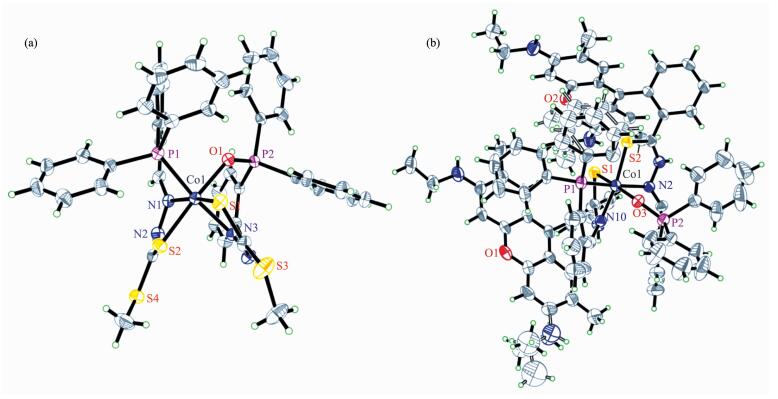
Single-crystal structure representation for the complexes 1 and 2 are shown in Fig. 1. In the crystal of complex 1, each central cobalt environment can be described as a distorted octahedron, comprising two N, S atoms from thiosemicarbazone groups, one P atoms from the triphenylphosphine group and the O atom originated from oxidized P atom. One of the P atoms in the ligand L1 was oxidized under the synthesis process. The two ligands bind to a cobalt(Ⅱ) in a mer configuration as found in the related cobalt thiosemicarbazone complexes[32-33]. The C-S, C-N and N-N bond distances are agreed well with the normal range of single and double bonds, resulting in the extensive electron donation environment over the entire molecular skeleton[34-35]. Similar to the complex 1, in the crystal of complex 2, the metal center was octahedrally coordinated by two N, S atoms and a P or O chelator atom that originated from the different ligands L2 and L2′. And the distance between two xanthene rings of rhodamine ligands in adjacent complex was 0.36 nm. The presence of intermolecular strong π-π stacking interactions between the rhodamine groups implied the possibility on the formation of π-π interaction between complex 2 and the xanthene rings within the photosensitizer Fl. As a result, the photogenerated electron would be easily immigrated between the photosensitizer and the photocatalyst during the photoreduction processes, which was beneficial to achieve the high activity in the photocatalytic system[36].
2.2 Cyclic voltammetry of the complexes
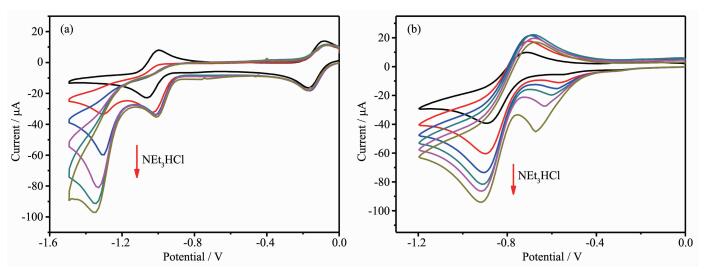
The cyclic voltammetry shows that the redox potential of Co(Ⅱ)/Co(Ⅰ) occurs at -1.0 V and -0.87 V for 1 and 2, respectively. And the complex 2 exhibits one inreversible Co(Ⅲ)/Co(Ⅱ) redox process at -0.6 V. To investigate the role of the Co complex as a WRC catalyst, cyclic voltammetry was performed in the presence of increasing amounts of NEt3HCl. Addition of NEt3H+ with increasing amounts triggers the appe-arance of a new irreversible cathodic wave near the Co(Ⅱ)/Co(Ⅰ) response[37-38]. Increasing the concentration of NEt3H+ raises the height of the new wave and shifts it to more negative potentials, indicating that complexes 1 and 2 are able to reduce the proton with a catalysis process.This observation indicates direct protonation of the reduced Co(Ⅰ) center and also shows that the protonation process is fast in the overall catalytic rate.
2.3 Complexes 1 and 2 as efficient quencher for the photosensitizer Fl
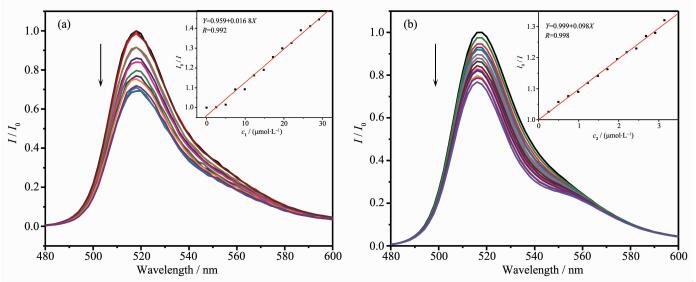
Complexes 1 and 2 also serves as an efficient quencher for the photosensitizer Fl. To verify this hypothesis further, the Stern-Volmer quenching constant Kq in this system was calculated as 1.9×10⁴ L·mol-1 upon the addition of 1 into Fl solution in EtOH/H2O (1:1, V/V). The quenching behavior can be considered as a photoinduced electron transfer process from excited state of Fl* to 1, providing possibilities for Fl to activate complex 1 producing H2 in solution. Although the Kq for the catalyst 1 was higher than that reported for NEt3 (0.44 L·mol-1), the concentration of NEt3 (1.08 mol·L-1, 15%) in the actual photocatalytic reactions is much higher than the catalyst 1 (10 μmol·L-1). A photoinduced electron transfer from the NEt3 to the excited state of Fl (reduction quenching) dominated the homogeneous photolysis of the reaction mixture instead of direct quenching by 1. As the Stern-Volmer quenching constant of 2 (9.85×10⁴ L·mol-1) is higher than that of complex 1 (Fig. 3). It indicates that the modified rhodamine group was in favor of the electronic transport between the catalyst 2 and photosensitizer Fl. When the concentration of NEt3 was fixed at 0.5 mol·L-1 (7%, V/V) and catalyst 2 was fixed at 10 μmol·L-1 under the photocatalytic condition, the direct luminescence quenching of Fl by the catalyst 2 should be largely dominated by the oxidative quenching. The initial photochemical step was the formation of Fl+ caused by 2[39-40]. Because both the photosensitizer Fl and the rhodamine-based catalyst contain highly conjugated xanthene moieties, Fl molecules might have strong π-π stacking interact with the catalyst 2, which is beneficial to transfer electrons from the photoexcited Fl* to 2[41]. This process led to a more efficient separation of the photogenerated electrons, thus suppressing the combination of electrons that would result in undesired radiative transition. Therefore, the photo-induced electron transfer pathway obtained by the catalyst 2 could potentially be benefit for the construction of efficient photocatalytic systems.
2.4 Complex 1 as a WRC
Proton reduction catalytic activity of 1 was evaluated by coupling it with Fl as a photosensitizer (PS) upon irradiation with visible light (λ>400 nm) in an EtOH/H2O (1:1, V/V) solvent mixture containing NEt3 at room temperature[42-44]. The optimum pH value of the reaction mixture was maintained at 11.5, decreasing or increasing pH values resulted in both a lower initial rate and shorter system lifetime for hydrogen evolution (Fig. 4a). The efficiency of the visible light induced hydrogen evolution depends on the concentration of sacrificial reagent NEt3. The optimal concentration is 15%, with a decrease of activity at lower or higher concentration. Furthermore, the addition of two of the three components of the homogeneous systems could not give any further H2 evolution which indicated that both the 1 and Fl were decomposed during the photolysis.
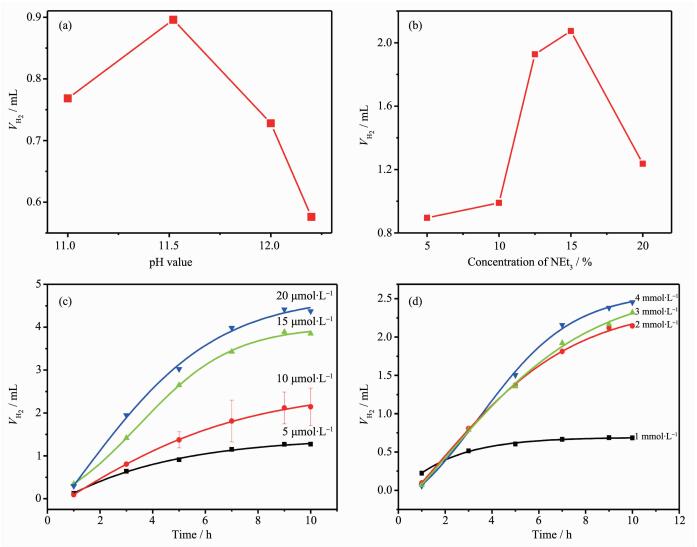 Figure 4.
Initial rates of H2 production in systems containing 1, Fl and 15% (V/V) of NEt3 with different pH values (a) and containing 1, Fl at pH 11.5 with different concentrations of NEt3 (b); Photocatalytic hydrogen evolution of systems containing Fl, 15% (V/V) NEt3 with different concentrations of 1 (c) and containing 1, 15% (V/V) NEt3 with different concentrations of Fl (d)
In the system with Fl and NEt3 at fixed concen-trations, the initial rate of H2 generation exhibits a first-order dependence on catalyst 1. At 10.0 μmol·L-1 catalysts 1 and 2 mmol·L-1 Fl, this system exhibits a TON of 2 267 molH2·molcat-1 after 10 hours and an initial TOF of 220 molH2·molcat-1·h-1. At higher catalyst con-centrations, even though a larger amount of H2 is evolved, the TON does not scale linearly with catalyst concentration due to the limited lifetime of the system. To determine the limit of this system, an additional experiment was carried out at different Fl concentra-tions shown in Fig. 4d. At higher Fl concentration as 4 mmol·L-1, there is no continuous increased H2 genera-tion detected in 10 h. The TOF reaches a maximum at 2.0 mmol·L-1 Fl, which indicates that the system is limited by the concentration of the catalyst. The system has a longer life time at higher Fl, thus suggesting that Fl decomposes during photolysis. This phenomenon also demonstrates that the reductive quenching path way dominates in the system of catalyst 1.
2.5 Complex 2 as a WRC
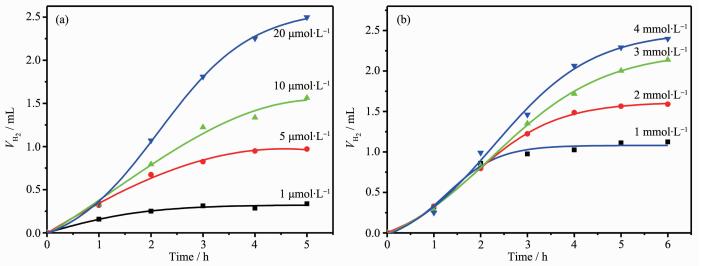
Through investigating the influence of different pH values and concentration of NEt3, we found the highest efficiency of H2 production could be achieved at pH 11.6 and NEt3 7%. For initial experiments, the Fl concentration in the reaction vials was kept at 2 mmol·L-1, while a 5 μmol·L-1 catalyst concentration was chosen. The initial TOF calculated was 346.5 molH2·molcat-1·h-1 in 5 h with the TON of about 1 732 molH2·molcat-1. To further probe the photocatalytic process, concentrations of both the Fl and the catalyst 2 were varied. Details of the effect of reactant concentration on H2 evolution are depicted in Fig. 5. In terms of catalyst turnovers, it was observed that the photo-catalytic system performs better at high Fl concentration and low catalyst concentration. These results pointed toward high degradation degree of the catalyst 2, which was more notable at higher concentrations. As shown in Table 2, in the same reaction condition, catalyst 2 has a higher TON and TOF than catalyst 1 in the concentration of 5 μmol·L-1 for catalyst. However, in the higher catalyst concentration of 20 μmol·L-1, the catalyst 1 showed the better photo-catalytic activity than catalyst 2. It was attribute to the self-stacking interaction of rhodamine group in high concentration which reduced the electronic transfer ability between the catalyst 2 and Fl. And in the same catalyst concentration, catalyst 2 exhibited higher TON and TOF than catalyst 1 in different Fl concentration in 5 h. These results demonstrated that the fast electronic transfer in catalyst 2 was benifit for the photocatalytic system in low catalyst concentration. When the concentration of the catalyst was lowered from 5 μmol·L-1 to 1 μmol·L-1, keeping the Fl at the optimal concentration, the hydrogen evolution continued within 3 hours. Although the quantity of hydrogen production decrease, it led to a large increase in turnovers yielding up to 2 800 molH2·molcat-1 and the highest TOF 930 molH2·molcat-1·h-1.
The light induced H2 evolution varied on the concentration of Fl, and the increasing of Fl amount caused the increasing of TON. These results suggest both the 2 and Fl were decomposed during the photolysis, but the decompose rate of Fl was much higher than that of the catalyst 2. The photocatalytic activity of catalyst 2 was decreased after 5 h, while catalyst 1 showed better activity in 10 h. The life time of the hydrogen evolution system was shorten, which could be due to the cooperation effect between rhodamine groups and Fl. This fast energy transfer process resulted the quick decompose of Fl and catalyst 2. Relative to catalyst 1, catalyst 2 has a higher hydrogen production rate in the beginning of the reaction process which also demonstrated the fast electron transfer in rhodamine-modified systems. A tentative mechanism proposed for the high activity of catalyst 2 for the production of H2 has been deduced. Photogenerated electrons in Fl firstly transfer to the rhodamine groups in 2 under illumination with visible light through the possible intermolecular π-π interactions, and then the ligands transfer electrons to the Co center, where H2 evolution reactions occur. At last, the electron donor NEt3 restore the excited Fl+ to the ground state to complete the catalytic cycle.
3 Conclusions
In summary, we reported a simple but effective method to gain cobalt-thiosemicarbazone complexes 1 and 2 as the efficient water reductive catalyst. Structures of these complexes were determined by single crystal X-ray analysis. Electrochemical analysis demonstrated their WRC activity in presence of a proton source of NEt3HCl. The water reduction properties of the catalyst were evaluated using Fl as PS with NEt3 as the sacrificial donor. Introducing the rhodamine group which could cooperate with the photosensitizer makes the catalyst 2 more efficient with the TON and initial TOF reaching to 2 800 molH2·molcat-1 and 930 molH2·molcat-1·h-1. The higher photo-catalytic activity in lower catalyst concentration and short time indicates the fast electron transfer ability between the catalyst 2 and photosensitizer Fl. The photocatalytic process is dominated by the oxidative quenching with the formation of Fl+ caused by 2 which is benefit for the hydrogen evolution. All these work declare the bright future of the thiosemi-carbazone complex in hydrogen evolution.
-
-
[1]
Cook T R, Dogutan D K, Reece S Y, et al. Chem. Rev., 2010, 110:6474-6502 doi: 10.1021/cr100246c
-
[2]
Bard A J, Fox M A. Acc. Chem. Res., 1995, 28:141-145 doi: 10.1021/ar00051a007
-
[3]
Chen X, Liu L, Yu P Y, et al. Science, 2011, 331:746-750 doi: 10.1126/science.1200448
-
[4]
Wang F, Wang W G, Wang X J, et al. Angew. Chem., Int. Ed., 2011, 50:3193-3197 doi: 10.1002/anie.201006352
-
[5]
Yuhas A D, Smeigh A L, Douvalis A P, et al. J. Am. Chem. Soc., 2012, 134:10353-10356 doi: 10.1021/ja303640s
-
[6]
Kluwer A M, Kapre R, Hartl F, et al. PNAS, 2009, 106:10460-10465 doi: 10.1073/pnas.0809666106
-
[7]
Zhang P, Wang M, Li C, et al. Chem. Commun., 2010, 46:8806-8808 doi: 10.1039/c0cc03154b
-
[8]
McNamara W R, Han Z, Alperin P J, et al. J. Am. Chem. Soc., 2011, 133:15368-15371 doi: 10.1021/ja207842r
-
[9]
McCormick T M, Calitree B D, Orchard A, et al. J. Am. Chem. Soc., 2010, 132:15480-15483 doi: 10.1021/ja1057357
-
[10]
McLaughlin M P, McCormick T M, Eisenberg R, et al. Chem. Commun., 2011, 47:7989-7991 doi: 10.1039/c1cc12347e
-
[11]
Han Z, McNamara W R, Eum M S, et al. Angew. Chem. Int. Ed., 2012, 51:1667-1670 doi: 10.1002/anie.v51.7
-
[12]
Zhang W, Hong J, Zheng J, et al. J. Am. Chem. Soc., 2011, 133:20680-20683 doi: 10.1021/ja208555h
-
[13]
温福宇, 杨金辉, 宗旭, 等.化学进展, 2009, 21(11):2285-2302WEN Fu-Yu, YANG Jin-Hui, ZONG Xu, et al. Prog. Chem., 2009, 21(11):2285-2302
-
[14]
Artero V, Chavarot-Kerlidou M, Fontecave M. Angew Chem, Int Ed., 2011, 50:7238-7266 doi: 10.1002/anie.v50.32
-
[15]
Lin Y, Yuan G, Sheehan S, et al. Energy Environ. Sci., 2011, 4:4862-4869 doi: 10.1039/c1ee01850g
-
[16]
Lobana T S, Sharma R, Bawa G, et al. Coord. Chem. Rev., 2009, 253:977-1055 doi: 10.1016/j.ccr.2008.07.004
-
[17]
Beraldo H, Gambino D. Mini Rev. Med. Chem., 2004, 4:31-39 doi: 10.2174/1389557043487484
-
[18]
Milunovic M N M, Enyedy E A, Nagy N V, et al. Inorg. Chem., 2012, 51:9309-9321 doi: 10.1021/ic300967j
-
[19]
Peng H, Liu G F, Liu L, et al. Tetrahedron, 2005, 61:5926-5932 doi: 10.1016/j.tet.2005.03.096
-
[20]
AliM A, Bernhardt P V, Brax M A H, et al. Inorg. Chem., 2013, 52:1650-1657 doi: 10.1021/ic302596h
-
[21]
Chang T M, Tomat E. Dalton Trans., 2013, 42:7846-7849 doi: 10.1039/c3dt50824b
-
[22]
Credico A, de Biani F F, Gonsalvi L, et al. Chem. Eur. J., 2009, 15:11985-11998 doi: 10.1002/chem.v15:44
-
[23]
Zhang L Y, Xu L J, Zhang X, et al. Inorg. Chem., 2013, 52:5167-5175 doi: 10.1021/ic4000457
-
[24]
Han Z J, Shen L X, Brennessel W W, et al. J. Am. Chem. Soc., 2013, 135:14659-14669 doi: 10.1021/ja405257s
-
[25]
Goff A L, Artero V, Jousselme B, et al. Science, 2009, 326:1384-1387 doi: 10.1126/science.1179773
-
[26]
Kilgore U J, Roberts J A S, Pool D H, et al. J. Am. Chem. Soc., 2011, 133:5861-5872 doi: 10.1021/ja109755f
-
[27]
Du P, Eisenberg R. Energy Environ. Sci., 2012, 5:6012-6021 doi: 10.1039/c2ee03250c
-
[28]
Jing X, Wu P, Liu X, et al. New J. Chem., 2015, 39:1051-1059 doi: 10.1039/C4NJ01540A
-
[29]
Huang W, Song C, He C, et al. Inorg. Chem., 2009, 48:5061-5072 doi: 10.1021/ic8015657
-
[30]
SMART, SAINT and XPREP, Bruker Analytical Instruments Inc. , Madison, WI, 1995.
-
[31]
Sheldrick G M. SHELXS-97, Program for X-ray Crystal Structure Solution and Refinement, University of Göttingen, Germany, 1997.
-
[32]
Duan C Y, Liu Z H, You X Z, et al. Chem. Commun., 1997:381-382
-
[33]
Li M X, Chen C L, Zhang D, et al. Eur. J. Med. Chem., 2010, 45:3169-3177 doi: 10.1016/j.ejmech.2010.04.009
-
[34]
Katti K V, Singh P R, Barnes C L. J. Chem. Soc., Dalton Trans., 1993:2153-2159
-
[35]
ZhaoY G, Guo D, Liu Y, et al. Chem. Commun., 2008:5725-5727
-
[36]
Stewart M P, Ho M H, Wiese S, et al. J. Am. Chem. Soc., 2013, 135:6033-6046 doi: 10.1021/ja400181a
-
[37]
Razavet M, Artero V, Fontecave M. Inorg. Chem., 2005, 44:4786-4795 doi: 10.1021/ic050167z
-
[38]
Kasunadasa H I, Chang C J, Long J R. Nature, 2010, 464:1329-1333 doi: 10.1038/nature08969
-
[39]
Zhang P, Wang M, Dong J, et al. J. Phys. Chem. C, 2010, 114:15868-15874 doi: 10.1021/jp106512a
-
[40]
Li L, Duan L L, Wen F Y, et al. Chem. Commun., 2012, 48:988-990 doi: 10.1039/C2CC16101J
-
[41]
Dong X Y, Zhang M, Pei R B, et al. Angew. Chem. Int. Ed., 2016, 55:2073-2077 doi: 10.1002/anie.201509744
-
[42]
Lazarides T, McCormick T, Du P W, et al. J. Am. Chem. Soc., 2009, 131:9192-9194 doi: 10.1021/ja903044n
-
[43]
韩阿丽, 杜平武.无机化学学报, 2013, 29(8):1703-1709 http://www.wjhxxb.cn/wjhxxbcn/ch/reader/view_abstract.aspx?file_no=20130819&flag=1HAN A-Li, DU Ping-Wu. Chinese J. Inorg. Chem., 2013, 29(8):1703-1709 http://www.wjhxxb.cn/wjhxxbcn/ch/reader/view_abstract.aspx?file_no=20130819&flag=1
-
[44]
Zhang P, Wang M, Na Y, et al. Dalton Trans., 2010, 39:1204-1206 doi: 10.1039/B923159P
-
[1]
-
Figure 1 Single-crystal structure representations of 1 (a) and 2 (b) showing the coordination geometry of the metal ion
Thermal ellipsoids are drawn at the 30% probability level; Anions and solvent molecules are omitted for clarity; Selected bond distance (nm) in 1: Co(1)-N(1) 0.197 0(3), Co(1)-O(1) 0.200 6(3), Co(1)-N(2) 0.201 4(3), Co(1)-S(2) 0.222 9(1), Co(1)-P(1) 0.222 2(2), Co(1)-S(1) 0.223 1(1); Selected bond distance (nm) in 2: Co(1)-N(10) 0.194 7(4), Co(1)-O(3) 0.201 0(4), Co(1)-N(2) 0.203 0(4), Co(1)-S(2) 0.221 3(2), Co(1)-P(1) 0.221 7(2), Co(1)-S(1) 0.223 0(2)
Figure 4 Initial rates of H2 production in systems containing 1, Fl and 15% (V/V) of NEt3 with different pH values (a) and containing 1, Fl at pH 11.5 with different concentrations of NEt3 (b); Photocatalytic hydrogen evolution of systems containing Fl, 15% (V/V) NEt3 with different concentrations of 1 (c) and containing 1, 15% (V/V) NEt3 with different concentrations of Fl (d)
c1=10.0 μmol·L-1, cFl=2.0 mmol·L-1 for (a) and (b); c1=5.0, 10.0, 15.0, 20.0 μmol·L-1, cFl=2.0 mmol·L-1 for (c); c1=10.0 μmol·L-1, cFl=1.0, 2.0, 3.0, 4.0 mmol·L-1 for (d)
Figure 5 Photocatalytic hydrogen evolution of systems containing Fl, NEt3 with different concentrations of 2 (a) and containing 2, NEt3 with different concentrations of Fl (b)
Concentration of NEt3: 7% (V/V); cFl=2.0 mmol·L-1, c2=1.0, 5.0, 10.0, 20.0 μmol·L-1 for (a); c2=10.0 μmol·L-1, cFl=1.0, 2.0, 3.0, 4.0 mmol·L-1 for (b)
Table 1. Crystal data and structure refinements for complexes 1 and 2

Table 2. Data of hydrogen production test in 5 h for complexes 1 and 2

-

 扫一扫看文章
计量
- PDF下载量: 6
- 文章访问数: 1400
- HTML全文浏览量: 186


 下载:
下载:


 下载:
下载:

