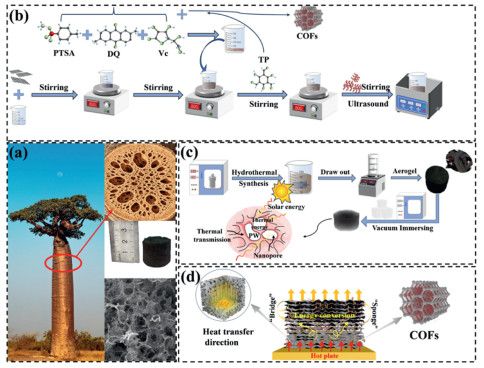
Figure 1.
(a) Bionic design concept. (b, c) Flowchart of GCOFCux preparation process. (d) Mechanism of material heat transfer enhancement.

Multi-component synergistic enhancement of 3D graphene aerogels for high-performance photothermal composite phase change materials
Liwei Yang , Pengfei Chen , Jianguo Duan , Huitao Yu , Jianguo Cheng , Qing Ma


The global energy consumption and environmental issues are growing increasingly severe, and the development and utilization of clean and renewable energy sources have become an important way to ensure the sustainable development of society [1]. Solar energy, as a high-quality clean energy source, is highly valued. Therefore, the research and development of new composite materials with efficient photothermal conversion and high thermal storage density is of great significance for improving the efficiency of solar energy utilization and promoting large-scale application [2]. Phase change energy storage materials can achieve high-density storage and release of thermal energy through solid-liquid phase changes in the form of latent heat [3]. Organic PCMs such as paraffin (PW) [4], polyethylene glycol [5], and palmitic acid [6] are widely used in the fields of thermal storage and photothermal conversion due to their moderate phase change temperatures, high phase change enthalpies, and chemical stability [7,8]. Among them, PW has low cost, high heat storage density and excellent cycling stability, and thus has a promising prospect for industrial application. However, pure PW generally has problems such as low thermal conductivity, weak light absorption ability, easy leakage at high temperatures, and poor structural stability, which severely restrict its development and long-term application in the integrated photothermal heat storage system.
Carbon-based porous matrices, with their ultra-lightweight, high porosity, high specific surface area and high adsorption capacity, showing great superiority in encapsulating PCMs. They can achieve high loading rates while maintaining structural integrity. The nano-capillary force can prevent the leakage of phase change materials, and the interconnected three-dimensional thermal conduction network can enhance heat transfer and improve photothermal conversion efficiency, significantly optimizing the energy storage density and practicality of the CPCMs system [9]. Graphene oxide (GO) has broad application prospects in various fields [10,11] owing to its ultrahigh thermal conductivity and excellent light absorption capability [12]. Its functional derivative, rGO, retains the advantages of GO and has better dispersibility and processability, making it an ideal candidate for constructing 3D porous supporting skeletons [13]. For example, Gao et al. [14] prepared a composite phase change material with high thermal storage density and long-term thermal reliability by encapsulating PW in multi-dimensional MXene/CoNi-C. To further enhance thermal conductivity, researchers usually add high thermal conductivity fillers [15,16]. CuNWs can construct continuous thermal conduction pathways due to their high aspect ratio and extremely high thermal conductivity, making them ideal enhancers [17]. Cai et al. [18] introduced high aspect ratio CuNWs into polypropylene, increasing the thermal conductivity of the composite material by 234%.
In recent years, COFs have rapidly gained popularity in the field of phase change material encapsulation due to their high specific surface area, ordered pore structure, excellent thermal stability, and strong adsorption capacity [19]. Composed of light elements through covalent bonds, they have great potential in multiple fields [20]. Geng et al. [21] integrated covalent triazine framework with expanded graphite for paraffin encapsulation, which greatly enhanced the leakage resistance of the composite. Currently, CPCMs in solar photothermal applications has problems such as low photothermal conversion efficiency and easy leakage at high temperatures, and there is a lack of research on the multi-component collaborative heat transfer and photothermal coupling mechanisms. Herein, COFs are introduced to fabricate functionally integrated CPCMs, aiming to enhance their comprehensive performance and fill the existing research deficiencies.
Inspired by natural structures, this study takes the unique internal loose, porous and efficient water-storage structure of African baobab trees as the design prototype to construct a biomimetic structural system with efficient storage and rapid transfer capabilities. Via hydrothermal self-assembly and CO2 supercritical drying technology, a three-dimensional (3D) porous disordered material with rGO aerogel as the supporting skeleton was fabricated. CuNWs with different dimensions and COFs were introduced to construct interpenetrating networks, and PW was vacuum-impregnated into the system to fabricate the GCOFCux (rGO/COFs/CuNWs/PW) composite. This system takes advantage of the merits of multiple components to collaboratively investigate the effects of CuNWs and COFs on the rGO framework. Combined with COMSOL simulation of heat transfer behavior, the synergistic mechanism of photothermal effect is revealed, providing insights for the development of high-efficiency photothermal energy storage materials.
The researchers drew inspiration from the loose and porous structure of the baobab tree, which has excellent water storage capabilities (Fig. 1a). They utilized its high porosity and interconnected pore channels to construct a biomimetic structural system that can efficiently store heat and rapidly transfer heat. They also presented the macroscopic pores of the natural wood cross-section, the physical model of the biomimetic porous aerogel, and the microscopic SEM images of the porous structure. GO [22] was prepared by the improved Hummer method. 80 mg of GO was dissolved in 20 mL of deionized water to obtain a uniform suspension of 4 mg/mL. The CPCMs preparation were based on reference [23] and was modified (Figs. 1b and c). CuNWs were weighed in proportions of 5, 10, 15, and 20 vol% and added to the GO mixture. After ultrasonic stirring and homogenization, it was poured into a polytetrafluoroethylene-lined high-pressure reactor and heated at 180 ℃ for 10 h. After washing with deionized water, the hydrogel was frozen for 12 h and then CO2 supercritical dried for 12 h to obtain rGCOFCux (rGO/COFs/CuNWs). Finally, it was vacuum impregnated with PW to obtain GCOFCux. Fig. 1d illustrates the performance improvement mechanism of GCOFCux. The 3D connected framework forms an efficient "heat bridge" network, enabling rapid heat transfer. The experimental reagents, CuNWs preparation protocol, more detailed information about COFs and characterization testing instruments are available in the Supporting Information.
The microscopic morphology of the four groups of samples was demonstrated through SEM. Fig. 2a respectively show the material standing on the feather and the height of the material, highlighting the lightweight characteristics of the material. Fig. 2b clearly presents the interconnected porous structure within the three-dimensional framework of rGCOFCux. It can be observed from Figs. 2c-f that CuNWs in rGCOFCux are stably interwoven within the rGO framework, and the CuNWs structures loaded on the rGO framework gradually become more distinct with the increase of CuNWs doping proportion. Fig. 2e shows that the generated COFs exhibit a nanoscale tubular structure wrapped between some rGO layers and CuNWs, and the COFs provide countless tiny adsorption units. Furthermore, CuNWs form bridge-like structures between rGO layers, as well as between rGO layers and COFs. These three components (rGO, CuNWs, and COFs) form high-density physical cross-linking points, which provide favorable conditions for reducing the leakage rate and improving the thermal conductivity of the composite after PCMs filling. Fig. 2g shows the morphology of GCOFCu1.5 after PW impregnation. Under the action of capillary force, PW uniformly fills the pore spaces of the framework and forms a dense block-like structure. In Fig. 2h, the distribution map of elements in GCOFCu1.5, the Cu element representing CuNWs, is in a position highly consistent with the distribution position of the C element representing rGO, and the four elements representing COFs, N, O, Si, and B, are also evenly distributed in the rGO part. Fig. 2i is the corresponding EDS full spectrum of GCOFCu1.5, where characteristic peaks of C, N, O, B, Si and Cu elements can be clearly detected, and the mass fraction data of each element further quantitatively verifies the coexistence of COFs and CuNWs in the composite skeleton. This further confirms the successful loading of CuNWs and COFs, laying a solid foundation for the subsequent preparation of high-performance CPCMs.
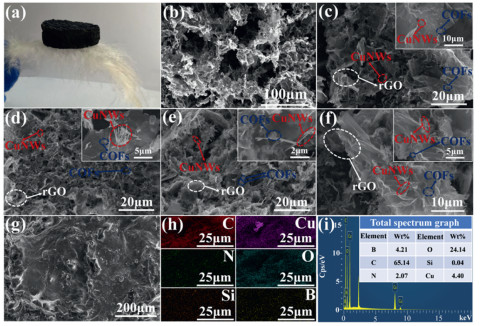
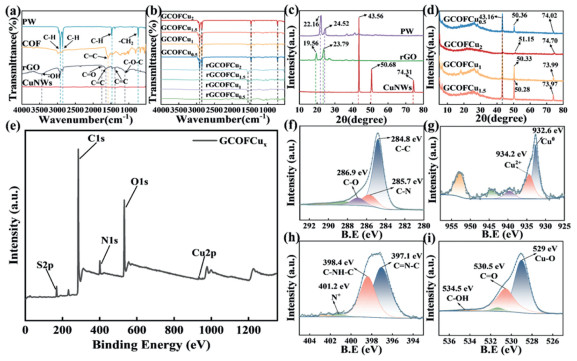
Fig. 3a shows the characteristic peaks of the FT-IR spectra of rGO, COFs, and PW, which correspond to the vibrations of their respective characteristic functional groups [24]. Fig. 3b indicates that the intensity of the 3447 cm-1 peak of rGO in rGCOFCux has weakened, possibly due to the further reduction of GO, while the characteristic peaks of COFs exhibit no obvious shift. The PW-related peaks appear in GCOFCux, confirming that COFs has been successfully loaded, that the composites have been successfully combined with PW, and that their chemical structures remain unchanged. Figs. 3c and d are the XRD spectra of the raw materials and CPCMs. The CPCMs have broad diffraction peaks in the range of 2θ = 20°-30°, corresponding to the π-π stacking of rGO layers [25], with slight deviations in peak heights. These deviations are related to the interactions among components and changes in the crystallization point of PW; except for GCOFCu2, all other samples exhibit characteristic peaks of COFs at 2θ = 5.1° ± 0.1° and 6.74° [26]. No new diffraction peaks are observed, confirming that no chemical reactions occurred during the preparation process. This is attributed to the introduction of high volume fraction CuNWs, which triggered physical effects, resulting in significant weakening or masking of their characteristic peaks. XPS was used to evaluate the chemical bonds on the surface of CPCMs. Fig. 3e shows that the full spectrum has characteristic peaks of C 1s, O 1s, N 1s, S 2p, and Cu 2p, confirming the successful compositing of rGO, CuNWs, and COFs and the formation of a 3D interpenetrating network. In the high-resolution spectrum (Figs. 3f-i), the characteristic peaks of C 1s, O 1s, Cu 2p, and N 1s and the fitting results [27] confirm the effective reduction of GO, the covalent connection of COFs with rGO, the presence of copper in its metallic valence state, and the imine structure of COFs, and the ability of hydroxyl groups to anchor PW through hydrogen bonds and inhibit leakage, as well as the enhanced heat transfer due to the electronic interaction between copper and the carbon framework.
The porous framework matrix determines the effective physical adsorption of the phase change material. The BET analysis of the material’s specific surface area and pore structure is shown in Fig. S1 (Supporting information). All samples exhibit Ⅳ-type H3 adsorption-desorption isotherms, exhibiting a hysteresis loop. This indicates that the samples are mesoporous materials, with characteristics of high porosity and fast adsorption rate. The appearance of the H3-type hysteresis loop also indicates that the materials have a typical slit-like pore structure, which leads to capillary condensation. At this stage, the adsorption capacity increases sharply [28]. Furthermore, the H3-type hysteresis loop also suggests that the four samples have certain voids, which facilitates the subsequent filling of PCMs. As shown in Fig. S2 (Supporting information), rGCOFCu1.5 has the largest specific surface area and pore volume, reaching 17.4567 m2/g and 0.1029 cm3/g, far exceeding the other three samples. In addition, the small mesopores provide a huge adsorption potential field for samples, while the larger mesopores act as capillary channels, jointly preventing the modification material from leaking through the strong capillary force. The contact angle measurement is shown in Fig. S3 (Supporting information). All four samples are hydrophobic materials. Moreover, with the increase in CuNWs content, the contact angle shows a trend of first increasing and then decreasing. Among them, the contact angle of GCOFCu2 drops to 118.7°. This may be attributed to the fact that CuNWs are metallic materials, with a much lower hydrophobicity than rGO and PW. When CuNWs are overloaded, they will excessively fill the network pores, resulting in the originally loose porous structure overly dense. Among the four samples, the contact angle of GCOFCu1.5 is the largest at 126.3°, and its excellent water resistance enhances the stability of the materials in humid environments.
The thermal properties of the samples under cold and hot cycles were analyzed using DSC. As shown in Figs. 4a and b, all CPCMs and PW exhibit corresponding endothermic peaks and exothermic peaks. Increasing the CuNWs loading reduces the porosity of the framework matrix, thereby lowering the mass fraction of PW within the composite. Since CuNWs themselves do not contribute to the phase transition enthalpy, the enthalpy values of CPCMs vary. To further evaluate the cyclic thermal stability of the materials during long-term photothermal conversion and phase change thermal storage processes, DSC measurements were conducted on the GCOFCu1.5 after 50 and 100 photothermal cycles (Fig. 4c), with detailed parameters shown in Table S1 (Supporting information). The melting enthalpy and crystallization enthalpy after 100 photothermal cycles are 165.85 and 166.03 J/g, respectively, showing only a slight decrease compared to the first melting and crystallization enthalpies. Meanwhile, the phase transition temperature shows no obvious deviation and remains stable throughout the cycles. This indicates that GCOFCu1.5 has excellent cyclic thermal stability. Additionally, the thermal stability of the materials was evaluated by thermogravimetric analysis (TGA) (Fig. 4d). The weight loss of pure PW reaches 99.28% at 338 ℃, corresponding to almost complete decomposition; rGO starts to decompose at approximately 110 ℃, with a final weight loss of 98.12%. Below 245 ℃, the samples exhibit slight weight loss owing to water adsorption. From 245 ℃ to 365 ℃, rapid weight loss occurs due to the thermal decomposition of PW and rGO. With increasing CuNWs content, the initial temperature of the rapid weight loss stage of the samples gradually increases. This might be attributed to the high thermal conductivity of CuNWs, which facilitates the even distribution of heat and thereby promotes the formation of a more stable carbon framework. Moreover, the residual carbon content of the samples was higher than that of pure rGO, confirming that the COFs and CuNWs loading enhanced the thermal stability of rGO. To evaluate the shape stability of CPCMs, a leakage test was conducted on the samples (Fig. 4e). The leakage variation during 20 heating-cooling cycles at 75 ℃ is characterized by the leakage rate (Fig. 4f), as defined in Eq. S1 (Supporting information). Compared to other samples, the total leakage rate of GCOFCu1.5 after 20 heating-cooling cycles was the lowest at 3.96%, with almost no leakage after 15 cycles. Additionally, the block-shaped CPCMs did not collapse or cracking, which might be ascribed to the dense internal microstructure of the composite framework. These results demonstrate that GCOFCu1.5 possesses excellent long-term shape stability.
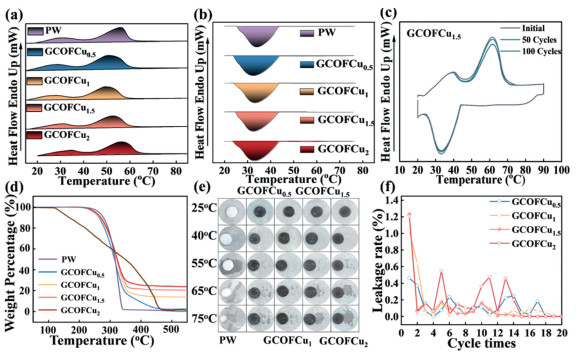
Fig. 5a shows the testing system used to evaluate the photothermal conversion performance. The light intensity is calibrated using RS485. The samples were monitored by J-type thermocouples, and the data acquisition system recorded data every 7 s to capture the temperature rise of GCOFCux within 10 min. To reduce the influence of simulated sunlight irradiation errors on the CPCMs during heating, an averaging algorithm was applied to multiple temperature data points to calculate the basic performance parameters [29]. This test was conducted in an open environment at 30 ℃. Fig. 5b represents the thermal storage and heat dissipation processes of CPCMs during the phase change process. The calculation of parameters, including the total thermal energy storage capacity of the CPCMs, follows the previous research method reported by our group [30]. Detailed calculation equations can be found in Eqs. S2-S7 (Supporting information).
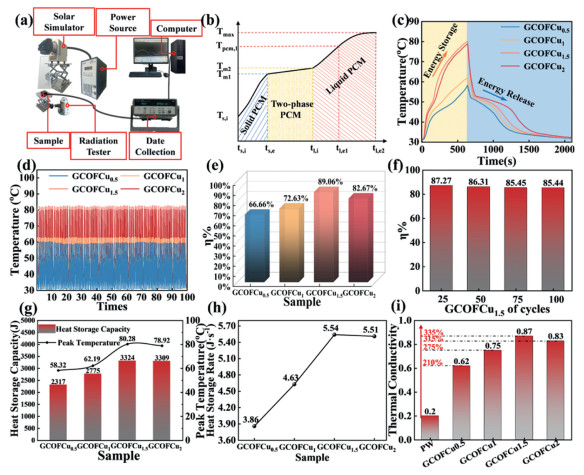
Throughout the entire process, two plateau phases can be clearly observed during heating and cooling (Fig. 5c), which are attributed to the phase transition of PW. The surface temperature of GCOFCu1.5 can reach 80.28 ℃, indicating that it can absorb more heat within the same irradiation time. Moreover, although the maximum temperature of GCOFCu2 is slightly lower than that of GCOFCu1.5, it can still reach 78.92 ℃. However, In the cooling stage, GCOFCu1.5 also exhibits a slightly higher cooling rate than GCOFCu2, revealing its superior temperature regulation capability. The composite material can be used in practical application environments.
To test the thermal stability of the four groups of materials, 100 heating-cooling cycles were carried out (Fig. 5d). It can be seen that the CPCMs with different CuNWs loadings exhibit excellent thermal response stability during the 100 heating-cooling cycles. The photothermal conversion efficiency (η) of the samples are 66.66%, 72.63%, 89.06%, and 82.67% respectively (Fig. 5e). Fig. 5f shows the η tests of GCOFCu1.5 after 25, 50, 75, and 100 heating-cooling cycles. The results indicate that even after 100 cycles, its efficiency still remains 85.44%, demonstrating excellent thermal stability. The thermal storage capacities of the CPCMs are 2317, 2775, 3324, and 3309 J, and their maximum temperatures reach 58.32, 62.19, 80.28, and 78.92 ℃ (Fig. 5g). The storage capacity of GCOFCu1.5 is 143.46% of that of GCOFCu0.5, and its η is 133.60% of that of GCOFCu0.5. Furthermore, the thermal storage rate of GCOFCu1.5 can reach 5.54 J/s (Fig. 5h), indicating that GCOFCu1.5 achieves the optimal balance between high photothermal temperature and cycle stability, and exhibits excellent photothermal conversion performance.
The thermal conductivity of PW and the samples at 20 ℃ was measured by a laser flash thermal conductivity analyzer (Fig. 5i). The thermal conductivity of GCOFCux first increases and then decreases with increasing CuNWs content. When x = 1.5, the thermal conductivity reaches a maximum of 0.87 W m-1 K-1, which is 335% higher than that of pure PW. When x = 2, it decreases to 0.83 W m-1 K-1, still 315% higher than pure PW. A moderate dosage of CuNWs can construct a continuous thermal conduction network together with rGO. In contrast, excessive CuNWs are prone to agglomeration and settlement, which induces structural cracks in the framework, increases interfacial thermal resistance, and consequently reduces thermal conductivity.
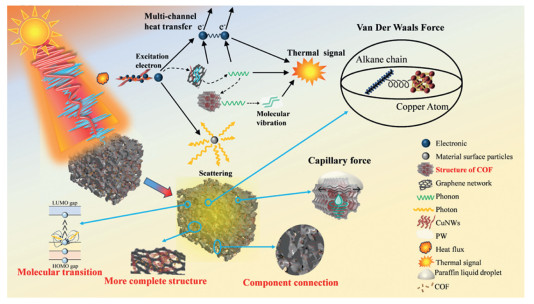
Fig. 6 illustrates the schematic mechanism of the synergistic photothermal effect of COFs and CuNWs on rGO. rGO acts as the fundamental porous framework and possesses intrinsically high thermal conductivity, constructing a macroscopic 3D thermal supporting skeleton. CuNWs serve as one-dimensional thermal conductors, providing interconnected thermal pathways for rGO. They interweave within the rGO skeleton via their bridge-like structure, lowering interfacial thermal resistance and stabilizing the framework. COFs grow on the surface of both components to strengthen interfacial contact with PW. Under light irradiation, incident photons excite the collective oscillation of conduction electrons, generating a locally enhanced electromagnetic field and improving light absorption [31]. Meanwhile, heat transfers from CuNWs to rGO. Heat transfer proceeds via electron transition and non-radiative relaxation. Electrons transition from the highest occupied molecular orbital (HOMO) to the lowest unoccupied molecular orbital (LUMO), effectively converting photon energy into lattice vibration [32,33]. This process transfers energy from free electrons of CuNWs to lattice phonons and realizes electron–phonon interaction. Furthermore, phonon heat in rGO is transmitted to COFs through phonon coupling, followed by outward heat propagation within COFs, achieving phonon–phonon interaction. Therefore, the entire CPCMs exhibits a multi-channel synergistic heat transfer mechanism. In addition, PW is adsorbed into the nanochannels of COFs via capillary force. The high specific surface areas of rGO and COFs facilitate the uniform crystallization of PW [34]. The alkane chains of PW interact with CuNWs through van der Waals forces, lowering thermal resistance, accelerating heat transfer, and effectively suppressing leakage [35].
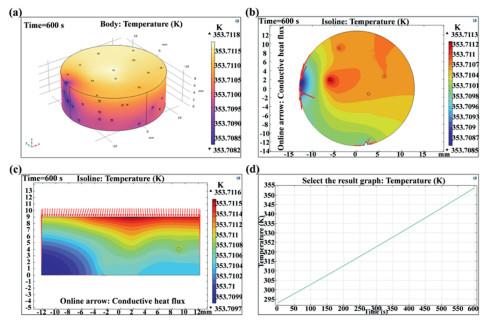
To deeply reveal the heat transfer laws within the microstructure of GCOFCux and the regulatory mechanism of CuNWs content on the heat transfer performance, the finite element method (FEM) of COMSOL was employed to conduct numerical simulations of the coupled process of heat conduction and phase change within the material. The input parameters used included porosity, density ratio, constant-pressure heat capacity, and effective thermal conductivity. For the phase change medium (PW), the relevant parameters were phase change temperature, solid/liquid thermal conductivity, solid/liquid specific heat capacity, and latent heat of phase change. PCMs sub-nodes were added in the PW domain to couple the thermal conduction of the framework with the solid-liquid phase change process. Solid-state heat transfer was dominated by the framework’s thermal conduction, while the phase change process was mainly driven by the absorption and release of latent heat, which regulated the thermal response. The simulation assumed no macroscopic fluid flow within the system, and the results were transient. A constant heat source was applied to the top surface of GCOFCux, while the remaining surfaces were maintained at a constant ambient temperature (293.15 K). The temperature field distribution and phase change evolution process were numerically solved.
Fig. 7a presents the 3D volumetric temperature contour cloud map of GCOFCu1.5. Local low-temperature regions originate from the low thermal conductivity of air trapped in internal micropores, which hinders rapid heat penetration and propagation within the pore structure. Combined with Fig. S4 (Supporting information), the temperature deviations of all four samples are less than 0.01 K (0.0036-0.0077 K). Figs. 7b and c display the cross-sectional and longitudinal-section temperature contours and heat flux vector diagrams of GCOFCu1.5 after heating for 600 s. The heat flux becomes concentrated, forming continuous heat transfer pathways with high heat flux density. Fig. 7d is the temperature-time evolution curve of GCOFCu1.5 during the 600 s heating process. Combined with Fig. S4, GCOFCu1.5 exhibits the fastest heating rate, indicating that when the filler content exceeds 1.5, the enhancement efficiency of thermal conduction enters the saturation stage. Further increasing the filler dosage causes particle agglomeration and fails to further improve the heat transfer rate. In conclusion, GCOFCu1.5 corresponds to the optimal formulation, achieving the maximum thermal conductivity enhancement and superior temperature uniformity. It avoids performance saturation and unnecessary material cost, and shows good consistency with experimental results.
The results of this study are compared with those of other related studies on CPCMs (Fig. S5 in Supporting information) [36-40]. The photothermal properties of the samples are influenced by the type of support framework, microstructure, and modification components. Existing literature indicates that carbon-based frameworks and metal-based materials can effectively improve the η of CPCMs. Based on this, the GCOFCu1.5 successfully fabricated in this study further broadens the research ideas and application scope of this field. The results show that GCOFCu1.5 possesses excellent photothermal conversion performance and good thermal stability, as well as great development potential and broad application prospects in related fields.
In this study, 3D porous rGO was used as the supporting framework to successfully prepare CPCMs with different CuNWs doping ratios. The effects of CuNWs doping contents on the photothermal properties, thermal control behavior, and thermal stability of the prepared CPCMs were systematically investigated. The internal heat transfer characteristics of the CPCMs were revealed via COMSOL finite element simulation. The multi-component CPCMs system constructed in this study achieved synergistic complementarity among all components. The optimized CPCMs exhibited excellent comprehensive performance, with a photothermal conversion efficiency of up to 89%, a thermal conductivity of 0.87 W m-1 K-1, a low phase transition leakage rate, and good thermal reliability. The high heat transfer efficiency within the CPCMs was further confirmed by the COMSOL simulation results. In addition, the photothermal synergistic enhancement mechanism between each component was clarified. In particular, the stability test conducted on the material after three months of exposure to the natural environment revealed that the crystal structure of the material did not undergo any significant changes, and the photothermal conversion efficiency only experienced a slight decline. This comfirms that the material possesses excellent resistance to environmental interference and long-term service reliability (for a detailed analysis, please refer to Supporting information). The prepared CPCMs have broad practical application prospects in solar photothermal energy storage, waste heat recovery, and thermal management of electronic devices, and further broaden the development approaches for efficient photothermal energy storage materials.
Liwei Yang: Writing – original draft, Software, Investigation. Pengfei Chen: Visualization. Jianguo Duan: Writing – review & editing. Huitao Yu: Supervision. Jianguo Cheng: Methodology. Qing Ma: Visualization, Validation.
The authors declare that they have no known competing financial interests or personal relationships that could have appeared to influence the work reported in this paper.
The authors would like to acknowledge the support of the Inner Mongolia Scientific Research Basic Business Foundation (No. 2023QNJS060), the Inner Mongolia Major Science & Technology Innovation Demonstration Project Foundation (No. 2023JBGS0012).
Supplementary material associated with this article can be found, in the online version, at doi:
J. Zhang, L. Lin, Z.Q. Li, et al., Phys. Scr. 100 (2025) 115944. doi: 10.1088/1402-4896/ae1cfa
G.Y. Zeng, Y.H. Li, Y.Z. Xiong, J. Therm. Anal. Calorim. 149 (2024) 13839–13849. doi: 10.1007/s10973-024-13821-1
X.C. Zhou, X. Xu, J.P. Huang, Nat. Commun. 14 (2023) 5449. doi: 10.1038/s41467-023-40988-2
P.Y. Li, Q. Chen, Q.Y. Peng, et al., Pigm. Resin Technol. 50 (2021) 412–418. doi: 10.1108/prt-11-2019-0100
J. Zha, D.L. Feng, M.T. Zhang, et al., J. Energy Storage. 120 (2025) 116456. doi: 10.1016/j.est.2025.116456
L. Gao, X.H. Fan, S.X. Zhang, et al., Thermochim. Acta. 707 (2022) 179095. doi: 10.1016/j.tca.2021.179095
H.B. Kim, M. Mae, Y. Choi, et al., Sol. Energy. 220 (2021) 1006–1015. doi: 10.1016/j.solener.2021.03.059
S. Xiao, X.W. Hu, X.X. Jiang, et al., J. Energy Storage. 49 (2022) 104129. doi: 10.1016/j.est.2022.104129
N. Sheng, Z.H. Rao, C.Y. Zhu, et al., Appl. Therm. Eng. 164 (2020) 114493. doi: 10.1016/j.applthermaleng.2019.114493
S. Kim, S. Hyeong, D.S. Park, et al., Appl. Surf. Sci. 556 (2021) 149763. doi: 10.1016/j.apsusc.2021.149763
Y. Li, X.M. Diao, P.C. Li, et al., Chem. Eng. J. 485 (2024) 149858. doi: 10.1016/j.cej.2024.149858
J.G. Liu, H.S. Qin, Y.L. Liu, Materials 14 (2021) 4757. doi: 10.3390/ma14164757
W. Liu, G. Speranza, ACS Omega 6 (2021) 6195–6205. doi: 10.1021/acsomega.0c05578
Y. Gao, X. Chen, X. Jin, et al., eScience 4 (2024) 100292. doi: 10.1016/j.esci.2024.100292
J.G. Duan, X.S. Yan, K. Lei, et al., J. Energy Storage. 97 (2024) 112778. doi: 10.1016/j.est.2024.112778
Z. Kong, C.Y. Sun, M.Y. Pang, et al., Chin. Chem. Lett. 37 (2026) 111082. doi: 10.1016/j.cclet.2025.111082
W.T. Peng, F.R. Chen, M.C. Lu, Phys. Chem. Chem. Phys. 23 (2021) 20359–20364. doi: 10.1039/d1cp02774c
C.Y. Tsai, M.J. Mullins, C.S. Chang, et al., J. Appl. Polym. Sci. 140 (2023) e53615. doi: 10.1002/app.53615
B. Sun, D. Cui, X.Y. Xu, et al., Colloid. Surf. A 715 (2025) 136659. doi: 10.1016/j.colsurfa.2025.136659
S.S. AlNeyadi, J. Hazard. Mater. Adv. 17 (2025) 100593.
L. Geng, J.P. Wang, X.L. Yang, et al., Chem. Eng. J. 487 (2024) 150749. doi: 10.1016/j.cej.2024.150749
J. Yang, G.Q. Qi, R.Y. Bao, et al., Energy Storage Mater. 13 (2018) 88–95. doi: 10.3390/pharmaceutics10030088
W.X. Luo, M.M. Zou, L.X. Luo, et al., ACS Appl. Mater. Interfaces 14 (2022) 55098–55108. doi: 10.1021/acsami.2c17041
J.M. Cui, Y.X. Chen, W.T. Xu, et al., New Carbon Mater. 40 (2025) 1136–1152. doi: 10.1017/psy.2025.9
Y. Mao, J. Li, X. Yang, et al., J. Energy Storage. 116 (2025) 115803. doi: 10.1016/j.est.2025.115803
X.B. Tong, B.D. Ridenour, A.S. Ridenour, et al., ACS Appl. Nano Mater. 8 (2025) 5815–5828. doi: 10.1021/acsanm.5c00558
H. Kim, I. Song, J. Kim., ACS Appl. Mater. Interfaces 17 (2025) 23155–23164. doi: 10.1021/acsami.4c22819
W.J. Du, R. Ma, Z.Y. Liu, et al., Materials 14 (2021) 3224. doi: 10.3390/ma14123224
F.F. Li, Y.H. Diao, Y.H. Zhao, et al., Energy Convers. Manag. 112 (2016) 395–403. doi: 10.1016/j.enconman.2016.01.039
L.W. Yang, X.S. Yan, J.G. Duan, et al., J. Energy Storage. 141 (2026) 119186. doi: 10.1016/j.est.2025.119186
X.G. Yu, Y.Y. Tian, J. Tong, et al., EnergyChem 8 (2026) 100180. doi: 10.1016/j.enchem.2025.100180
J.H. Bian, L.B. Liao, G.C. Lv, J. Energy Storage. 102 (2024) 114155. doi: 10.1016/j.est.2024.114155
K. Jiao, L. Lu, T. Wen, et al., Chem. Eng. J. 500 (2024) 156498. doi: 10.1016/j.cej.2024.156498
D. Liu, L.R. Fu, H. Jia, et al., Diam. Relat. Mater. 155 (2025) 112265. doi: 10.1016/j.diamond.2025.112265
Z. Tao, W. He, X.L. Xu, et al., Materials 16 (2023) 4878. doi: 10.3390/ma16134878
T.H. Lu, Y. Liu, B.J. Xin, et al., J. Energy Storage. 135 (2025) 118377. doi: 10.1016/j.est.2025.118377
W.X. Luo, X.W. Hu, M.M. Zou, et al., J. Energy Storage. 103 (2024) 114373. doi: 10.1016/j.est.2024.114373
W.J. Chen, L. jiang, X. Hu, J. Energy Storage. 114 (2025) 115751. doi: 10.1016/j.est.2025.115751
P.Y. Li, X.Q. Zou, Y.W. Feng, et al., J. Energy Storage. 132 (2025) 117791. doi: 10.1016/j.est.2025.117791
S.Y. Wu, J.C. Yang, Z.M. Wu, et al., Sol. Energy Mater. Sol. Cells. 296 (2026) 114058. doi: 10.1016/j.solmat.2025.114058

Figure 1 (a) Bionic design concept. (b, c) Flowchart of GCOFCux preparation process. (d) Mechanism of material heat transfer enhancement.

Figure 2 Microscopic morphology of CPCMs. (a) CPCMs placed on the feather. (b) CPCMs pore distribution: (c) rGCOFCu0.5, (d) rGCOFCu1, (e) rGCOFCu1.5, (f) rGCOFCu2, (g) GCOFCu1.5. (h) Element distribution map of rGCOFCu1.5. (i) Total spectrum of distribution map of rGCOFCu1.5.

Figure 3 (a) FT-IR spectra of PW, COFs, rGO, and CuNWs. (b) FT-IR spectra of GCOFCux and rGCOFCux. (c) XRD patterns of PW, rGO, and CuNWs. (d) XRD pattern of GCOFCux. (e-i) Full-spectrum scanning diagrams of rGCOFCu1.5 and characteristic photoelectron peaks of C 1s, O 1s, Cu 2p, and N 1s.

Figure 4 (a) DSC endothermic curve. (b) DSC exothermic curve. (c) DSC curves of GCOFCu1.5 after different number of cycles. (d) TG test curve. (e) Digital photos of the stability of GCOFCux at different temperatures. (f) PW leakage situation of GCOFCux after 20 cycles.

Figure 5 (a) Schematic diagram of the photothermal testing system. (b) Schematic diagram of the phase change thermal storage process. (c) Time-temperature curves of the single group heating and cooling process of GCOFCux. (d) Temperature curves of GCOFCux after 100 photothermal cycles. (e) Photothermal conversion efficiency of GCOFCux. (f) Photothermal conversion efficiency of GCOFCu1.5 after 25, 50, 75 and 100 heating-cooling cycles. (g) Thermal storage capacity and maximum heating temperature of GCOFCux. (h) Thermal storage rate of GCOFCux. (i) Thermal conductivity of GCOFCux.

Figure 6 The synergistic enhancement mechanism of COFs and CuNWs on the photothermal conversion of rGO.

Figure 7 (a) 3D temperature cloud map of GCOFCu1.5. (b) Cross-sectional temperature contours and heat flux vector diagram after 600 s heating. (c) Longitudinal-section temperature contours and heat flux vector diagram after 600 s heating. (d) Temperature-time evolution curve during 600 s of heating.

 扫一扫看文章


扫一扫关注我们
 DownLoad:
 下载:
 下载: