Table 1.
Molecular descriptors of COFs.

Accelerated discovery of descriptors of covalent organic frameworks as photocatalysts via synergistic high-throughput DFT/TD-DFT and machine learning
Yonghong Tao , Yulin Wen , Kanghui Xiong , Qingji Wang , Jia Ren , Xianjun Lang , Xu Li


Photocatalysts can directly harness solar energy to drive chemical processes that address critical challenges in environmental remediation and renewable energy (e.g., pollutant degradation, organic transformation, and water splitting) [1–3]. The discovery of efficient, stable, and low-cost photocatalysts that enable effective charge carrier separation and transfer is central to progress in this field, as these properties are essential for achieving high performance [4]. Covalent organic frameworks (COFs), a class of porous crystalline materials, have recently attracted considerable interest as versatile photocatalysts [5]. The tunable electronic structure and well-defined structure-property relationship of COFs are key enablers for the rational design of high-performance photocatalysts [6].
COFs are constructed from lightweight elements (e.g., C, H, O, N) via strong covalent linkages—such as imine and boronate ester bonds—resulting in highly ordered pores, high specific surface areas, and predictable structures [7,8]. Owing to these features, the incorporation of electron donor (D) and/or acceptor (A) units proves pivotal for enhancing photogenerated charge carrier separation and charge transfer in COFs [9,10]. Besides, COFs can harness light across a broad spectrum, making them particularly promising as visible light photocatalysts [11,12]. Despite the considerable promise, the development and application of COFs as photocatalysts still face substantial challenges. The synthesis of COFs is highly sensitive to experimental conditions, where even minute deviations can lead to significant variations in crystallinity, porosity, and defect [13,14]. Furthermore, the electronic structure is largely dictated by the selection of D/A units and the nature of the covalent linkages [15,16]. Such complexity consigns COF design largely to trial-and-error, considerably stalling accelerated progress and limiting transformative advance.
To address this challenge, density functional theory (DFT) and time-dependent DFT (TD-DFT) have emerged as powerful computational approaches for elucidating structure-property relationships of COFs [17–19]. DFT calculations probe the ground-state electronic structure and orbital distribution, while TD-DFT extends the analysis to excited states, enabling the simulation of ultraviolet-visible (UV-vis) absorption, charge carrier separation, and charge transfer [20]. These calculations can guide the rational design of COFs at the molecular level and offer a fundamental understanding of charge dynamics [21]. In our previous work, we established a set of qualitative and quantitative descriptors to characterize the optoelectronic properties of D-π-A COFs [22]. By using TD-DFT calculations, we derived key descriptors, such as the charge transfer index, that provide an accurate assessment of electron-hole separation [23,24]. Through precise calculations of these descriptors, we successfully established a relationship linking molecular structure to macroscopic performance [25].
However, high-throughput screening using DFT/TD-DFT is limited by high computational costs and challenges in modeling variable-sized structures. Recently, machine learning (ML) has become a powerful tool for accurately predicting the chemical and physical properties of materials [26,27]. By leveraging data-driven strategy, ML establishes key correlations between structural features and target properties, greatly accelerating the development of advanced materials [28]. A deep integration of ML with the research on metal-organic frameworks and COFs is driving a paradigm shift in material development [29]. In this vein, we established an ML mapping between catalyst nucleophilicity and ring-opening reactivity using descriptors derived from DFT calculations [30]. Furthermore, a quantitative structure-activity relationship (QSAR) model was employed to elucidate the charge transfer dynamics in the D-A architectures, predicting their potential in flexible electronics [30,31]. High-throughput computational screening successfully predicted 21 stable perovskites, 14 of which were newly reported, expanding the candidate materials for optoelectronics and catalysis [32]. A neural evolution ML potential was developed in combination with dynamics simulations of ionic COFs to investigate the thermal conductivity [33]. The crucial role of charge transfer is demonstrated using ML models in the reaction of C–H bond activation over two-dimensional metal-organic monolayers [34]. Importantly, an artificial intelligence-assisted iterative experimental learning cycle was implemented to screen and identify COFs for fluorescent from 520 candidates [35]. The principle of molecular orbital energy matching is embedded into the workflow of ML, thereby establishing a new paradigm for knowledge-guided development.
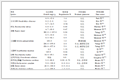
To the best of our knowledge, the integration of DFT/TD-DFT with ML to establish a QSAR model for COFs as photocatalyst remains to be explored thoroughly. To address this issue, we employ a data-driven strategy to identify the critical chemical descriptors of COFs as photocatalysts. By extracting a set of quantum chemical descriptors derived from DFT/TD-DFT calculations, we develop a QSAR model that correlates the structures via the optoelectronic properties to establish a structure-performance relationship of COFs. Although various molecular descriptors have been investigated using ML in materials science, conventional physical descriptors often prove insufficient for elucidating clear structure-performance relationships in complex systems like COFs. To identify the key descriptors governing performance, we introduce a set of 22 quantum chemical descriptors derived from DFT/TD-DFT calculations. These descriptors are grouped into three categories—polarity [36], energetics [37], and excited states [38]—as summarized in Table 1.
 DownLoad:
CSV
| No | Name | Description (unit) |
| 1 | Sur | Overall surface area (Å2) |
| 2 | S | Estimated density according to mass and volume (M/V in Å3) |
| 3 | MPI | Molecular polarity index |
| 4 | µex | Dipole moment at excited state (D) |
| 5 | ELUMO | Energy of LUMO orbital (eV) |
| 6 | EHOMO | Energy of HOMO orbital (eV) |
| 7 | Egap | Energy difference between the HOMO and LUMO (eV) |
| 8 | Eex | Excitation energy (eV) |
| 9 | IP | Ionization potential (eV) |
| 10 | EA | Electron affinity (eV) |
| 11 | λmax | Maximum UV-vis absorption wavelength (nm) |
| 12 | f | Oscillator strength |
| 13 | Sr | Overlap integral of Sr function |
| 14 | t | Degree of separation between hole and electron |
| 15 | CTE | Charge transfer efficiency (e) |
| 16 | D | Centroid separation distance (Å) |
| 17 | H | Overall mean distribution breadth of electron and hole |
| 18 | EDI | Electron delocalization index |
| 19 | HDI | Hole delocalization index |
| 20 | GHI | Ghost-hunter index |
| 21 | CT% | Apparent charge transfer percentage (%) |
| 22 | LE% | Apparent local excitation percentage (%) |
Details regarding the interpretation and calculations of the molecular descriptors are provided in Supporting information. Here, we derived the molecular descriptors for each COF from DFT/TD-DFT calculations. Within the constraints of our computational resources, we collected 100 COFs from the literature and processed them through a workflow of high-throughput DFT/TD-DFT and ML. As illustrated in Fig. 1a, the workflow consists of four key steps: Data collection, DFT/TD-DFT calculation, model evaluation, and model interpretation. A series of descriptors was employed to systematically assess the COFs. These include the energy levels of the frontier molecular orbitals (FMOs), specifically the EHOMO and ELUMO. The IP and EA provide essential insights into redox thermodynamics, while the λmax serves as a reliable indicator of light-harvesting capability. Together, these five target descriptors form a coherent theoretical basis for evaluating and predicting the performance of COFs.
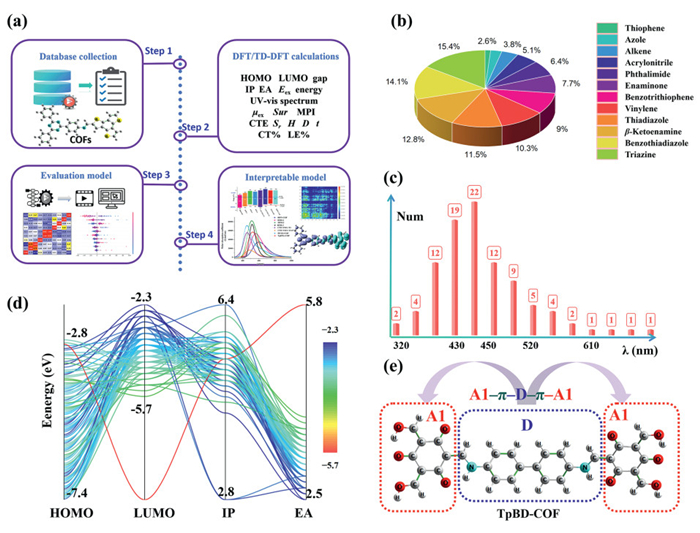
To enhance the generalizability of the ML models, we compiled a database encompassing 12 common types of COFs based on the functional building blocks (Fig. 1b). The database comprises 100 COFs featuring D-π-A architectures. The statistical distribution of λmax across this database is shown in Fig. 1c, while Fig. 1d presents the value distributions of the other four target descriptors: EHOMO, ELUMO, IP, and EA. Finally, TpBD-COF as a representative example is presented in Fig. 1e to illustrate the constructed theoretical model. This workflow establishes a data-driven strategy that provides a theoretical foundation to elucidate structure-performance relationships for the accelerated discovery of COF photocatalysts.
Each COF was modeled in molecular simulation software and then converted to its SMILES notation by generating its 3D structure with OpenBabel [39]. Since the chemical descriptors of COFs are inherently determined by their building blocks and D-π-A architectures, we incorporated a diverse range of common functional organic building blocks into the database, such as triazine, benzotrithiophene, β-ketoenamine, thiazole, and benzobisthiazole, while explicitly excluding COFs containing metallic elements. The SMILES strings corresponding to the 100 COFs are provided in Table S1 (Supporting information). Theoretical models of COFs were constructed based on a complete and independent D-A unit. Geometry optimizations in the ground state were performed using the M06L functional [40,41] with the 6–31+G(d) basis set in an aqueous environment. Frequency calculations at the same level confirmed that each optimized structure corresponds to a local minimum, with no imaginary frequencies. DFT/TD-DFT calculations employed the SMD continuum solvation model [42] with water as the solvent, consistent with the aqueous reaction conditions. Single-point energy calculations were carried out at the 6–31+G(d,p) level. TD-DFT calculations considered the first three excited states and simulated UV-vis absorption spectra using the maximum f. The UV-vis absorption and FMOs for all COFs were analyzed at the M06L/6–31+G(d) level. All quantum chemical calculations were performed using Gaussian 09 [43].
To identify the key descriptors of COFs as photocatalysts, this work focused on five target ones: EHOMO, ELUMO, IP, EA, and λmax. Specifically, the EHOMO and ELUMO define the thermodynamic driving force for redox reactions by determining the oxidation potential of photogenerated holes and the reduction potential of photogenerated electrons, respectively. The IP and EA directly quantify the intrinsic propensity for electron loss and gain, reflecting its fundamental redox characteristics. Meanwhile, λmax serves as a critical indicator of visible light absorption. Collectively, these five target descriptors enable a comprehensive evaluation of COFs as photocatalysts.
The correlation between the performance of COFs and their molecular descriptors was evaluated using eight ML models. The details of the ML algorithms are provided in Supporting information. The Pearson correlation coefficient [44] was used to identify key descriptors affecting the performance of COFs. Each ML model was evaluated using the cross-validation correlation coefficient (R2) score to mitigate overfitting. Following numerical hyperparameter optimization, model suitability was quantified using the mean absolute error (MAE) and root mean square error (RMSE), thereby ensuring generalizability and practical applicability.
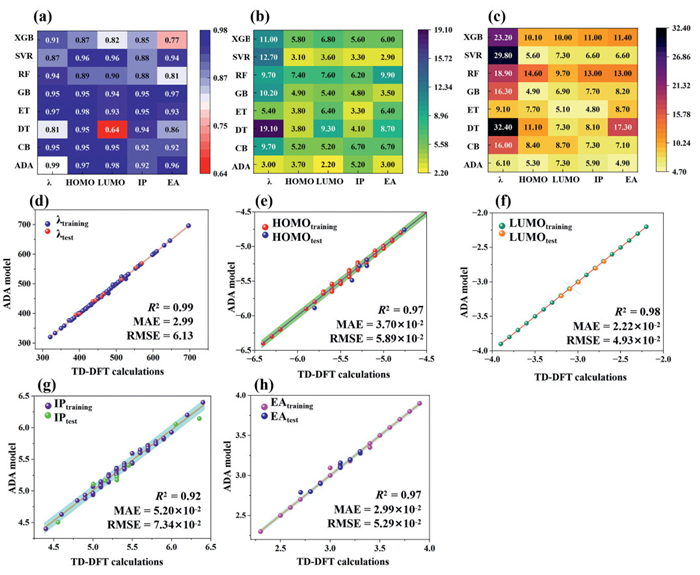
We evaluated eight ML algorithms for their predictive performance on five key descriptors of COFs: λmax, EHOMO, ELUMO, IP, and EA. Evaluation was based on the average R2, MAE, and RMSE values obtained from ten-fold cross-validation, as summarized in Figs. 2a–c. The AdaBoost model demonstrated strong fitting capability across five target descriptors, with R2 values exceeding 0.92. It performed particularly well for ELUMO and λmax, achieving the highest R2 (0.98 and 0.99) along with the lowest MAE (2.20 × 10⁻² eV and 3.00 nm) and RMSE (7.30 × 10⁻² eV and 6.10 nm) among all models. The Gradient Boosting (GB) model exhibited exceptional accuracy for EA, with R2 values of 0.97, the lowest MAE (3.50 × 10⁻² eV) and RMSE (8.20 × 10⁻² eV), respectively. The Extra Trees (ET) model also delivered high predictive accuracy for EHOMO and IP values. Considering overall performance in terms of R2, MAE, and RMSE across all five descriptors of COFs, the AdaBoost model not only achieved high R2 values but also consistently exhibited lower errors, underscoring its robust predictive accuracy. Consequently, the AdaBoost model was selected for further validation. Table S1 compares the TD-DFT calculated values with AdaBoost model predictions for the five target descriptors across 97 COFs. To validate the robustness of the AdaBoost model, we also performed a Y-randomization test; further details are provided in Supporting information. Consistency plots in Figs. 2d–h compare AdaBoost predictions against TD-DFT benchmarks, with the x-axis representing TD-DFT results and the y-axis representing the AdaBoost model predictions. In Fig. 2d, blue and red dots denote training and test data for λmax, respectively. Similarly, different colors distinguish training and test sets in Figs. 2e–h. The sparsity of data points arises from multiple COFs having identical values for EHOMO, ELUMO, IP, and EA, resulting in overlapping data points. Nevertheless, the AdaBoost model demonstrates excellent predictive accuracy across five target descriptors of COFs, and the strong linear correlations observed indicate high consistency with TD-DFT references. Based on these results, the AdaBoost model was subsequently used to analyze QSAR model outcomes and explore the influence on the five target molecular descriptors of COFs.
In order to gain a deeper understanding of the relationship between descriptors and the performance of COF photocatalysts, we employed the recently developed Shapley Additive Explanations (SHAP) analysis [45] to interpret the QSAR models. As such, we identified ten key descriptors from the initial set of 22 descriptors for each of the five target descriptors. As shown in Figs. 3a–e, the SHAP analysis plots depict the top 10 descriptors for each target descriptor on the y-axis versus their impact (SHAP values) on the x-axis. A color scale ranging from blue (low) to red (high) represents the feature values. A positive SHAP value signifies that the feature increases the predicted output; conversely, a negative value signifies a decrease.
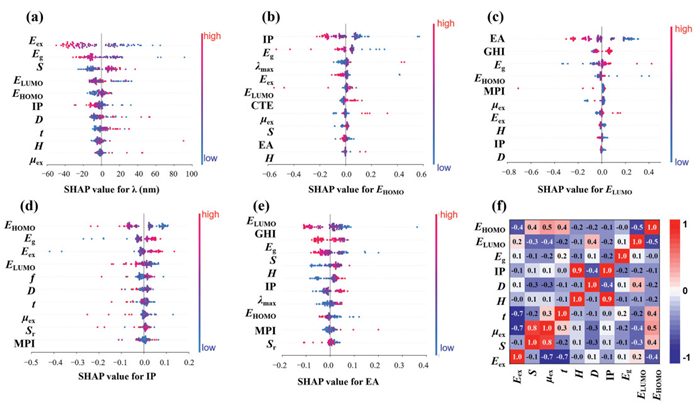
The top ten most significant descriptors vary across different target ones, highlighting their distinct roles in determining each performance. It is well known that the wavelength (λ) exhibits a strong linear relationship with its energy (E), defined by the equation E = hc/λ. Consequently, as shown in Fig. 3a, it is evident that the Eex and Egap play a crucial role in determining the λmax. Beyond energy, other descriptors, such as S, are important for promoting charge separation. This enhanced separation further facilitates the generation of photoinduced electrons, thereby improving overall efficiency. Furthermore, a decrease in ELUMO or an increase in EHOMO leads to a red shift in λmax (positive SHAP direction), which is fully consistent with previously reported TD-DFT calculations [23,24]. Similarly, a lower IP and a greater D favor a red shift in λmax. In contrast, descriptors including the H, t, and μex have a negligible impact on performance, as evidenced by their SHAP values concentrating near zero. In general, to enhance the utilization of long-wavelength light for COF catalysts, the molecular design strategy should aim to increase EHOMO and decrease ELUMO, thereby narrowing Egap. Based on the SHAP analysis results presented in Figs. 3b and c, the following conclusions can be drawn: Lowering the IP value to raise EHOMO, improving the capability of COFs to drive reduction reactions, such as the hydrogen evolution reaction. Conversely, to facilitate the oxygen reduction reaction, a high EA value and a low ELUMO are required. Figs. 3d and e depict the analysis of descriptors influencing IP and EA. These critical descriptors contribute in two primary aspects: One is governed by electronic structures, including the Sr, H, and t; the other is related to polarity and spatial distribution, such as S, μex, MPI, and D. By tuning these descriptors, the structures of COFs can be optimized, thereby improving performance.
The relationships between other key descriptors and λmax, EHOMO, ELUMO, IP, and EA of COFs were evaluated using Pearson correlation coefficients (r). A heatmap illustrating the correlations of these descriptors with respect to λmax is presented in Fig. 3f, while corresponding heatmaps for the other four target ones, including EHOMO, ELUMO, EA, and IP, are provided in Fig. S1 (Supporting information). Systematic analysis of the correlation matrices reveals distinct patterns between the descriptors and the target ones. Taking Fig. 3f as an example, it visually demonstrates the correlation between 10 key descriptors and λmax. Concerning the optical properties of COFs, λmax shows a strong negative correlation with Eex (r = −0.92) and a positive correlation with the polarizability descriptor S (r = 0.42). Regarding electronic structure, IP is highly negatively correlated with EHOMO (r = −0.70), indicating that a higher EHOMO facilitates electron loss. Similarly, EA exhibits a strong negative correlation with ELUMO (r = −0.91), consistent with the expectation that a lower ELUMO promotes electron capture. Meanwhile, EHOMO is strongly negatively correlated with Egap (r = −0.70), whereas ELUMO is strongly positively correlated (r = 0.79), underscoring the close coupling between Egap and FMOs (Figs. S1a–d). Notably, Egap shows significant correlations with all five target properties, with coefficients of −0.36 (λmax), −0.70 (EHOMO), 0.79 (ELUMO), −0.58 (EA), and 0.27 (IP). This result indicates that Egap serves as a key descriptor bridging photophysical properties and electronic structures, underscoring its importance in multi-target molecular design and structure-property modeling. In contrast, descriptors such as GHI, CTE, μex, and Sr exhibit weak correlations (|r| < 0.1) with most target descriptors, suggesting their limited direct influence on the electronic structures considered here. However, these descriptors may still relate to electron-hole distribution in COFs that can play a role in detailed excited state or charge transfer dynamics. In essence, this correlation analysis identifies key descriptors associated with λmax, EHOMO, ELUMO, IP, and EA of COFs, with Egap emerging as a common link across multiple descriptors.
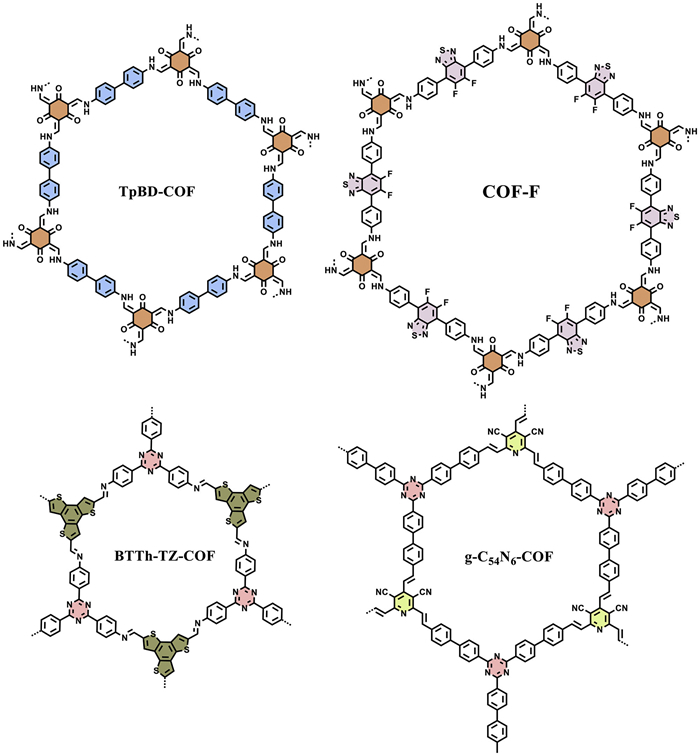
A clear interpretation of ML results is crucial. In this work, we elucidated the significance of key descriptors and interpret the QSAR model by analyzing four representative COFs: TpBD-COF [11,46], COF-F [47], BTTh-TZ-COF [48], and g-C54N6-COF [49], which have been widely investigated as photocatalysts. The structural representations of four COFs are shown in Fig. 4. These COFs exemplify the β-ketoenamine, benzothiadiazole, benzotrithiophene, and vinylene structural types, respectively. The TD-DFT calculated values of key descriptors are summarized in Table S2 (Supporting information), while Fig. 5 presents the corresponding visualizations, including FMOs, charge density difference (CDD), charge transfer integrals (CRCT), and transition density matrix (TDM) plots. The CDD plot reveals distinct spatial charge redistribution patterns, where blue and purple isosurfaces correspond to a decrease and an increase in electron density upon photoexcitation, respectively. Concurrently, the CRCT plot employs green and blue ellipsoids to directly visualize the spatial distributions of holes and electrons in the excited states. TDM analysis further highlights variations in intramolecular charge transfer.
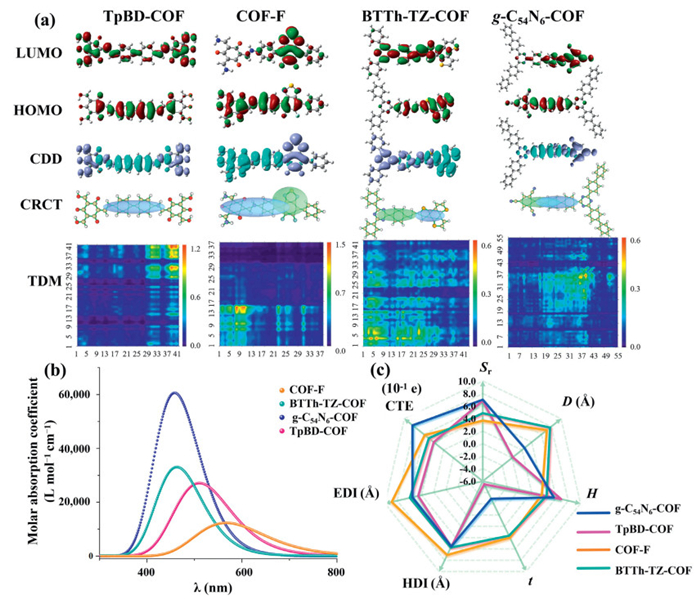
As shown in Fig. 5a, the four COFs exhibit typical D-π-A architectures, while the spatial localization of their FMOs distinctly influences their charge transfer pathways. For instance, in TpBD-COF, the HOMO (–5.2 eV in Table S2) is highly localized on the biphenyl group (i.e., D), while the LUMO (–3.0 eV in Table S2) is comparatively delocalized in whole the framework. Owing to the high symmetry, the charge transfers from both sides toward the 1,3,5-triformylphloroglucinol groups (i.e., A) via the imine π-bridge. The polarity (μex = 12.3 D in Table S2) of TpBD-COF is the highest in the excited state among the four COFs. In contrast, the LUMO of COF-F is highly localized on the benzothiadiazole unit (i.e., A), resulting in a strongly directional donor to acceptor (D→A) charge transfer. These results underscore the synergistic role of D-A architecture and π-bridge connectivity in governing charge transfer dynamics. Among the four COFs, the CRCT plot of BTTh-TZ-COF clearly demonstrates effective separation between holes and electrons. In contrast, TpBD-COF exhibits a higher degree of electron-hole overlap due to its highly symmetrical A-D-A' structure, whereas COF-F and g-C54N6-COF show partial overlap. Correspondingly, the TDM map of TpBD-COF displays strong diagonal signals, indicating predominant charge localization within the D units and π-bridge regions. In COF–F and BTTh–TZ-COF, pronounced off-diagonal signals emerge at the D-A units, signifying enhanced charge transfer. In g–C54N6-COF, off-diagonal signals dominate across the map, reflecting extensive charge delocalization. Collectively, these observations systematically confirm that the D-π-A architectures regulate channels for charge carrier dissociation and charge transfer.
The UV-vis absorption spectra of the four COFs were simulated using TD–DFT at the M06/L/6–31+G(d) level in an aqueous environment, as shown in Fig. 5b Key optical parameters, including f, λmax, Eex, CT%, and LE%, are summarized in Table S2. Both λmax, CT%, and LE% directly reflect the strength of D-A interaction. COF–F exhibits the most pronounced redshift (λmax = 565.0 nm), corresponding to the lowest Eex value (2.2 eV), which can be attributed to the strong electron-withdrawing effect of its F-substituted A unit. Notably, COF–F also shows the highest LE% (40.1%), indicating that its excited state contains a significant contribution from localized π-π* transitions. In contrast, g-C54N6-COF, featuring a CN group and vinylene π-bridge, displays a blueshift (λmax = 451.2 nm) and possesses the highest CT% (70.7%), suggesting efficient charge transfer owing to extended sp2-carbon conjugation and delocalization.
A series of quantitative descriptors derived from TD-DFT calculations to characterize charge separation in the COFs is listed in Table S2. The Sr quantifies the spatial overlap between holes and electrons, where a higher Sr value indicates stronger overlap and less efficient charge separation. Consistent with the CRCT plots, TpBD-COF and g-C54N6-COF exhibit significant spatial overlap with a relatively high Sr value of 0.7. The t-index describes the degree of spatial charge separation. The negative t value (−5.5) in TpBD-COF suggests ineffective charge separation, which can be attributed to its symmetrical structure, as shown in the CRCT and CDD maps. The d-index represents the distance between the centroids of hole and electron distributions, while the H-index reflects their overall spatial delocalization extent. In BTTh-TZ-COF, the relatively high D (7.7 Å) and H (4.5 Å) values reflect pronounced spatial charge separation, resulting from the distinct electronic nature of the electron-rich benzotrithiophene and electron-deficient triazine. Smaller values of HDI and EDI correspond to greater delocalization of holes and electrons, respectively, indicating more uniform spatial distributions. TpBD exhibits low HDI and EDI values (5.6 Å and 4.6 Å), signifying highly delocalized charge carriers. BTTh-TZ-COF displays the highest CTE value (0.8 e), which is consistent with high CT% (70%), confirming facilitated by the alkene π-bridge.
IP and EA govern the redox capabilities of the materials. COF–F exhibits the lowest EA (3.0 eV), which facilitates electron capture and correlates with its pronounced redshift in the UV-vis absorption. In contrast, g–C54N6-COF possesses the highest EA (3.4 eV) and IP (5.6 eV), indicating strong reduction capability accompanied by a relatively high hole-injection barrier. For ideal COF photocatalyst, coordinated optimization is essential: A narrow Egap/Eex enables UV-vis absorption spectral redshift; suitably matched IP and EA values provide the necessary thermodynamic driving force; and efficient charge separation and transport, as characterized by high CT%, low Sr, large D, positive t, and large CTE, should be simultaneously achieved, as shown in Fig. 5c.
Based on the aforementioned theoretical results, we propose the following general framework for the design of high-performance COF photocatalysts. These principles aim to guide the efficient design of novel materials by elucidating the intrinsic relationship between microscopic electronic structure and optoelectronic properties. Controlling the electronic structure of COFs to optimize light absorption and thermodynamic driving force is essential. Electron-withdrawing groups (e.g., F and CN) or extended π-conjugated systems (sp2-carbon linkage) can be introduced to finely tune the energy levels of the FMOs. A narrower Egap results in a redshift UV-vis absorption, enhancing visible light absorption. Simultaneously, IP and EA can be adjusted to align with the thermodynamic requirements of target redox reactions, such as the hydrogen evolution reaction. D-π-A architectures with strong electron push-pull effect should be incorporated within the COFs. Structural asymmetry can be employed to disrupt charge distribution balance and promote charge transfer. Key descriptors, including a high CT%, low Sr, large D, positive t, and large CTE, can quantify charge separation efficiency. In general, an ideal COF photocatalyst should meet integrated criteria of broad absorption spectrum, appropriate energy-level alignment, efficient charge separation, and rapid charge transport. Therefore, we propose a computation-guided, data-driven workflow of rational design: First, computational screening of promising building units; second, evaluation of charge-separation parameters using theoretical tools; and finally, integration of electronic structure visualization to gain insights. This strategy provides a clear, quantitative method of rational design for experimental synthesis and significantly reduces both uncertainty and cost associated with discovery of COF photocatalysts.
In summary, we have established a data-driven strategy for the development of COFs as photocatalysts via synergistic DFT/TD-DFT calculations and ML models. We adopted five target descriptors: λmax, EHOMO, ELUMO, IP, and EA as the theoretical foundation to map the performance of COFs as photocatalysts. A total of 22 molecular descriptors derived from DFT/TD-DFT were considered to elucidate the relationship between the electronic structures of COFs and their performance. Eight different ML algorithms were applied systematically assessed to establish QSAR prediction models. The ML results showed that the AdaBoost model exhibits the optimal performance for predicting all five target descriptors of COFs, achieving R2 over 0.92. Notably, for predicting λmax, the R2 reached as high as 0.99, with MAE of 2.13 nm and RMSE of 6.99 nm, indicating excellent accuracy. Pearson correlation coefficient and SHAP analysis identified the significant descriptors influencing the performance of COFs. The key descriptors associated with each target were identified, in which Egap links to multiple descriptors. Four representative COFs were used to demonstrate the significance of these descriptors and to interpret the QSAR model. Through the visual graphics of CDD, CRCT, and TDM plots, we illustrated the relationship between hole-electron characteristics and the target descriptors of COFs. Our results also reveal that, for the rational design of photocatalysts, COF should simultaneously possess a narrow Egap/Eex to enable a redshift in the UV-vis absorption spectrum; suitably matched IP and EA values to provide the necessary thermodynamic driving force; and efficient charge separation and transfer, as characterized by high CT%, low Sr, large D, positive t, and large CTE. Accordingly, the design principles for high-performance COFs photocatalysts should focus on finely tuning the electronic structure by constructing asymmetric D-π-A architectures, introducing electron-withdrawing or donating groups, or extending π-conjugated systems, enabling broad light absorption, efficient charge separation, and rapid charge transfer. This work establishes a data-driven strategy that integrates DFT/TD-DFT calculations with ML models to reveal the key descriptors of COFs for the rational design of high-performance photocatalysts through high-throughput screening.
Yonghong Tao: Writing – original draft, Investigation, Formal analysis. Yulin Wen: Investigation, Formal analysis. Kanghui Xiong: Writing – review & editing. Qingji Wang: Supervision, Conceptualization. Jia Ren: Funding acquisition. Xianjun Lang: Writing – review & editing, Supervision, Funding acquisition. Xu Li: Writing – review & editing, Supervision, Funding acquisition, Conceptualization.
The author declare that they have no known competing financial interests or personal relationships that could have appeared to influence the work reported in this paper.
This work was supported by the National Natural Science Foundation of China (Nos. 21905053, 62463003, and 22372124), the Education Department of Hainan Province (No. Hnjg2026ZC-23), and the Innovation Center of Academician Shigang Sun’s Team in Hainan Province.
Supplementary material associated with this article can be found, in the online version, at doi:
J. Nowotny, J. Dodson, S. Fiechter, et al., Renew. Sustain. Energy Rev. 81 (2018) 2541–2551. doi: 10.1016/j.rser.2017.06.060
S. Nishioka, F.E. Osterloh, X.C. Wang, et al., Nat. Rev. Methods Primers 3 (2023) 42. doi: 10.1038/s43586-023-00226-x
X.H. Yi, H.Y. Chu, C.Y. Wang, et al., Chin. Chem. Lett. 37 (2026) 112243. doi: 10.1016/j.cclet.2025.112243
M. Sohail, S. Rauf, M. Irfan, et al., Nanoscale Adv. 6 (2024) 1286–1330. doi: 10.1039/d3na00442b
Y.Z. Chen, D.L. Jiang, Acc. Chem. Res. 57 (2024) 3182–3193. doi: 10.1021/acs.accounts.4c00517
T. Yang, D. Zhang, A.G. Kong, et al., Angew. Chem. Int. Ed. 63 (2024) e202404077. doi: 10.1002/anie.202404077
C.S. Diercks, O.M. Yaghi, Science 355 (2017) eaal1585. doi: 10.1126/science.aal1585
R.C. Shen, C. Huang, L. Hao, et al., Nat. Commun. 16 (2025) 2457. doi: 10.1038/s41467-025-57662-4
J. Chen, X.T. Zhang, X.Y. Cai, et al., Adv. Funct. Mater. 35 (2025) 2505453. doi: 10.1002/adfm.202505453
X.Y. Yao, N. Han, H. Liu, L.B. Xing, Chin. Chem. Lett. 37 (2026) 111426. doi: 10.1016/j.cclet.2025.111426
K.H. Xiong, Y.X. Wang, F.L. Zhang, et al., Appl. Catal. B 322 (2023) 122135. doi: 10.1016/j.apcatb.2022.122135
L.Y. Yao, S.N. Liu, L. Li, et al., CCS Chem. 6 (2024) 1721–1730. doi: 10.31635/ccschem.023.202303175
S. Daliran, A.R. Oveisi, A. Dhakshinamoorthy, H. Garcia, ACS Appl. Mater. Interfaces 16 (2024) 50096–50114. doi: 10.1021/acsami.4c12069
S. Daliran, M. Blanco, A. Dhakshinamoorthy, et al., Adv. Funct. Mater. 34 (2024) 2312912. doi: 10.1002/adfm.202312912
Y. Qian, H.L. Jiang, Acc. Chem. Res. 57 (2024) 1214–1226. doi: 10.1021/acs.accounts.4c00061
X.B. Yang, Q. Xu, W. Wei, G.F. Zeng, Angew. Chem. Int. Ed. 64 (2025) e202504355. doi: 10.1002/anie.202504355
J.Q. Dong, X. Li, K. Zhang, et al., J. Am. Chem. Soc. 140 (2018) 4035–4046. doi: 10.1021/jacs.7b13069
J.Q. Dong, X. Li, S.B. Peh, et al., Chem. Mater. 31 (2019) 146–160. doi: 10.1021/acs.chemmater.8b03685
M.X. Ran, X. Zhang, J. Lin, et al., J. Mater. Chem. A 13 (2025) 1123–1134. doi: 10.1039/d4ta06978a
X.X. Zhang, X. Li, L. Li, T. Shi, J. Mol. Liq. 411 (2024) 125691. doi: 10.1016/j.molliq.2024.125691
D.J. Cao, C.T. Gong, Y.K. Han, et al., Angew. Chem. Int. Ed. 64 (2025) e202516908. doi: 10.1002/anie.202516908
X. Li, X.X. Zhang, Y.K. Deng, et al., Mater. Chem. Phys. 347 (2026) 131411. doi: 10.1016/j.matchemphys.2025.131411
X. Li, K.X. Ma, R.X. Lu, et al., Comput. Theor. Chem. 1255 (2026) 115567. doi: 10.1016/j.comptc.2025.115567
X. Li, Y. Niu, K.X. Ma, et al., Catalysts 15 (2025) 647. doi: 10.3390/catal15070647
X. Li, M. Li, G.J. Wu, et al., ChemPhysChem 26 (2025) e202500612. doi: 10.1002/cphc.202500612
X. Jiang, H.D. Fu, Y. Bai, et al., Adv. Funct. Mater. 35 (2025) 2507734. doi: 10.1002/adfm.202507734
C.X. Cui, Y. Shen, J.R. He, et al., J. Am. Chem. Soc. 146 (2024) 34551–34559. doi: 10.1021/jacs.4c12174
Y.W. You, D.X. Zhang, F.L. Wu, et al., npj Comput. Mater. 10 (2024) 57. doi: 10.1038/s41524-024-01240-7
A.I. Osman, W. Abd-Elaziem, M. Nasr, et al., Environ. Chem. Lett. 22 (2024) 1703–1740. doi: 10.1007/s10311-024-01741-3
X. Li, H.L. Zhong, H.Y. Yang, et al., J. Chem. Inf. Model. 64 (2024) 6361–6368. doi: 10.1021/acs.jcim.4c00724
X. Li, H.Y. Yang, Y.H. Tao, et al., Macromolecules 58 (2025) 2266–2275. doi: 10.1021/acs.macromol.5c00015
X. Jiang, W.J. Yin, J. Energy Chem. 57 (2021) 351–358. doi: 10.1016/j.jechem.2020.08.046
K. Li, H. Ma, Mater. Today Phys. 54 (2025) 101724. doi: 10.1016/j.mtphys.2025.101724
H. Lin, X.Q. Cui, B.L. Dai, et al., ACS Cent. Sci. 11 (2025) 1135–1146. doi: 10.1021/acscentsci.5c00561
L. Zhang, J.H. Du, Z.K. Xie, et al., Nat. Chem. 17 (2025) 1645–1654. doi: 10.1038/s41557-025-01974-x
X.Q. Wang, X.N. Li, M.N. Li, et al., Nano-Micro Lett. 18 (2026) 347. doi: 10.1007/s40820-026-02183-y
B. Mishra, A. Alam, A. Chakraborty, et al., Adv. Mater. 37 (2025) 2413118. doi: 10.1002/adma.202413118
D. Blätte, F. Ortmann, T. Bein, J. Am. Chem. Soc. 146 (2024) 32161–32205. doi: 10.1021/jacs.3c14833
N.M. O’Boyle, M. Banck, C.A. James, et al., J. Cheminf. 3 (2011) 33. doi: 10.1186/1758-2946-3-33
M. Walker, A.J.A. Harvey, A. Sen, C.E.H. Dessent, J. Phys. Chem. A 117 (2013) 12590–12600. doi: 10.1021/jp408166m
E.G. Hohenstein, S.T. Chill, C.D. Sherrill, J. Chem. Theory Comput. 4 (2008) 1996–2000. doi: 10.1021/ct800308k
A.V. Marenich, C.J. Cramer, D.G. Truhlar, J. Phys. Chem. B 113 (2009) 6378–6396. doi: 10.1021/jp810292n
M.J. Frisch, G.W. Trucks, H.B. Schlegel, et al., Gaussian 09, Rev. C.01, Gaussian, Inc, Wallingford, CT, 2009.
J. Benesty, J.D. Chen, Y.T. Huang, I. Cohen, Pearson correlation coefficient, Noise Reduction in Speech Processing, Springer, Berlin, Heidelberg, 2009, pp. 37–40.
J.Y. Zhang, X.L. Ma, J.L. Zhang, et al., J. Environ. Manage. 332 (2023) 117357. doi: 10.1016/j.jenvman.2023.117357
Y. Yang, X.Y. Chu, H.Y. Zhang, et al., Nat. Commun. 14 (2023) 593. doi: 10.1093/beheco/arad027
M. Wang, Z. Wang, M.D. Shan, et al., Chem. Mater. 35 (2023) 5368–5377. doi: 10.1021/acs.chemmater.3c00556
H. Liu, X.H. Zheng, J. Xu, et al., ACS Appl. Mater. Interfaces 15 (2023) 16794–16800. doi: 10.1021/acsami.3c01154
J.S. Xu, C. Yang, S. Bi, et al., Angew. Chem. Int. Ed. 59 (2020) 23845–23853. doi: 10.1002/anie.202011852

Figure 1 (a) Schematic workflow of the synergistic high-throughput DFT/TD-DFT and ML for COFs. (b) Statistics of the types of COFs included in the database. (c) Distribution of the simulated λmax. (d) Value distributions of the target descriptors (EHOMO, ELUMO, IP, and EA) for COFs. (e) Illustration of the D-π-A model of TpBD-COF.

Figure 2 Performance of eight ML models in predicting λmax, EHOMO, ELUMO, IP, and EA: (a) R2, (b) MAE, and (c) RMSE averages. Consistency plots compare the optimal AdaBoost predicted model with TD-DFT result for (d) λmax (nm), (e) EHOMO, (f) ELUMO, (g) IP, and (h) EA. The energy unit is 10−2 eV.

Figure 3 SHAP analysis displays the correlation values of descriptors for (a) λmax, (b) EHOMO, (c) ELUMO, (d) IP, and (e) EA of COFs, respectively. (f) Pearson correlation coefficient heatmap for λmax.

Figure 4 The structural representations of TpBD-COF, COF-F, BTTh-TZ-COF, and g-C54N6-COF.

Figure 5 Excited state analysis of TpBD-COF, COF-F, BTTh-TZ-COF, and g-C54N6-COF (a) FMOs, CDD, CRCT, and TDM plots. (b) Simulated UV-vis absorption spectra. (c) Radar plot of other key descriptors, including Sr, D, H, HDI, EDI, and CTE indices.
Table 1. Molecular descriptors of COFs.
| No | Name | Description (unit) |
| 1 | Sur | Overall surface area (Å2) |
| 2 | S | Estimated density according to mass and volume (M/V in Å3) |
| 3 | MPI | Molecular polarity index |
| 4 | µex | Dipole moment at excited state (D) |
| 5 | ELUMO | Energy of LUMO orbital (eV) |
| 6 | EHOMO | Energy of HOMO orbital (eV) |
| 7 | Egap | Energy difference between the HOMO and LUMO (eV) |
| 8 | Eex | Excitation energy (eV) |
| 9 | IP | Ionization potential (eV) |
| 10 | EA | Electron affinity (eV) |
| 11 | λmax | Maximum UV-vis absorption wavelength (nm) |
| 12 | f | Oscillator strength |
| 13 | Sr | Overlap integral of Sr function |
| 14 | t | Degree of separation between hole and electron |
| 15 | CTE | Charge transfer efficiency (e) |
| 16 | D | Centroid separation distance (Å) |
| 17 | H | Overall mean distribution breadth of electron and hole |
| 18 | EDI | Electron delocalization index |
| 19 | HDI | Hole delocalization index |
| 20 | GHI | Ghost-hunter index |
| 21 | CT% | Apparent charge transfer percentage (%) |
| 22 | LE% | Apparent local excitation percentage (%) |
 下载: 导出CSV

 扫一扫看文章


扫一扫关注我们
 下载: