Citation:
Linyu Zeng, Weiran Ling, Hai Xiong. pH-regulated self-assembly and Ag+-responsive bioimaging of endoplasmic reticulum-targeted probe in vitro/in vivo[J]. Chinese Chemical Letters,
2026, 37(10): 112941.
doi:
10.1016/j.cclet.2026.112941
pH-regulated self-assembly and Ag+-responsive bioimaging of endoplasmic reticulum-targeted probe in vitro/in vivo
English
pH-regulated self-assembly and Ag+-responsive bioimaging of endoplasmic reticulum-targeted probe in vitro/in vivo
Institute of Advanced Study, Shenzhen University, Shenzhen 518060, China
* Corresponding author. E-mail address: hai.xiong@szu.edu.cn (H. Xiong). 1 These authors contributed equally to this work.
Received Date:
10 February 2026 Accepted Date:
12 May 2026 Revised Date:
12 May 2026 Available Online:
15 October 2026
Abstract:
Amphipathic TAP-dU and TAP-dC were designed with a distinctive donor-π-acceptor (D-π-A) electronic architecture, which the nucleoside function and TAP-moiety act as the electron donor and electron acceptor, respectively. The base-triggered charge transfer is influenced by protonation/deprotonation states and conformational twisting. Hydrogen-bonding interactions between the pyrimidine and ribose were thoroughly examined by nuclear magnetic resonance (1H NMR) spectroscopy, single-crystal X-ray crystallography, and density functional theory (DFT) calculations. Importantly, TAP-dU exhibits pH-dependent self-assembly and π-π stacking interactions, leading to an aggregated fluorescence multicolor shift from blue to green to yellow, with emission wavelengths reaching up to 545 nm. Unlike our previously reported nucleus-targeted TPE-dU/TPE-dC and mitochondria-targeted TPE-FdU, this study demonstrates that both nontoxic TAP-dC and TAP-dU effectively achieve endoplasmic reticulum (ER)-specific imaging in NIH-3T3 and HeLa cells. Additionally, due to its biocompatibility, TAP-dC also serves as a promising candidate for in vivo Ag+ detection in NIH-3T3 and zebrafish via bioimaging.
Endoplasmic reticulum (ER) plays a crucial role in calcium storage, lipid metabolism, protein synthesis and folding, as well as maintaining redox balance within living organisms. It has been reported that the morphological changes or dysfunction of the ER can induce cancer, inflammation, metabolic disorders, Alzheimer’s, or Huntington’s disease [1,2]. At present, there is a need to develop highly efficient and specific ER-targeted probes to enable real-time monitoring of intracellular dynamics and to gain a deeper understanding of disease pathogenesis [3–5]. Nevertheless, creating the labeling probes suitable for long-term super-resolution imaging of the ER remains difficult due to their insufficient photostability and limited responsiveness to multiple stimuli.
Recent studies on nucleoside-based fluorescent probes have mainly concentrated on diversifying the structures of fluorophore-nucleoside conjugates to enhance their range of applications. However, a comprehensive theoretical understanding of hydrogen bonding interactions, conformational dynamics, and electron transfer mechanisms remains largely unexplored. By modifying factors such as nucleobase hydrophobicity, shape/size, π-electron interactions, and hydrogen-bonding interactions, a series of modified nucleoside analogs has been used to investigate new pairing partners, expand the genetic code, develop novel DNA polymerases with good activity and fidelity, and even create potential therapeutic agents [6–9]. Due to their highly specific non-covalent interactions, these analogs also serve as crucial components in self-assembly processes, facilitating the formation of hydrogels, copolymers, and supramolecular spherical assemblies, and one-dimensional growth of nanogels or nano/micro-sized structures [10–14]. Particularly, nucleoside fluorescent probes that involve coordination interactions affecting optical properties have been applied in trace detection of metal ions and environmental pH, biosensing, and cell-imaging, antibacterial treatments, and precise tumor markers for clinical cancer diagnosis [15–21]. It is well established that deoxycytidine has a pKa of 4.3, and its protonation at the N3 site enables the formation of a Watson−Crick C-G base pair, which can be further stabilized by another deoxycytidine (dC) on the third strand, generating a new triple helix. Substituting natural nucleobase pairing with non-hydrogen bonding by forming a metallo-base pair, such as cytosine−silver−cytosine (C–Ag+–C), has been achieved and shows promise for expanding the genetic code and developing nucleic acid-based genetic code expansion and nanodevices. The enhanced stability of duplexes incorporating 8-phenylimidazolo-dC (phImidC), fluorinated sugar residues (phPyrGem), or 5-bromouracil (BrU) has extended to the artificial Ag+-base pairs, including mismatched pairs like dC-dT and dC-dA [22–25]. Although Ag+ is commonly used as a pesticide and sterilizing reagent, as well as an intercalator in mismatched DNA duplex, triple helix, and DNA nanowires, its bioaccumulation can cause various health issues such as anemia, poor growth, and liver cirrhosis [26–28]. To overcome these traditional technical bottlenecks, it is essential to develop efficient fluorescent probes capable of monitoring trace amounts of Ag+ both in vitro and intracellularly.
In our previous research, we have developed nucleoside-based AIEgens sensors, including nucleus-targeted TPE-dC and mitochondria-targeted TPE-FdU. These sensors illuminate the nucleus, which is rich in DNA/RNA and demonstrate properties such as pH responsiveness and selective detection of trace amounts of Hg2+ or glutathione (GSH), respectively [16,19]. Subsequently, a lysosome-targeted probe, RBH-EdC, achieved the response of Fe3+ and a 30-fold intensity increase at pH 2.5. This result allows for precise investigation of pH microenvironments, real-time monitoring of lysosomal pH changes, and direct measurement of gastric acidity levels [20]. Recently, the 2,4,6-triarylpyridine (TAP) moiety has attracted great attention to construct photocatalysts, 3D supramolecular structures with antimicrobial activity, heteroatom-containing covalent organic frameworks (COFs), and anticancer agents [29–33]. Although the nitrogen atom in the pyridine ring is expected to act as a proton acceptor in designing fluorescent probes based on intramolecular charge transfer (ICT) and photoinduced electron transfer (PET) mechanisms, the TAP derivatives have rarely been utilized as fluorescent probes or colorimetric chemical sensors [34,35].
In this study, cytidine (pKa = 4.11) and uridine (pKa = 9.25) were strategically chosen as electron-donor groups. Two novel nucleoside fluorescent probes, TAP-dC and TAP-dU, were created by using the TAP moiety as the electron-acceptor group. Both these probes feature a donor-π-acceptor (D-π-A) electronic configuration and exhibit an ICT effect that varies with pH depending on the molecule’s protonation and deprotonation. Importantly, TAP-dU exhibits the pH-dependent self-assembly behavior under acidic conditions, leading to a fluorescence color transition from blue → green → yellow as the pH decreases. Notably, TAP-dC displayed superior specificity for Ag+ detection with a limit of detection (LOD) of 0.2 µmol/L. Cytotoxicity test and cell imaging experiments also confirmed that TAP-dC is efficient for monitoring trace amounts of Ag+ in cellular environments. Furthermore, both TAP-dC and TAP-dU (20 µmol/L) concentrations were effectively labeled in the ER in NIH-3T3 and HeLa cell lines.
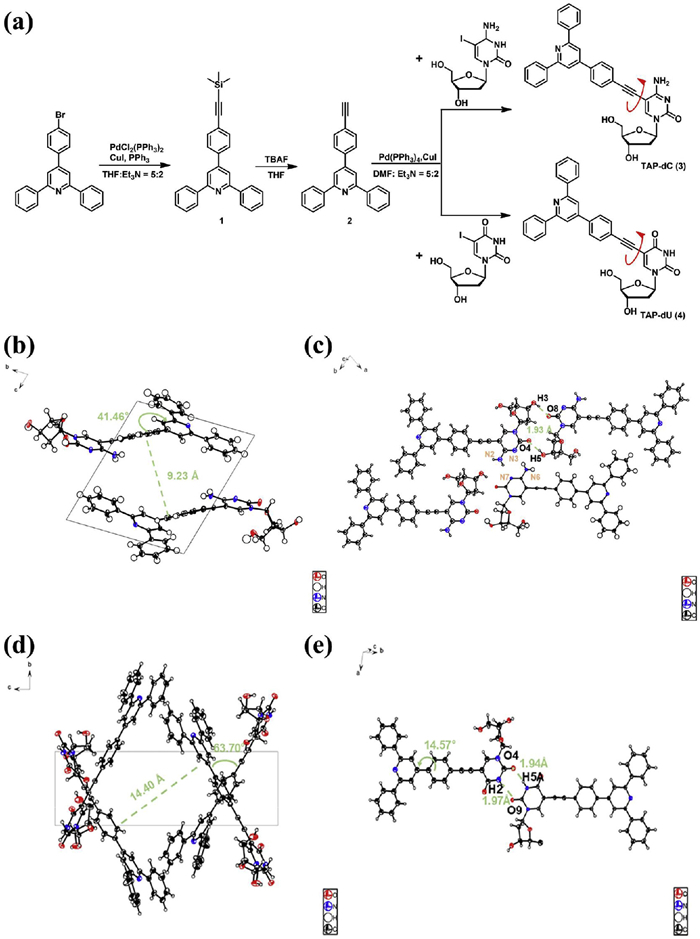
Two nucleoside fluorescent probes, TAP-dC and TAP-dU, were derivatized from 5-iodo-2′-deoxycytosine or 5-iodo-2′-deoxyuridine and 4-(4-ethynylphenyl)-2,6-diphenylpyridine (Ethynyl-TAP). The synthesis route of TAP-dC and TAP-dU is shown in Fig. 1a. They were characterized by nuclear magnetic resonance (1H NMR, 13C NMR), and electrospray ionization mass spectrometry (ESI-MS). Additional details are provided as Figs. S1-S8 (Supporting information).
Figure 1
Figure 1.
(a) Synthetic route for the preparation of TAP-dC and TAP-dU. (b) Stacking b-c plane diagram of TAP-dC unit cells. (c) Major intermolecular hydrogen bonding of the TAP-dC single crystal. (d) Stacking b-c plane diagram of TAP-dU unit cells. (e) Major intermolecular hydrogen bonding of the TAP-dU single crystal.
The large-planar substituent maintains co-planarity with the dC moiety, significantly restricting the spatial orientation, which leads to a significant dihedral angle of 41.46° between the phenyl and pyridine rings, causing this structural distortion (Fig. 1b). The twisted conformation of TAP-dC facilitates an ICT process, where electrons originate from the electron-donating nucleoside moiety, travel through the π-conjugated bridge, and finally spread into the TAP acceptor unit. Each unit cell contains two TAP-dC molecules stacked in parallel with an interplanar distance of 9.23 Å. Unlike the Watson-Crick base pairing principle, π-π stacking affects the base pairing method of TAP-dC, mainly manifested as hydrogen bonding patterns between H3-O8 and O4-H5, as shown in Fig. 1c. The amino and carbonyl functional groups in the cytidine moiety create strong push-pull electronic effects, allowing for various intra- and intermolecular hydrogen bonds. These interactions not only promote molecular aggregation but also enhance the structural stability of the single crystal. The detailed hydrogen bond length and bond angle of TAP-dC are supplemented in Table S3 (Supporting information). The TAP-dU unit cell (MW = 1114.16) exhibits two molecular formulas (C34H27N3O5 and C34H26N3O5), suggesting tautomerism in the base moiety. This structural flexibility leads to diverse molecular packing possibilities. As shown in Fig. 1d, four TAP-dU molecules per unit cell arrange in two offset parallel stacks. The interplanar distance in the offset overlapping arrangement is 14.40 Å, while the interplanar angle between interlaced stacks measures 63.70°. Compared to TAP-dC, the dihedral angle between the phenyl and pyridine rings is smaller at 14.57°, indicating greater coplanarity in Fig. 1e. This configuration imposes notable steric constraints, resulting in an overall twisted molecular conformation that enhances accessibility of the base-NH group for intermolecular hydrogen bonding. Notably, the base portion forms two nearly symmetrical hydrogen bond pairs, similar to Watson-Crick base pairing. Multiple hydrogen bond donors and acceptors remain, allowing for a variety of intra- and intermolecular hydrogen bonding patterns (Table S5 in Supporting information). Together with π-π interactions, these hydrogen bonding networks play a key role in stabilizing the crystal through vibrational dynamics.
The ultraviolet-visible spectroscopy (UV–vis) absorption spectra of TAP-dC and TAP-dU display three primary absorption peaks at approximately 265, 300, and 330 nm, corresponding to the π-π* transition, n-π* transition, and ICT effect (Figs. S9a and c in Supporting information). Their fluorescence spectra in DMSO, MeOH, tetrahydrofuran (THF), and H2O are collected as Figs. S9b and d (Supporting information). TAP-dC emits fluorescence at 443 nm in DMSO and 412 nm in THF, whereas TAP-dU displays emission at 430 nm in H2O and 398 nm in THF. As the solvent polarity increases, the maximum emission peak undergoes a red shift of about 30 nm, showing a positive solvation effect. Especially, the extensive hydrogen-bonding network stabilizes the excited state, which lowers the excited-state energy and leads to a red shift for the emission signal. Using quinine sulfate as a standard, the calculated fluorescence quantum yields of TAP-dC and TAP-dU’s fluorescence are shown in Table S1 (Supporting information). In aqueous solution, the quantum yield of TAP-dC’s fluorescence (Φ = 0.12) was slightly higher than that of TAP-dU (Φ = 0.08) in aqueous solution. Overall, the quantum yield is higher in organic solutions, due to aggregation-induced quenching (ACQ) effects.
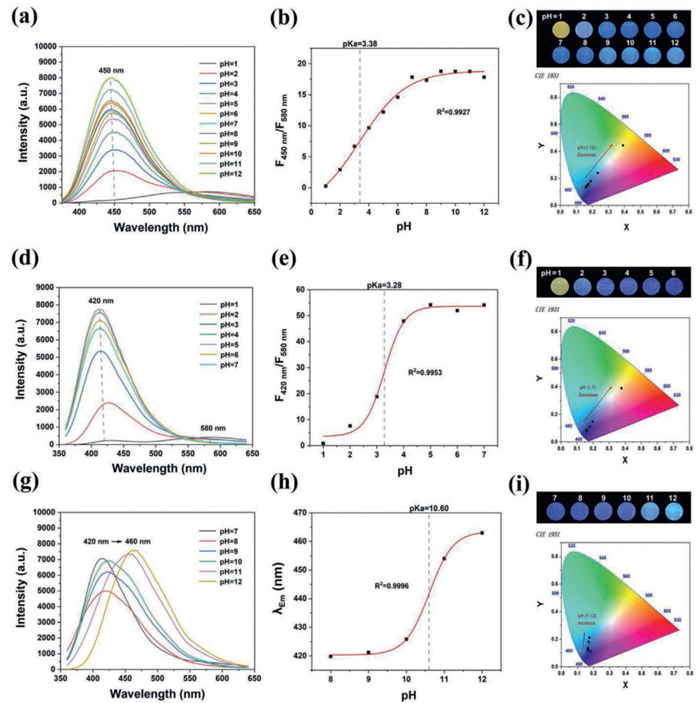
To reveal their pH-dependent behavior, the fluorescence intensity of TAP-dC was measured at different pH levels. As the pH value decreased, the fluorescence intensity at 450 nm of emission diminished, while the bright yellow fluorescence at 580 nm increased (red shift: 130 nm), as shown in Fig. 2a. Using the Boltzmann function fitting, the midpoint of the curve corresponds to the pKa value. Plotting the ratio of F450 nm/F580 nmvs. pH produced a characteristic titration curve, yielding a pKa value of 3.38 (Figs. 2b and c). As a comparison, TAP-dU displays slightly different emission signals. These results indicate that TAP-dU undergoes similar fluorescence spectral changes as TAP-dC under acidic conditions, as shown in Fig. 2d. The same plot of the F420 nm/F580 nm plot determined the pKa1 value of TAP-dU to be 3.28 (Figs. 2e and f). However, a red shift in emission wavelength from 420 nm to 460 nm was observed, accompanied by a color change from blue to blue-cyan, which varied with alkaline concentration, as seen in Figs. 2g and i. Subsequently, the relationship between emission wavelength and pH was fitted, yielding a pKa2 value of 10.60 (Fig. 2h).
Figure 2
Figure 2.
(a) The fluorescence emission spectra of TAP-dC at different pH levels. (b) pKa fitting curve of TAP-dC. (c) Fluorescence changes the visualization of TAP-dC at different pH levels. (d) The fluorescence emission spectra of TAP-dU under acidic conditions. (e) pKa1 fitting curve of TAP-dU. (g) The fluorescence emission spectra of TAP-dU under alkaline conditions. (h) pKa2 fitting curve of TAP-dU. (f, i) Fluorescence changes visualization of TAP-dU at different pH levels.
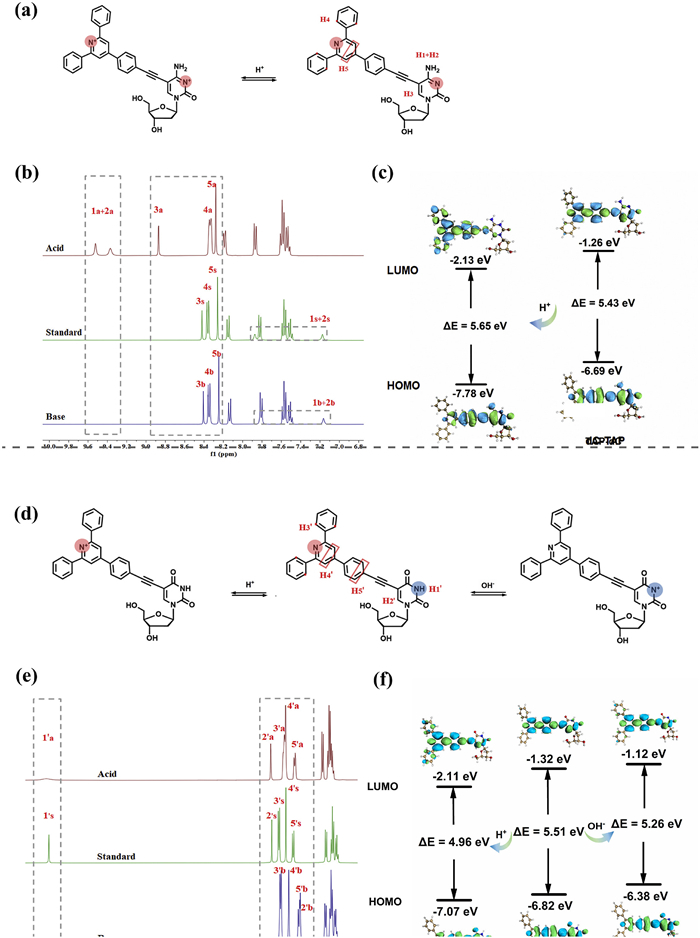
The plausible mechanism for fluorescent shifts with different acid/basic environments was also investigated by 1H NMR spectroscopy. Measurements were taken in DMSO–d6 at specific pH levels (4, 7, and 10) representing acidic, neutral, and basic environments. In case of TAP-dC, the -NH2 proton in the cytosine moiety exhibits a more pronounced chemical shift, as evidenced in Figs. 3a and b. Specifically, the low-field chemical shift of H1 moved from 7.87 ppm to 9.52 ppm, H2 shifted from 7.17 ppm to 9.37 ppm, while H3 from 8.43 ppm to 8.87 ppm. This result indicates that protonation at the heterocyclic N3 position under acidic conditions decreases the density of electron density around nearby H1, H2, and H3, leading to an unshielding effect. With the impact of pyridine nitrogen protonation, the resonance frequencies of H4 and H5 are close, reflecting a similar chemical environment. Under alkaline conditions, the chemical shift of nitrogen atoms in cytosine and TAP remained largely unchanged. Overall, the 1H NMR data suggest that the fluorescence redshift of TAP-dC in acidic environments is primarily caused by protonation at cytosine N3 and the TAP pyridine nitrogen, with the pKa1 value directly related to the efficiency of protonation.
Figure 3
Figure 3.
(a) The protonation, (b) 1H NMR spectra, (c) DFT calculated excited-state geometries, electron distribution, and energy levels on HOMO and LUMO of spectra of TAP-dC under acidic conditions. (d) The protonation, (e) 1H NMR spectra, and (f) DFT calculated excited-state geometries, electron distribution, and energy levels on HOMO and LUMO of spectra of TAP-dU at different pH.
To further explore the relationships between the alternation of emission and ligand exchange process, detailed density functional theory (DFT) calculations of TAP-dC demonstrate significant charge delocalization throughout the π-conjugated system and a calculated highest occupied molecular orbital-lowest unoccupied molecular orbital (HOMO-LUMO) gap (ΔE), as shown in Fig. 3c. In the neutral state, the electrons in HOMO are mainly located on the base, which means that the base part is the electron-donor unit (D). The electrons in LUMO are widely distributed, extending from the base moiety through the conjugated structure to the terminal benzene ring of the TAP, indicating that the pyridine heterocyclic region of the TAP is the main electron-acceptor unit (A). Under acidic conditions, the spatial overlap between HOMO and LUMO orbitals indicates that protonation occurs at both cytosine N3 and select pyridine nitrogen atoms in TAP-dC, creating charge homogenization. The resultant electrostatic repulsion between these protonation sites drives significant electron density redistribution within the π-conjugated system, pushing electrons from the cytosine side into the benzene ring at the end of the TAP (A). This leads to a greater separation between HOMO and LUMO, enhancing the intramolecular ICT effect. Simultaneously, the torsion angle between the benzene ring and the pyridine group of TAP-dC decreased, and the conjugation was enhanced after protonation. The ΔE of TAP-dC was 5.43 and 5.65 eV, respectively, under neutral and acidic conditions. In general, the increased energy gap of HOMO-LUMO corresponds to a shorter light absorption wavelength (blue shift), but fluorescence involves relaxation and transition of the excited state. Although protonation does not significantly alter the HOMO-LUMO gap in TAP-dC’s conjugated structure, the delocalization of electron distribution enhances molecular stability, lowering the excited state energy and causing the emission to shift toward longer wavelengths (red shift).
TAP-dU was characterized with the same method. Under acidic conditions, the hydrogen adjacent to the pyridine nitrogen in TAP-exhibited a substantial chemical shift variation compared to that observed under neutral conditions, as shown in Figs. 3d and e. Upon protonation, H3′ shifted from 8.34 ppm to 8.28 ppm in the high field, moving closer to the chemical shift of H4′. Under alkaline conditions, the H1′ signal corresponding to the -C ═ NH group (11.74 ppm) disappeared, indicating that the imino-group was deprotonated into a negatively charged ion. Due to the influence of H1′ deprotonation, the distribution of electron clouds within TAP-dU molecules was changed, and both H2′ and H5′ moved to a slightly higher field. The imino deprotonation under alkaline conditions also leads to a redshift in fluorescence. Based on titration data, pKa1 primarily reflects the protonation level of the TAP pyridine nitrogen atom, while the pKa2 value is associated with changes in the excited state of the uridine moiety’s "push-pull" electron system. As shown in Fig. 3f, it presents the calculated HOMO and LUMO energy level variations of TAP-dU under different counterion conditions, demonstrating the strong influence of protonation and deprotonation on frontier molecular orbitals. Under the neutral condition, electron transfer is mainly confined to the local structure (low-energy state). Under acidic and alkaline conditions, the HOMO and LUMO regions show a certain degree of separation, but their ICT characteristics are weaker than those of TAP-dC. The ΔE of TAP-dU under neutral, acidic, and alkaline conditions were 5.51, 4.96, and 5.26 eV, respectively. The decrease in ΔE following protonation and deprotonation corresponds to the observed redshift in emission due to changes in energy gaps.
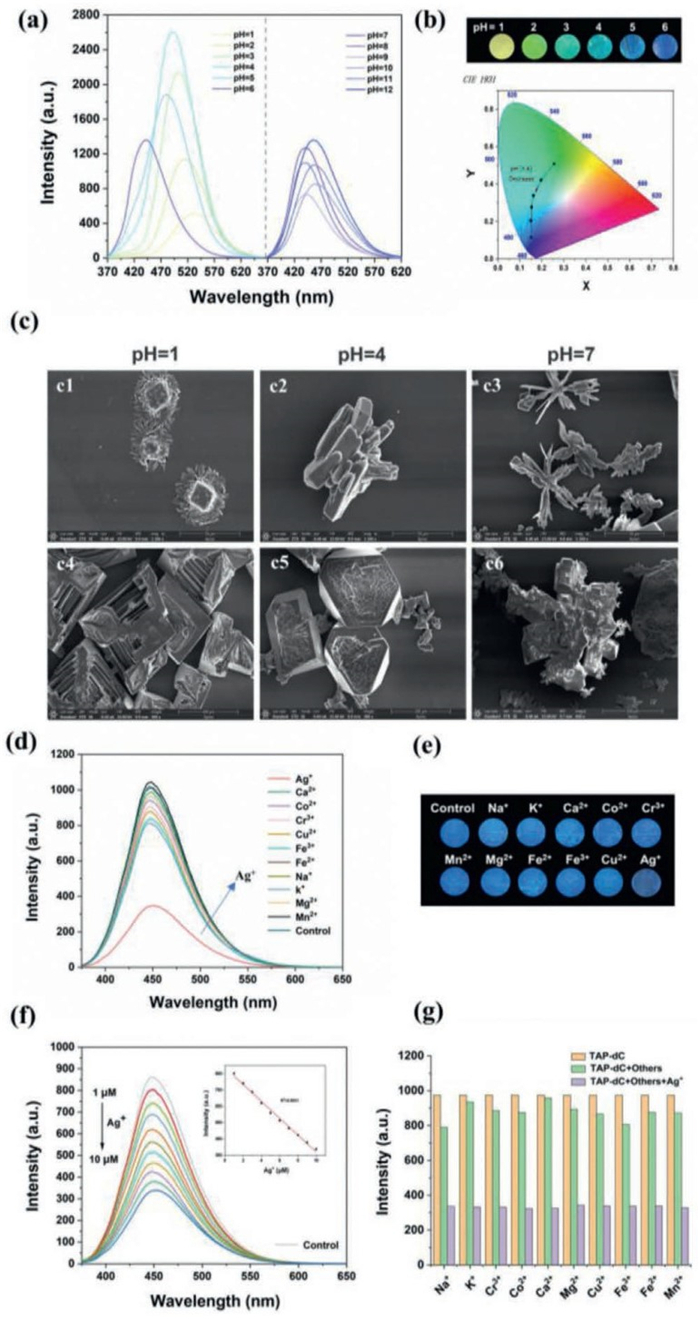
Electron-rich units are positioned close together in the cluster state, and the restricted molecular movement allows the excited state geometry of the cluster to form stably. This promotes the formation of electron coupling and delocalization through space. As the number of delocalized electrons increases, the energy gap gradually narrows, potentially creating an electron band that leads to the observed long-wavelength emission. Herein, the pKa testing of the fluorescent probes (TAP-dC and TAP-dU) is determined in monomeric form, displaying that pH primarily influences fluorescence emission by altering the electron distribution and conjugation within the molecule. Upon adding cosolvents, self-assembly of monomeric TAP-dU in DMSO occurred easily due to the hydrophilic nucleoside units being on the outside while the hydrophobic TAP-moieties are on the inside. As illustrated in Fig. 4a, under acidic conditions, the fluorescence emission peak of TAP-dU gradually decreases and redshifts, exhibiting a different pH response than that of the monomer. For the monomeric probe, the fluorescence color changes linearly with pH from 1 (blue → green → yellow), reaching emission at 545 nm, indicating that the direct effect of the D-π-A electron transfer system causes the molecule’s electronic state to change linearly with pH value (Fig. 4b). Overall, these changes in photophysical behavior suggest the present of different excited-state processes, which potentially include intermolecular energy transfer, solvation effects, or excited-state proton transfer mechanisms.
Figure 4
Figure 4.
(a) The fluorescence emission spectra of TAP-dU aggregates at different pH. (b) Fluorescence changes the visualization of TAP-dU at various pH levels. (c) HR-SEM packing partial c1-c3 and overall diagram c4-c6 of TAP-dU self-assembled aggregates at different pH-values (1, 4, and 7). (d) Fluorescence spectra of TAP-dC (10 µmol/L) after the addition of various metal ions (λem = 450 nm). (e) Fluorescence quenching by Ag+. (f) Fluorescence response to varying Ag+ concentrations (inset: linear correlation between TAP-dC/Ag+ intensity and Ag+ concentration). µM = µmol/L. (g) Comparison of fluorescence intensity for TAP-dC (5 µmol/L), TAP-dC + other metal ions (100 µmol/L), and TAP-dC/Ag+ + other metal ions (100 µmol/L).
Given the distinct pH-dependent fluorescence profiles exhibited by the probe aggregates, the underlying mechanisms were further investigated according to the particle size data measured by dynamic light scattering (DLS) at different pH values. As shown in Fig. S10 (Supporting information), in the case of TAP-dU, the self-assembled structure of TAP-dU is mostly spherical with a diameter of 196.40 nm under neutral conditions (Fig. S10a). Under strongly acidic conditions within the pH range of 1–2, the hydrodynamic diameters of TAP-dU aggregates are 208 and 256 nm (Figs. S10b and c). This result demonstrates that TAP-dU undergoes complete protonation, resulting in electrostatic repulsion between molecules that maintains a small hydrodynamic diameter. Within the more acidic pH range of 3–4, the hydrodynamic diameters of TAP-dU aggregates are 527 and 576 nm (Figs. S10d and e). TAP-dU demonstrates enhanced aggregation accompanied by a distinct fluorescence shift to green and blue-green emission. As shown in Figs. S10f-h, TAP-dU forms small aggregates with a hydrodynamic diameter close to 452 nm within the pH range of 5–7, when these aggregates exhibit short-wavelength emission (high-energy state), displaying blue to blue-violet fluorescence.
The adhesion and surface accumulation behavior of TAP-dU solutions at pH levels 1, 4, and 7 were further investigated by using high-resolution scanning electron microscope (HR-SEM), as shown in Fig. 4c (c1-c6). Due to the presence of solvent effects or solubility gradients, peripheral molecules at the edges tend to deposit or reorganize, leading to the formation of branched, sheet-like, or petal-shaped structures. Some TAP-dU molecules detach from the surfaces of the smaller particles to form larger clumpy solids or crystals. The shape of these aggregates highlights the main mechanism by which environmental pH influences the self-assembly behavior of TAP-dU. At pH 7, the aggregates appeared disordered and coarse, with partial images showing cluster-like formations. Under neutral conditions, TAP-dU is neither protonated nor deprotonated, which may form a weak aggregation dominated by hydrogen bonds, causing random molecular clustering and disordered aggregates. Green emission fluorescence occurs at pH 4, green fluorescence emission is observed, and the partially charged molecules tend to arrange in a regular, ordered, columnar pattern, due to an electrostatic bilayer or a layered stacking. Within the more acidic pH 1, the enhanced protonation leads to potentially stronger electrostatic or hydrogen bonding interactions compared to the neutral case, leading to more regular aggregates that form dense and ordered cubes. The local magnification images reveal regular cubic or dendritic flower-like nanostructures, which may be achieved from the accumulation of π-π stacking or secondary clustering with multi-directional growth.
The metal-ion-mediated nucleobase-pairing provides theoretical support for the construction of metal-responsive nucleoside molecules with rich electronic nitrogen and oxygen atoms. The metal ion recognition capability of TAP-dC (5 µmol/L) and a variety of metal ions (100 µmol/L) was examined, including Na+, K+, Ag+, Ca2+, Mg2+, Mn2+, Cu2+, Fe2+, Co2+, Cr3+, and Fe3+. After adding various metal ions, the presence of Ag+ led to the fluorescence quenching, and the other metal ions had no significant effect, as shown in Fig. 4d. Then, it is developed as a visual probe by color change with the naked eye, a clear solution in one pipette marked as Ag+ was observed as the bright visualization (Fig. 4e), which indicates TAP-dC can specifically recognize Ag+. To determine the LOD for Ag+, the constant concentration of TAP-dC (5 µmol/L) was maintained within the range of 1–10 µmol/L of Ag+. The probe exhibited a concentration-dependent fluorescence quenching effect, as shown in Fig. 4f. At elevated Ag+ concentrations (>10 µmol/L), the probe exhibited significant fluorescence quenching to approximately 31.4%. The fluorescence intensity demonstrated a progressive decrease that was inversely proportional to Ag+ concentration (y = 837.31 − 51.72x, R2 = 0.9931), indicating a strong negative correlation. According to the slope of the linear equation and the above formula, the LOD was calculated to be 0.20 µmol/L. Various metal cations in the above were examined with TAP-dC in the presence of Ag+, and the alternating quantity in the fluorescence intensity at 450 nm of emission was recorded. The result showed that these tested metal ions did not display any interference when mixed with the detection of Ag+ (Fig. 4g).
Next, the 1H NMR spectra of TAP-dC and TAP-dC-Ag+ are compared in Fig. S11 (Supporting information). Notably, the H1 signal disappears and shifts downfield, overlapping with the hydrogen peak of the aromatic ring. The chemical shift of H2 is changed from 7.17 ppm to 7.92 ppm, and the H3 signal shifted from 8.43 ppm to 8.58 ppm, indicating that Ag+ binding to the amino-nucleoside induces an ICT effect due to changes in the electronic distribution of the pyrimidine ring. For the chemical shift of H4 in TAP, it moves slightly upfield from 8.36 ppm to 8.32 ppm, and H5 shifts from 8.25 ppm to 8.23 ppm. The similar resonance frequencies of H4 and H5 reflect the influence of Ag+ on the electron cloud distribution within the nucleoside. Furthermore, Ag+ enhances the stacking of the intermolecular benzene ring planes, which contributes to fluorescence quenching.
The same recognition assay was conducted for the TAP-dU probe as follows. As shown in Fig. S12 (Supporting information), the fluorescence quenching indicates that TAP-dU can simultaneously detect Ag+ and Cu2+ (Figs. S12a and b). Within the Ag+ concentration range of 1–10 µmol/L, the TAP-dU fluorescence intensity shows a linear relationship with the Ag+ concentration with an LOD of 0.14 µmol/L (Fig. S12c). The linear equation is y = 1147.30 − 82.12x, with an R2 value of 0.9966. In the range of Cu2+ concentration of 5–50 µmol/L, the TAP-dU fluorescence intensity also correlates linearly with Cu2+ concentration, with an LOD of 1.41 µmol/L (Fig. S12d). The linear equation is y = 967.94 − 8.22x, with an R2 of 0.9917. Subsequently, the competitive and interfering assay is performed on TAP-dU; fluorescence quenching is less in the presence of Cu2+ and further quenched upon adding Ag+ (Figs. S12e and f). Further, the pre-existence of Ag+ can significantly decrease the fluorescence intensity, and the addition of Cu2+ cannot interfere. Combined with 1H NMR analysis in Fig. S13 (Supporting information), the binding capability of TAP-dU-Ag+/Cu2+ is related to the –C=O group in the nucleobase moiety. In contrast to TAP-dC, these results show that Ag+ detection lacks specific selectivity and that the TAP-dU probe has limited applicability.
To further clarify the different fluorescence quenching mechanisms and binding mode of TAP-dC to Ag+ and TAP-dU to Ag+/Cu2+, theoretical calculations were carried out by using the Gaussian 16 program alongside 1H NMR analysis. These calculations provided insights into binding stoichiometry and association constants. The simulated model is illustrated in Fig. S14 (Supporting information). For a hypothetical 1:1 of binding stoichiometry, the binding energy between Ag+ and the oxygen atoms of the free base pair was −2.174 eV for TAP-dC, and −5.779 eV for TAP-dU. The corresponding binding constants K are 2.16 × 1030 and 2.28 × 1091, respectively (Table S6 in Supporting information). For the hypothetical 1:2 of binding stoichiometry, the binding energy between Ag+ and the oxygen atoms of the free base pair was −7.359 eV for TAP-dC, and −7.136 eV for TAP-dU. The corresponding binding constants K are 8.13 × 10112 and 4.40 × 10105, respectively (Table S7 in Supporting information). These results effectively describe weak intermolecular interactions, which agrees with the previous reports indicating that 2′-deoxy-cytosine or 2′-deoxy-uridine (dU) analogues can be used to respectively detect Ag+ or Cu2+ due to their good affinity. Upon adding various metal ions, a distinct effect on the solutions’ brightness was observed in pipette visualizations, except for the sample marked Ag+, which remained clear (Fig. 4e). A similar phenomenon was also obvious with TAP-dU for the detection of Ag+ and Cu2+, as shown in Fig. S12b.
The cytotoxicity of the fluorescent probes (TAP-dC and TAP-dU) was evaluated using the cell counting kit-8 (CCK-8) assay in normal NIH-3T3 and cancerous HeLa cells, enabling assessment of their biocompatibility profiles. The cell viability gradually decreases with the increasing concentration, as shown in Figs. S15a-e and S16a-e (Supporting information). No significant changes in viability were observed for NIH-3T3 and HeLa cells at concentrations below 40 µmol/L (P > 0.05) and 20 µmol/L (P > 0.05), respectively. However, the viability of NIH-3T3 and HeLa cells decreased significantly (P < 0.01) at the infusing concentration of 60 µmol/L, indicating strong toxicity. Subsequently, NIH-3T3 and HeLa cells were incubated with the selected 20 µmol/L of probe through a time course with different time intervals of 0.5, 1, and 2 h at 37 ℃. Cellular fluorescence images were then visualized at an emission wavelength of 405 nm channel by confocal laser scanning microscopy (CLSM), as shown in Figs. S15c-f and S16c-f (Supporting information).
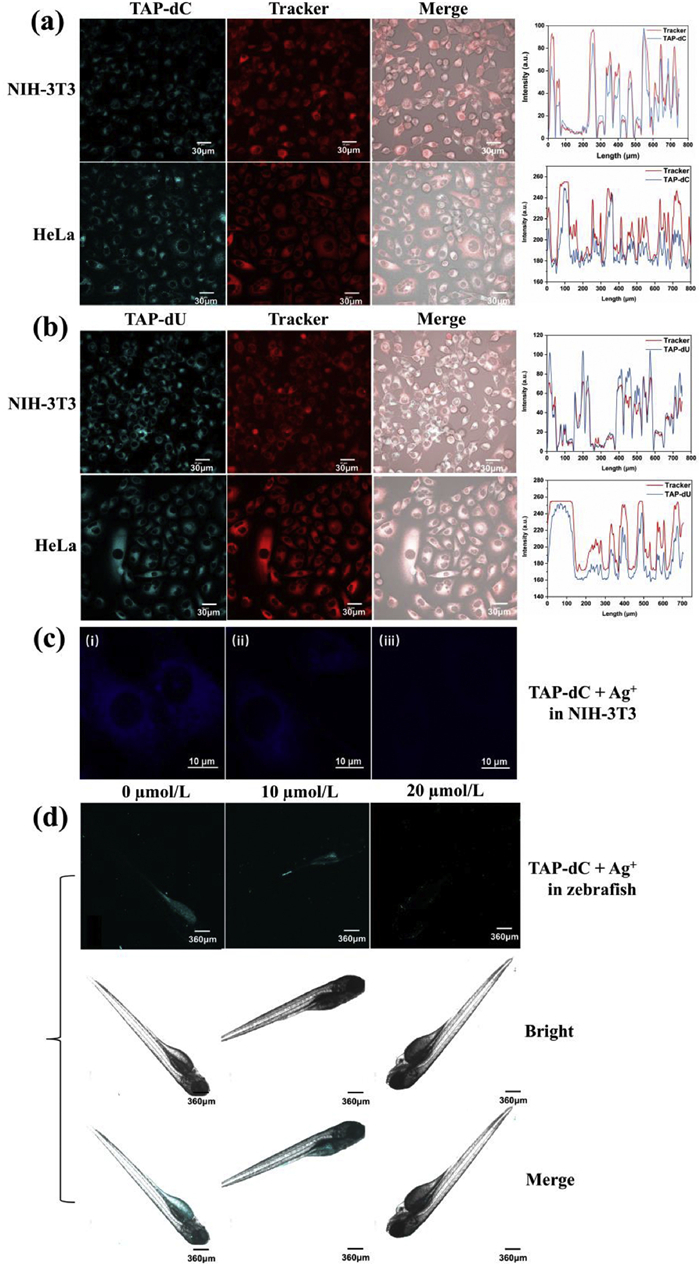
Herein, the NIH-3T3 and HeLa cells were individually co-incubated with commercial fluorescent dyes (ER-tracker Red) for ER for approximately 0.5 h. Then freshly prepared 20 µmol/L of TAP-dC in DMEM media was added and incubated for an additional 3.5 h at 37 ℃. The merged images showed overlap between the two channels, then Pearson’s colocalization coefficients were calculated as 0.70 in ER for NIH 3T3 and 0.70 in ER for HeLa cells, confirming that TAP-dC is specific localization in the ER of living cells (Fig. 5a). As comparisons, for ER colocalization assay, TAP-dU has also exhibited Pearson’s colocalization coefficients of 0.90 in NIH 3T3 and 0.87 in HeLa cells (Fig. 5b). In generally, the pH-responsive probe (TPA-dU) exhibits better targeted-imaging of the ER in both NIH-3T3 and HeLa cells, which may contribute to a deeper understanding of disease pathogenesis related to ER dysfunction in future research. Different from the chemical structures of our previously synthesized probes, such as rich DNA/RNA of nucleus-targeted-TPE-dC or TPE-dU, mitochondria-targeted TPE-FdU or RBH-U, and lysosomal-targeted RBH-EdC, the lipophilic TAP moiety of TAP-dC and TAP-dU might be helpful to interact with ER-specific proteins or receptors, including KDEL sequence (cytochrome P450, Sec61β, and Lys-Asp-Glu-Leu).
Figure 5
Figure 5.
(a) CLSM images of NIH-3T3 and HeLa cells after coincubation with TPA-dC (20 µmol/L) at 4 h. Pearson’s colocalization coefficients are 0.70 in ER for NIH 3T3 and 0.70 in ER for HeLa cells. (b) CLSM images of NIH-3T3 and HeLa cells after coincubation with TPA-dU (20 µmol/L) at 4 h. Pearson’s colocalization coefficients are 0.90 in NIH 3T3 and 0.87 in HeLa cells, ER targeting imaging in a different channel.Fluorescence imaging of Ag+ concentration-dependent incubated with TAP-dC at pH 7 for 1h (ⅰ) 0 µmol/L, (ⅱ) 10 µmol/L, (ⅲ) 20 µmol/L, (c) in NIH-3T3 and (d) in zebrafish. λex = 405 nm, λem = 500–550 nm. Scale bar: 360 µm.
To investigate whether TAP-dC is sensitive response to trace amounts of intracellular Ag+, NIH-3T3 cells were co-incubated with Ag+ ions ranging from 0 to 20 µmol/L. During this process, fluorescence imaging in the blue channel gradually diminished until it disappeared, which displays fluorescence quenching caused by the formation of TAP-dC/Ag+ (Fig. 5c). Simultaneously, Ag+ detection experiments were carried out on NIH-3T3 cell lysates at the specified culture concentrations (0, 10, 20 µmol/L). Quantitative analysis using ICP-MS revealed Ag+ concentrations of 8.74 and 17.87 µmol/L in samples cultured with 10 and 20 µmol/L of Ag+, respectively. These findings align with the intracellular Ag+ cell-imaging, confirming the detection accuracy of TAP-dC in complex biological samples.
Given TAP-dC’s biocompatibility, it shows promise as a sensitive probe for detecting intracellular Ag+. Encouraged by its successful application in live cell imaging, we extended its use to live tissue imaging. Zebrafish were incubated with varying Ag+ concentrations (0, 10, 20 µmol/L) for 1 h, and the result exhibited that the fluorescence imaging of zebrafish gradually decreases with the increasing concentration of Ag+, as shown in Fig. 5d. This demonstrates that TAP-dC fluorescence is quenched at 20 µmol/L of Ag+ and suggests its potential for in vivo Ag+ detection.
In this study, we present for the first time a facile method to synthesize ER probes based on nucleoside derivatives, then systematically analyzed the resulting hydrogen bonding networks and molecular structures using a combined approach that includes single-crystal X-ray diffraction, 1H NMR spectroscopy, and DFT calculations. These characterizations not only clarify specific interaction profiles of nucleosides but also establish a theoretical foundation for the structure-guided development of conjugated fluorophore-nucleoside probe systems. The pyridine core creates a distinctive D-π-A framework that promotes efficient ICT processes, thereby substantially enhancing the probes’ environmental sensitivity. Importantly, TAP-dU exhibits pH-dependent self-assembly, with its aggregate fluorescence color changing from blue to green to yellow as pH decreases, offering a dependable method for precise pH measurement. Cellular assays confirmed that both probes are excellent for biocompatibility for ER imaging. TAP-dC demonstrates strong selectivity for Ag+, with a detection limit of 0.2 µmol/L, highlighting its potential for real-time monitoring of Ag+ both intracellular and extracellular. Furthermore, beyond cellular experiments based on NIH-3T3 and HeLa cells, an in vivo Ag+ detection experiment was performed in animal models (zebrafish), further expanding the probe’s application scope. To address complex biological and medical challenges related to intracellular pH-ER fluctuations, we plan to develop imaging techniques that visualize ER-resident proteins or ER acidification during stress, guide the diagnosis of nonalcoholic fatty liver disease, and develop photodynamic cancer therapy.
CRediT authorship contribution statement
Linyu Zeng: Writing – original draft, Visualization, Validation, Methodology, Investigation, Formal analysis, Data curation. Weiran Ling: Visualization, Formal analysis, Data curation. Hai Xiong: Writing – review & editing, Writing – original draft, Supervision, Project administration, Funding acquisition, Conceptualization.
Declaration of competing interest
The authors declare that they have no known competing financial interests or personal relationships that could have appeared to influence the work reported in this paper.
Acknowledgment
This work is supported by the Science and Technology Innovation Commission of Shenzhen, China (No. JCYJ20250604182320028).
Supplementary materials
Supplementary material associated with this article can be found, in the online version, at doi:10.1016/j.cclet.2026.112941.
[1]
P. Xu, S.M. Zhong, Y.F. Wei, et al., ACS Nano 18 (2024) 21433–21446. doi: 10.1021/acsnano.4c06138
[2]
H. Ahmad, S. Muhammad, M. Mazhar, et al., Coord. Chem. Rev. 526 (2025) 216383. doi: 10.1016/j.ccr.2024.216383
[3]
P.H. Xiao, K. Ma, M.M. Kang, et al., Chem. Sci. 12 (2021) 13949–13957. doi: 10.1039/d1sc03932f
[4]
H.N. Cho, K.M. Huh, M.S. Shim, et al., Adv. Drug Deliv. Rev. 212 (2024) 115386. doi: 10.1016/j.addr.2024.115386
[5]
Y.F. Fan, F. Zhang, Y.M. Hao, et al., Adv. Funct. Mater. 35 (2025) 2416057. doi: 10.1002/adfm.202416057
J.V.S. Medeiros, A.P.T. Padilha, K.A. da Silva, et al., Dyes Pigm. 230 (2024) 112361. doi: 10.1016/j.dyepig.2024.112361
Figure 1
(a) Synthetic route for the preparation of TAP-dC and TAP-dU. (b) Stacking b-c plane diagram of TAP-dC unit cells. (c) Major intermolecular hydrogen bonding of the TAP-dC single crystal. (d) Stacking b-c plane diagram of TAP-dU unit cells. (e) Major intermolecular hydrogen bonding of the TAP-dU single crystal.
Figure 2
(a) The fluorescence emission spectra of TAP-dC at different pH levels. (b) pKa fitting curve of TAP-dC. (c) Fluorescence changes the visualization of TAP-dC at different pH levels. (d) The fluorescence emission spectra of TAP-dU under acidic conditions. (e) pKa1 fitting curve of TAP-dU. (g) The fluorescence emission spectra of TAP-dU under alkaline conditions. (h) pKa2 fitting curve of TAP-dU. (f, i) Fluorescence changes visualization of TAP-dU at different pH levels.
Figure 3
(a) The protonation, (b) 1H NMR spectra, (c) DFT calculated excited-state geometries, electron distribution, and energy levels on HOMO and LUMO of spectra of TAP-dC under acidic conditions. (d) The protonation, (e) 1H NMR spectra, and (f) DFT calculated excited-state geometries, electron distribution, and energy levels on HOMO and LUMO of spectra of TAP-dU at different pH.
Figure 4
(a) The fluorescence emission spectra of TAP-dU aggregates at different pH. (b) Fluorescence changes the visualization of TAP-dU at various pH levels. (c) HR-SEM packing partial c1-c3 and overall diagram c4-c6 of TAP-dU self-assembled aggregates at different pH-values (1, 4, and 7). (d) Fluorescence spectra of TAP-dC (10 µmol/L) after the addition of various metal ions (λem = 450 nm). (e) Fluorescence quenching by Ag+. (f) Fluorescence response to varying Ag+ concentrations (inset: linear correlation between TAP-dC/Ag+ intensity and Ag+ concentration). µM = µmol/L. (g) Comparison of fluorescence intensity for TAP-dC (5 µmol/L), TAP-dC + other metal ions (100 µmol/L), and TAP-dC/Ag+ + other metal ions (100 µmol/L).
Figure 5
(a) CLSM images of NIH-3T3 and HeLa cells after coincubation with TPA-dC (20 µmol/L) at 4 h. Pearson’s colocalization coefficients are 0.70 in ER for NIH 3T3 and 0.70 in ER for HeLa cells. (b) CLSM images of NIH-3T3 and HeLa cells after coincubation with TPA-dU (20 µmol/L) at 4 h. Pearson’s colocalization coefficients are 0.90 in NIH 3T3 and 0.87 in HeLa cells, ER targeting imaging in a different channel.Fluorescence imaging of Ag+ concentration-dependent incubated with TAP-dC at pH 7 for 1h (ⅰ) 0 µmol/L, (ⅱ) 10 µmol/L, (ⅲ) 20 µmol/L, (c) in NIH-3T3 and (d) in zebrafish. λex = 405 nm, λem = 500–550 nm. Scale bar: 360 µm.


 DownLoad:

 下载:
下载:


 下载:
下载:

