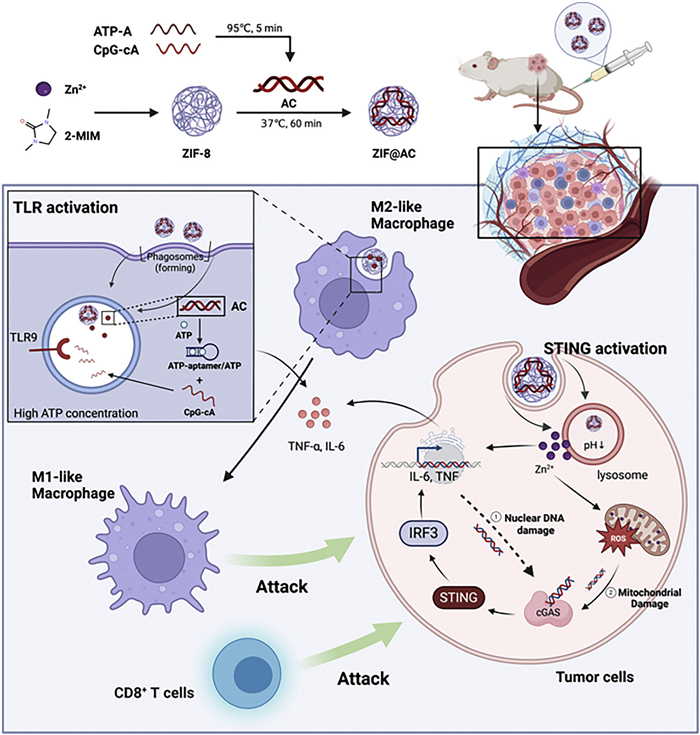
Scheme 1.
Schematic illustration of the construction of the ZIF@AC nanoagonist and its application in cancer immunotherapy via activation of the STING and TLR9 pathways.

Dual-stimuli responsive nanoagonist activating the STING and TLR9 pathways for enhanced immunotherapy
Zhiyu Zhang , Wenfei Xu , Zhitong Chen , Xiran He , Xujuan Li , Zishan Huang , Hong Sun , Zhaogang Sun , Hongqian Chu , Wenjing Liu


Cancer immunotherapy has revolutionized oncology, advancing from the conceptual framework of immune surveillance to the clinical success of immune checkpoint inhibitors [1–4] and cellular immunotherapy [5–7]. Despite remarkable clinical successes, eliciting a robust and sustained innate immune response to productively initiate adaptive immunity in most patients remains a major challenge [8–10]. These challenges are mainly driven by the immunosuppressive tumor microenvironment (TME) [11–13] and deficient activation of diverse immune pathways [14,15]. This, in turn, triggers a cascade of events, including low tumor immunogenicity [16,17], inadequate immune cell infiltration [18,19], and the accumulation of immunosuppressive cells [20–24], ultimately leading to immune escape and therapy resistance. To overcome these challenges, the cascade activation of key immune response initiation pathways and immune response amplification pathways is an urgently needed strategy [25].
Effective antitumor immune responses require activation of innate immune sensing pathways and engagement of adaptive immunity [26,27]. Among these, the stimulator of interferon genes (STING) and Toll-like receptor 9 (TLR9) have been extensively explored in antitumor immunotherapy because STING is known for its role in initiating immune responses [28], while TLR9 is recognized for amplifying immune effects [29]. However, the therapeutic efficacy achieved by activating TLR9 or STING alone is limited. This is because TLR9 agonists are weak interferon inducers [30,31], whereas STING agonists induce undesirable type 2 immune responses [32,33]. Notably, studies demonstrate that combining TLR9 and STING agonists offers a promising strategy to overcome these hurdles, as it simultaneously suppresses type 2 immunity and synergistically fosters a robust, beneficial type 1 immune response [34,35]. However, several formidable challenges currently impede the clinical translation of this combination strategy. The systemic administration of free STING and TLR9 agonists often leads to rapid clearance and dose-limiting off-target toxicity due to widespread activation outside the TME [36–38]. Moreover, effectively co-delivering these two distinct molecular agonists to the same innate immune cells within the tumor is logistically difficult, limiting the potential for synergistic effects.
To address these issues, nanomedicine offers a promising platform for the targeted and coordinated co-delivery of immunomodulatory agents [39–41]. Specifically, stimuli-responsive nanomaterials can be engineered to remain inert during circulation but to actively release their payload upon encountering unique pathological conditions, such as overexpressed enzymes (e.g., matrix metalloproteinases (MMPs)), an acidic pH and ATP [42]. This targeted activation strategy can maximize therapeutic efficacy while minimizing systemic side effects. Among the many nanomaterials, metal-organic frameworks (MOFs) have attracted increasing attention in nanomedicine due to their tunable porosity, high surface area, and biocompatibility [43,44]. In particular, zeolitic imidazolate framework-8 (ZIF-8), which is composed of tetrahedral zinc ions coordinated with 2-methylimidazole (2-MeIM) [45], has been extensively employed in delivery and release systems owing to its stability under physiological conditions and its pH-sensitive degradation in acidic environments [46,47]. Furthermore, studies have demonstrated that degradation of ZIF in acidic lysosomes gives rise to zinc ion (Zn2+) liberation. The released Zn2+ induces mitochondrial zinc overload and oxidative stress, which in turn promotes the release of mitochondrial DNA (mtDNA) [48,49]. As an endogenous damage-associated molecular pattern (DAMP), mtDNA can further activate the STING pathway [50]. Therefore, the ZIF platform, loaded with a TLR9 agonist, provides a strategy to simultaneously engage and synergize the STING and TLR9 signaling pathways [51].
As emerging evidence indicates that the STING pathway initiates the early immune phase by producing type I interferon (IFN-I), while TLR9 drives the effector phase through pro-inflammatory factors, we envisioned leveraging this synergy to design a dual-stimuli-responsive nanoplatform for sequential immune initiation and amplification in cancer therapy. Here, we report a nanoagonist that integrates pH-triggered Zn2+ release with ATP-activated CpG ODNs delivery, thereby achieving coordinated activation of the STING and TLR9 pathways (Scheme 1). The nanoagonist consists of two functional components: (1) ZIF, serving as both a carrier and a STING agonist, and (2) ATP-A/CpG-cA (AC), an ATP-activatable TLR9 agonist. The proposed mechanism is as follows: ZIF@AC is internalized into cells via endocytosis and is trafficked to lysosomes. There, the acidic environment triggers the biodegradation of the ZIF framework, resulting in the release of Zn2+ and the AC construct. The released Zn2+ induces mtDNA release and subsequent activation of the STING pathway. Concurrently, the AC module, upon encountering high cytoplasmic ATP concentrations, undergoes a structural change to release the active CpG ODNs, which in turn activate the TLR9 pathway. This dual-activation strategy based on a cascade-effect nanoagonist elicits robust antitumor immune responses with enhanced safety and efficacy, thus showing great potential for suppressing tumor growth and improving cancer immunotherapy.
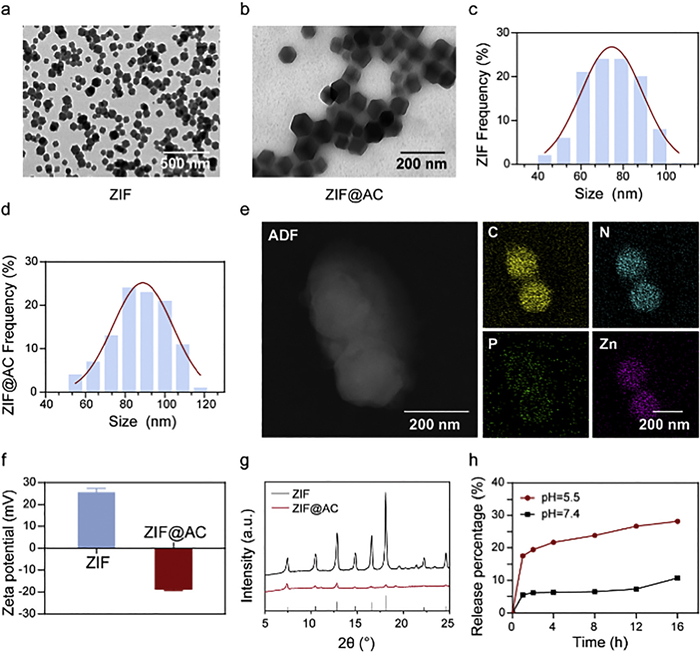
We first synthesized ZIF nanoparticles following established protocols by coordinating Zn2+ with 2-MeIM in water. Meanwhile, we constructed the ATP-responsive AC by hybridizing CpG oligodeoxynucleotides (ODNs) with ATP-specific aptamers and loaded them onto the surface of ZIF via electrostatic interactions, yielding the final nanoagonist, named ZIF@AC. Transmission electron microscopy (TEM) was conducted to investigate the morphological characteristics and apparent particle size of the synthesized ZIF and ZIF@AC nanoparticles. As presented in Figs. 1a-d, pristine ZIF nanoparticles exhibited an apparent particle size range of 40–100 nm, while the AC-modified ZIF@AC nanoparticles exhibited a size distribution of 50–125 nm. The adsorption of CpG further increased the thickness of ZIF@AC nanoparticles to approximately 15 nm, along with obvious alterations in surface topography. A typical smooth surface was observed for pristine ZIF particles, whereas ZIF@AC particles displayed a distinctly roughened surface, which was a direct morphological indication of the successful coating of AC on the ZIF matrix. The hydrodynamic size of the nanoparticles was further characterized via dynamic light scattering (DLS); the results showed that the hydrodynamic sizes of both ZIF and CpG-adsorbed ZIF@AC nanoparticles were marginally larger than their TEM-determined apparent particle sizes (Fig. S1 in Supporting information). Elemental mapping images of ZIF@AC further provided direct evidence for the intact Zn2+ coordination with imidazolate ligands in the ZIF framework and the successful adsorption of CpG onto ZIF (Fig. 1e). The zeta potential of ZIF shifted from +25.62 mV (unmodified state) to −18.79 mV after modification to ZIF@AC (Fig. 1f), which verified the effective surface adsorption of negatively charged AC. Powder X-ray diffraction (XRD) was subsequently employed to confirm the structural integrity of ZIF and ZIF@AC. The XRD pattern of the as-synthesized ZIF (Fig. 1g) exhibited sharp reflections that are in excellent agreement with the simulated pattern, confirming the high phase purity and crystallinity of the ZIF product. Importantly, the crystal structure of ZIF was preserved following AC incorporation. As reported in numerous studies, ZIF undergoes acid-triggered degradation, which mediates the cargo release. Therefore, in vitro Zn2+ release experiments were performed in phosphate buffered saline (PBS) at various pH values to assess the pH-responsive behavior of ZIF@AC (Fig. 1h). ZIF@AC showed a minimal release in pH 7.4 PBS, with only ~10% of Zn2+ released after 16 h. In contrast, a significantly faster Zn2+ release rate was observed in acidic PBS at pH 5.5 (mimicking the endosomal/lysosomal microenvironment), with a cumulative Zn2+ release of ~30%. Collectively, these results confirm the successful synthesis of ZIF@AC and demonstrate its ability to undergo acid-triggered degradation and achieve targeted Zn2+ release in the acidic lysosomal microenvironment.
The ATP aptamer (ATP-A) used in this study is a DNA sequence capable of specifically binding two ATP molecules [52]. To achieve ATP-responsive release of CpG, we designed a complementary hybridization system. The CpG sequence was extended by 16 nucleotides at the 3′-end to generate a complementary region (CpG-cA), allowing hybridization with ATP-A. To validate efficient hybridization and optimize the ratio of ATP-A: CpG-cA, ATP-A was labeled at its 3′-end with a black hole quencher (BHQ3), and CpG-cA was labeled at its 5′-end with a Cy5 fluorophore. Upon hybridization, the proximity of Cy5 to BHQ3 led to fluorescence quenching. Notably, a molar ratio of 1.5:1 (ATP-A: CpG-cA) afforded effective fluorescence quenching. This quenching efficiency was significantly higher than that at the 1:1 ratio but statistically comparable to that at the 2:1 ratio (Fig. S2 in Supporting information). Therefore, the 1.5:1 ratio was used for AC synthesis. Agarose gel electrophoresis (AGE) further verified successful ATP-A/CpG-cA hybridization, as evidenced by the mobility shift of the DNA duplex (Fig. S3 in Supporting information). These results confirm successful hybridization between ATP-A and CpG-cA via complementary pairing, with an optimal 1.5:1 molar ratio for stable duplex formation. This establishes a reliable ATP-responsive system for controlled CpG release.
To verify the ATP-responsive release of the AC complex, we first analyzed DNA duplex dissociation by AGE. As shown in Fig. S3, ATP addition resulted in two new bands corresponding to free CpG-cA and ATP-A, confirming that ATP competitively binds to ATP-A and triggers CpG-cA release. Next, we quantified the fluorescence intensity of CpG present in the supernatant obtained after centrifugation of the as-synthesized ZIF@AC. Using a standard curve, ZIF exhibited a loading capacity of 19.96 nmol CpG per mg (Fig. S4 in Supporting information). With moderate excessive CpG addition to guarantee full adsorption saturation, the corresponding loading efficiency was calculated to be 62.38%. We further confirmed ZIF@AC release behavior using a fluorescence quenching assay. Before ATP addition, the Cy5 fluorophore on CpG-cA was efficiently quenched by the BHQ3 on ATP-A. Upon ATP addition, fluorescence intensity increased significantly (Fig. S5 in Supporting information), indicating duplex dissociation and release of CpG-cA. The release was ATP-concentration-dependent, notably, Cy5 fluorescence recovery rising sharply when ATP concentration exceeded 5 mmol/L, which is over 4-fold higher than 4 mmol/L, suggesting a concentration-dependent release mechanism with a threshold effect.
The above results indicate the ZIF@AC system successfully integrates dual stimulus responsiveness for CpG and Zn2+ delivery. In detail, ZIF@AC exploits the acid-responsive degradation properties of ZIF to restrict premature AC and Zn2+ release in neutral normal tissues while facilitating AC and Zn2+ release in lysosomes, while simultaneously utilizing the ATP-triggered dissociation of the AC complex to further promote CpG release in ATP-abundant intracellular regions. This dual-responsive release behavior ensures CpG and Zn2+ are controllably delivered to specific target regions (e.g., acidic endo/lysosomes where TLR9 is localized and ATP-rich intracellular sites), thereby improving receptor engagement and boosting immunostimulatory effects.
To assess the biocompatibility of the nanoagonist, we conducted in vitro cytotoxicity assays using RAW264.7 macrophages. Following incubation with varying doses of ZIF and ZIF@AC for 24 h, cell viability was assessed using the cell counting kit-8 (CCK-8) assay. As shown in Fig. S6 (Supporting information), ZIF exhibited dose-dependent cytotoxicity. Cell viability was maintained at a high level at concentrations below 40 µg/mL, yet dropped markedly to approximately 70% at 50 µg/mL. The half-maximal inhibitory concentration (IC50) of ZIF was calculated to be 55.04 µg/mL, indicating ZIF alone exhibits some cytotoxicity at medium to high concentrations. Interestingly, when AC was loaded into ZIF (ZIF@AC), cytotoxicity was further reduced across all tested concentrations. This result indicates that ZIF@AC showed excellent biocompatibility in RAW264.7 macrophages compared with ZIF, mainly due to the biocompatibility of AC.
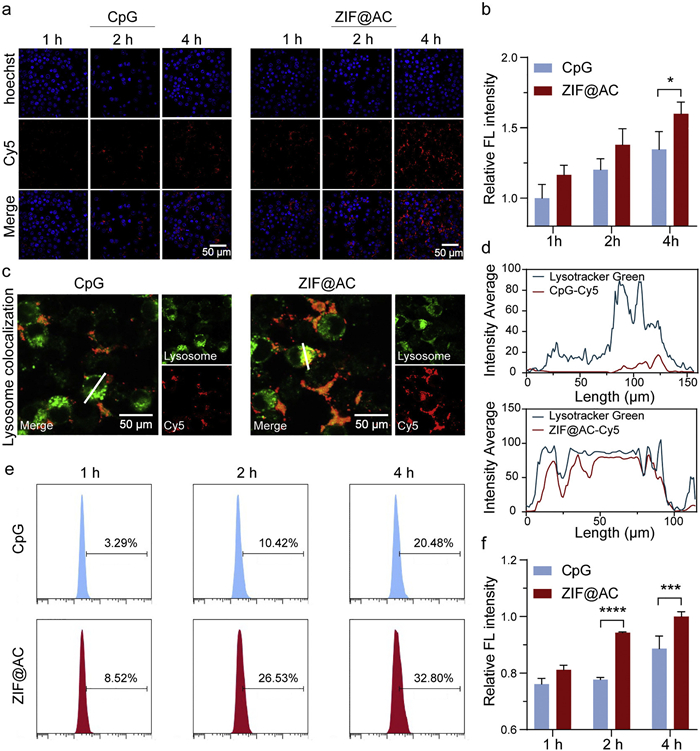
Efficient intracellular delivery of CpG is critical for TLR9 activation and subsequent immune stimulation. To assess the internalization efficiency of CpG with or without nanocarrier-assisted delivery, we performed confocal laser scanning microscopy (CLSM) to monitor internalization in RAW264.7 macrophages, with Cy5-labeled CpG (CpG-Cy5) used for tracking. As illustrated in Figs. 2a and b, quantitative analysis of the fluorescence signals revealed that cells treated with free CpG-Cy5 exhibited relatively low cellular internalization, with only a 1.346-fold increase in relative mean fluorescence intensity (MFI) after 4 h of incubation. In comparison, cells treated with Cy5-labeled ZIF@AC exhibited a 1.6-fold increase in relative MFI after incubation, suggesting a moderate improvement in cellular uptake efficiency. This finding suggests that the ZIF carrier enables efficient cellular entry, likely through clathrin- or caveolae-mediated endocytosis, in contrast to the passive diffusion mechanism of free CpG [53]. Lysosomal colocalization was further verified using LysoTracker Green staining (Figs. 2c and d); overlapping red (CpG-Cy5) and green (lysosomal) signals demonstrated that ZIF@AC is efficiently trafficked to lysosomes at 4 h after endocytosis, where TLR9 is predominantly localized, supporting the hypothesis that CpG is released in its functional active compartment. To determine whether this uptake efficiency was limited to immune cells, we performed flow cytometry experiments in 4T1 breast cancer cells. CLSM imaging of 4T1 cells additionally confirmed the superior intracellular accumulation of Cy5-labeled ZIF@AC relative to free CpG-Cy5, with more intense red fluorescence signals observed in ZIF@AC-treated tumor cells (Fig. S7 in Supporting information). Consistent trends were observed: Cy5-labeled ZIF@AC exhibited significantly stronger intracellular fluorescence compared with free CpG-Cy5 (Figs. 2e and f). These results confirm that ZIF@AC effectively enhances intracellular uptake across diverse cell types, including both tumor and immune cells. Together, these data demonstrate that ZIF@AC markedly improves intracellular delivery and lysosomal localization of CpG, facilitating efficient engagement of endosomal TLR9 to elicit immunostimulation.
Recent studies have identified mtDNA as a critical endogenous ligand of the cyclic GMP-AMP synthase (cGAS)-STING pathway, particularly when released into the cytosol upon mitochondrial stress, thereby triggering innate immune activation [54]. In this regard, we investigated whether ZIF@AC could activate the cGAS-STING pathway via Zn2+-induced mtDNA release and mitochondrial reactive oxygen species (mtROS) generation. We first assessed intracellular Zn2+ accumulation in 4T1 cells using CLSM with zinquin ethyl ester, a zinc-specific fluorescent probe. As shown in Fig. S8 (Supporting information), after incubation with various formulations, including HEPES buffered saline (HBS) (blank control), free CpG (TLR9 agonist alone), ZIF (nanocarrier alone), ZIF@CpG (CpG-loaded ZIF), ZIF@mAC (modified AC-loaded ZIF; a mutated ATP aptamer that cannot respond to ATP or release active CpG, serving as a non-functional control) and ZIF@AC (AC-loaded ZIF), 4T1 cells treated with ZIF@AC exhibited intense blue fluorescence signals, confirming efficient Zn2+ delivery and prominent intracellular accumulation. This fluorescence intensity was significantly greater than that observed in cells exposed to free CpG or buffer alone. Next, we quantified mtROS production using 2′,7′-dichlorodihydrofluorescein diacetate (DCFH-DA) staining. The relative MFI in ZIF@AC-treated cells was approximately 2.4-fold higher than that in the HBS control group and 1.7-fold higher than that in the free CpG group (Figs. 3a and b), indicating a significant induction of mtROS generation. Concomitantly, we observed a 1.14-fold increase in the γ-H2AX fluorescence intensity, a well-characterized biomarker of mitochondrial and nuclear DNA damage, in ZIF@AC-treated cells relative to the HBS treated group, suggesting that reactive oxygen species (ROS)-mediated oxidative stress led to DNA damage and leakage into the cytosol (Figs. 3c and d). This finding implied that the mitochondrial and nuclear DNA in the ZIF@AC group underwent significant damage, thereby establishing a cellular microenvironment conducive to the robust activation of the STING pathway. Furthermore, immunofluorescence staining of double-stranded DNA (dsDNA) was performed to directly visualize mtDNA leakage, a key event for cGAS recognition. As shown in Fig. S9 (Supporting information), marked cytosolic dsDNA puncta were observed in ZIF, ZIF@CpG, ZIF@mAC, ZIF@AC-treated cells, whereas only weak background signals were detected in the HBS control group. These results further confirmed that ZIF@AC triggers substantial mitochondrial damage and cytoplasmic dsDNA release. To directly verify activation of the cGAS-STING pathway, we performed Western blot to detect the phosphorylation of STING, TANK-binding kinase 1 (TBK1) and interferon regulatory factors (IRFs), key downstream effectors of this signaling axis. Compared with HBS-treated and CpG-treated groups, ZIF@AC treatment led to substantial upregulation of phosphorylated STING (p-STING), phosphorylated TBK1 (p-TBK1) and phosphorylated IRF3 (p-IRF3) expression (Fig. 3e), demonstrating potent activation of the cGAS-STING pathway by ZIF@AC. Notably, these molecules are known to facilitate cytotoxic T lymphocyte (CTL) recruitment and activation within TME. Collectively, these results confirm that ZIF@AC efficiently activates the cGAS-STING pathway by the induction of mitochondrial stress, cytosolic leakage of damaged DNA, and Zn2+-mediated enhancement of cGAS enzymatic activity, thereby initiating a robust innate immune response.
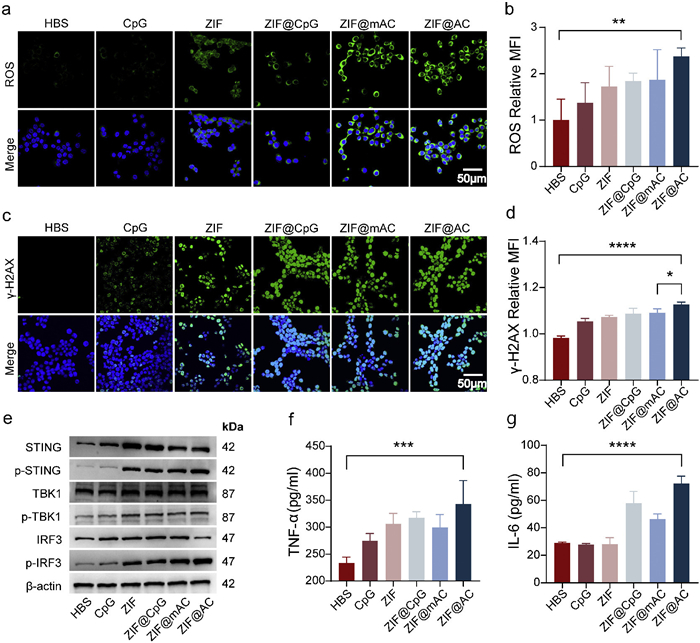
To assess the activation effect of TLR9 signaling by ZIF@AC, we evaluated its capacity to induce proinflammatory cytokine production in RAW264.7 macrophages. After incubation with various formulations, cytokine levels in the cell culture supernatant were quantified by enzyme-linked immunosorbent assay (ELISA). As shown in Figs. 3f and g, treatment with ZIF@AC resulted in significantly higher secretion of interleukin-6 (IL-6) and tumor necrosis factor-α (TNF-α) compared with all other groups. While free CpG and ZIF alone elicited only minimal cytokine production, the combination in ZIF@AC synergistically augmented the innate immune response. These results demonstrate robust activation of both TLR9- and STING-associated inflammatory signaling pathways. The enhanced immune activation observed with ZIF@AC can be attributed to multiple coordinated factors: Enhanced intracellular uptake of CpG, controlled release of CpG in the lysosomal compartment, and cGAS-STING pathway activation mediated by Zn2+ and mitochondrial stress. Collectively, these complementary pathways act in concert to trigger a robust innate immune reaction.
Encouraged by the excellent in vitro findings, we further extended our investigation to in vivo settings using subcutaneously implanted 4T1 mammary tumor bearing BALB/c mice, with the aim of assessing the antitumor activity of ZIF@AC (all in vivo experiments were approved by the Institutional Animal Care and Use Committee of Beijing Tuberculosis and Thoracic Tumor Research Institute). First, we examined the in vivo biodistribution and tumor-homing behavior of ZIF@AC following tail vein injection. As shown in Figs. 4a and c, the fluorescent signal in the tumor region increased rapidly, peaking at approximately 3.30 × 10⁸ [p/s/cm2/sr]/ [µW/cm2] at the 1-h time point, and gradually weakened to 6.99 × 10⁷ [p/s/cm2/sr]/ [µW/cm2] within 24 h. In addition, Fig. 4b and Fig. S10 in Supporting information illustrate the biodistribution and metabolism of ZIF@AC in major organs of the mice. Compared to the CpG-treated group, the ZIF@AC-treated group still exhibited substantially stronger fluorescence intensity in the tumor tissue, with fluorescence intensities 2- and 2.27-fold higher than those in the CpG-treated group at 7 and 24 h, respectively, this finding confirms its remarkable tumor-targeting and retention capabilities. Notably, at both 7- and 24-h time points, relatively strong fluorescent signals were also observed in the kidneys, reaching approximately 6.84-fold to 4.66-fold that of the liver signal intensity in the ZIF@AC-treated group, indicating that renal clearance is a primary metabolic pathway for the nanocarrier or its components.
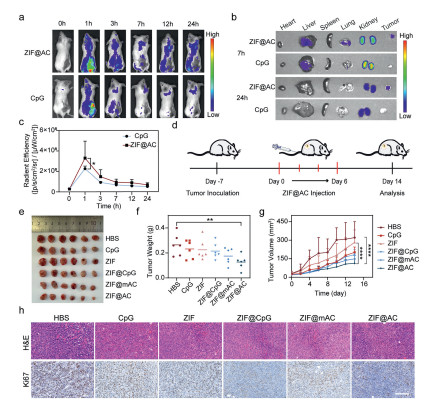
To further verify the in vivo therapeutic efficacy of ZIF@AC, a 4T1 tumor-bearing BALB/c mouse model was successfully established, as illustrated in Fig. 4d. When tumor volumes grew to around 20 mm3, the mice were randomly allocated into six distinct groups, including HBS, CpG, ZIF, ZIF@CpG, ZIF@mAC, and ZIF@AC. After 7 days of treatment, the ZIF@AC group displayed superior antitumor efficacy, as evidenced by significant decreases in tumor mass and volume when compared with both the HBS group and the remaining treatment groups (Figs. 4e-g and Fig. S11 in Supporting information). This enhanced therapeutic effect was attributed to the synergistic activation of the STING and TLR9 pathways, which directly impaired tumor cell viability and suppressed tumor proliferation, thereby driving robust antitumor efficacy. Importantly, negligible fluctuations in body weight were detected across all treatment groups (Fig. S12 in Supporting information), indicating that ZIF@AC exhibits favorable biosafety in vivo. To further demonstrate its therapeutic efficacy in vivo, hematoxylin and eosin (H&E) staining and Ki67 immunohistochemical (IHC) staining of tumor tissues were performed (Fig. 4h). In the ZIF@AC group, a large number of small and deeply stained inflammatory cells, predominantly lymphocytes, were observed with focal aggregation and diffuse scattered distribution. The ZIF@AC group displayed markedly enhanced overall infiltration density and range of inflammatory cells relative to the HBS group. In sharp contrast, the HBS group showed only sporadic and scattered distribution of inflammatory cells without obvious focal aggregation, presenting with low infiltration density and a narrow scope. The tumor tissue sections of the HBS group were almost entirely covered by dense tumor cells, corresponding to the least inflammatory cell infiltration among all groups. Additionally, Ki67 IHC staining showed that Ki67 expression was substantially decreased in the ZIF@AC and ZIF@CpG groups, indicative of effective inhibition toward tumor cell proliferation. Overall, these results underscore the great promise of ZIF@AC as an effective therapeutic formulation for inhibiting tumor growth in vivo.
These results demonstrate the systemic antitumor potency of ZIF@AC. Subsequently, a series of systematic assessments further verified the favorable biocompatibility of this nanoagonist. A comprehensive toxicological evaluation of ZIF@AC was performed, including blood routine, blood biochemical tests, H&E staining of vital organs, and hemolysis assays. Blood routine and serum biochemistry profiles were comparable between the ZIF@AC and HBS groups, confirming its favorable biocompatibility (Figs. S13 and S14 in Supporting information). Regarding H&E staining of major organs, this histological analysis showed no apparent tissue damage in the ZIF@AC group and all other groups (Fig. S15 in Supporting information). As for hemolysis evaluation, images of red blood cells (RBCs) incubated with ZIF@AC revealed no obvious hemolysis, and the corresponding hemolysis rates were below 5% (Fig. S16 in Supporting information). Collectively, these results from multiple independent safety assessments demonstrate that ZIF@AC exhibits excellent biosafety in vivo.
Building upon the promising in vitro immune activation outcomes, we established a murine 4T1 tumor model to comprehensively evaluate the early (within 7 days) antitumor immune responses induced by the ZIF@AC nanoagonist. Flow cytometry assays were performed to characterize multiple immune parameters reflecting the early (within 7 days) antitumor immune-inducing capacity of ZIF@AC, with analyses conducted in the order of M1 tumor-associated macrophages (TAMs), mature dendritic cells (DCs), T lymphocytes and pro-inflammatory cytokines to systematically dissect the in vivo immune-stimulatory effects of ZIF@AC. We first investigated the polarization of TAMs, a major immune cell population in the TME that modulates antitumor immunity: M1-type TAMs display pro-inflammatory and antitumor activities, whereas M2-type TAMs possess immunosuppressive and protumor characteristics. Flow cytometry contour plots of M1 TAMs (F4/80+CD86+) in tumor tissues showed a marked increase in the ZIF@AC group (Fig. 5a). Quantitative analysis further verified that the percentage of M1 TAMs in the ZIF@AC group was markedly increased to 9.30% ± 1.01%. This value was nearly 3.3-fold that in the HBS control group (2.81% ± 0.23%) and also notably higher than the corresponding ratio in the ZIF group (4.32% ± 0.46%) (Fig. 5b). Correspondingly, the M1/M2 TAM ratio in the ZIF@AC group was increased to 4.39% ± 0.54%, which was significantly higher than the HBS group (1.21% ± 0.45%) (Fig. S17 in Supporting information), demonstrating that ZIF@AC effectively reprograms TAMs toward the antitumor M1 phenotype to alleviate the tumor immunosuppressive microenvironment.
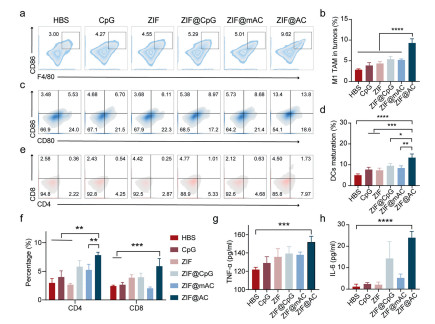
Next, we examined the maturation status of DCs. As key antigen-presenting cells that link innate and adaptive immune responses, DCs play an indispensable role in triggering antitumor T-cell immunity. Mature DCs with elevated levels of the costimulatory markers CD80 and CD86 are capable of effectively presenting tumor antigens to T cells, thereby promoting their activation and expansion. Flow cytometric analysis of tumor-infiltrating mature DCs (mDCs, CD80+CD86+) showed that their proportion was notably increased in the ZIF@AC group (Fig. 5c). Quantitative analysis confirmed that the proportion of mDCs in the ZIF@AC group reached 13.43% ± 1.78%, representing a significant increase relative to all other groups (Fig. 5d). This enhanced DC maturation is attributed to ZIF@AC-triggered STING pathway activation and cellular oxidative stress, which induces the release of damage-associated molecular patterns (DAMPs, e.g., mitochondrial and nuclear DNA) to elevate tumor immunogenicity, while soluble factors derived from STING pathway activation amplify innate immune responses, collectively forming a robust inflammatory milieu that drives the functional maturation of DCs. Subsequently, we analyzed tumor-infiltrating T cell subsets, the core effector cells of adaptive antitumor immunity, via flow cytometry (Fig. 5e). Quantitative results showed that ZIF@AC treatment significantly elevated the proportions of both CD4+ helper T cells and CD8+ cytotoxic T cells in tumor tissues: The proportion of CD4+ T cells in the ZIF@AC group was 7.82% ± 0.51%, which was significantly higher than the HBS group (4.00% ± 1.08%), and the proportion of CD8+ T cells reached 5.90% ± 1.35%, approximately 2.4-fold higher than that in the HBS group (2.44% ± 0.15%) (Fig. 5f). This significant elevation is a direct reflection of the enhanced antitumor adaptive immune response induced by ZIF@AC.
Finally, ELISA assays were conducted to detect the secretion of pro-inflammatory cytokines in tumor homogenates, and the results showed that ZIF@AC treatment induced prominent upregulation of TNF-α and IL-6 (Figs. 5g and h). Specifically, the concentration of TNF-α in the ZIF@AC group was 151.70 ± 6.50 pg/mL, which was significantly higher than the HBS group (121.80 ± 2.46 pg/mL). Similarly, the IL 6 concentration in the ZIF@AC group was 23.99 ± 2.94 pg/mL, nearly 20.7-fold that detected in the HBS group (1.16 ± 1.19 pg/mL). These pro-inflammatory cytokines can further amplify the local inflammatory response in the TME, recruit more antitumor immune cells to the tumor site, and enhance the antitumor activity of effector immune cells, thus forming a positive feedback loop of immune activation. Collectively, ZIF@AC exerts a robust immunotherapeutic effect in vivo by potently reprogramming TAMs toward the antitumor M1 phenotype, promoting the functional maturation of DCs, elevating the infiltration of tumor-reactive CD4+ and CD8+ T cells, and enhancing the secretion of pro-inflammatory cytokines, thereby comprehensively reversing the tumor immunosuppressive microenvironment and activating a robust antitumor immune response.
In this study, we developed a dual-stimuli responsive nanoagonist, named ZIF@AC, designed to synergistically activate the TLR9 and cGAS-STING pathways for enhanced cancer immunotherapy. The system combines ATP-responsive release of CpG with pH-sensitive disassembly of ZIF, enabling precise delivery and activation of immune signaling cascades within acidic and ATP-rich intracellular environments. ZIF@AC demonstrated excellent stability under physiological conditions, efficient cellular uptake, and controlled release behavior in response to acidic and ATP stimuli. It enhanced TLR9 signaling through lysosomal CpG release and simultaneously triggered cGAS-STING activation by promoting mitochondrial oxidative stress and Zn2+-induced DNA damage. These dual effects led to increased production of proinflammatory cytokines and maturation of immune cells [55]. Overall, our findings highlight the promise of ZIF@AC as a potential nano-immunotherapeutic strategy capable of overcoming immunosuppressive TME and immune insufficiency caused by single agonists in solid tumors. This work provides a foundation for the rational design of multifunctional nanoagonist and supports their further exploration in vivo models and clinical translation.
Zhiyu Zhang: Writing – original draft, Methodology, Investigation, Data curation. Wenfei Xu: Writing – original draft, Methodology, Investigation, Data curation. Zhitong Chen: Writing – original draft, Methodology, Investigation. Xiran He: Writing – review & editing. Xujuan Li: Writing – review & editing. Zishan Huang: Writing – review & editing. Hong Sun: Writing – review & editing. Zhaogang Sun: Writing – review & editing, Supervision. Hongqian Chu: Writing – review & editing, Supervision, Funding acquisition. Wenjing Liu: Writing – review & editing, Supervision, Funding acquisition, Conceptualization.
The authors declare that they have no known competing financial interests or personal relationships that could have appeared to influence the work reported in this paper.
This work was supported by the Science and Technology Plan Project of Tongzhou District, Beijing (Nos. WS2025019, WS2025069), the Capital Medical University Research Cultivation Project (No. PYZ25156). The Shematic illustrations in this work was created in BioRender (
Supplementary material associated with this article can be found, in the online version, at doi:
D.M. Pardoll, Nat. Rev. Cancer 12 (2012) 252–264. doi: 10.1038/nrc3239
A. Ribas, J.D. Wolchok, Science 359 (2018) 1350–1355. doi: 10.1126/science.aar4060
M.A. Postow, M.K. Callahan, J.D. Wolchok, J. Clin. Oncol. 33 (2015) 1974–1982. doi: 10.1200/JCO.2014.59.4358
C. Robert, Nat. Commun. 11 (2020) 3801. doi: 10.1038/s41467-020-17670-y
M. Tarannum, X. Ding, M. Barisa, et al., Nat. Biotechnol. 43 (2025) 516–533. doi: 10.1038/s41587-025-02629-5
O. Tsahouridis, M. Xu, F. Song, et al., Nat. Cancer 6 (2025) 1145–1156. doi: 10.1038/s43018-025-01015-z
A. Fenis, O. Demaria, L. Gauthier, et al., Nat. Rev. Immunol. 24 (2024) 471–486. doi: 10.1038/s41577-023-00982-7
D. Memon, A.J. Schoenfeld, D. Ye, et al., Cancer Cell 42 (2024) 209–224.e9. doi: 10.1016/j.ccell.2023.12.013
Q. Sun, Z. Hong, C. Zhang, et al., Signal Transduct. Target Ther. 8 (2023) 320. doi: 10.1038/s41392-023-01522-4
J. Leinwand, G. Miller, Nat. Immunol. 21 (2020) 1152–1159. doi: 10.1038/s41590-020-0761-y
K.B. Kennel, F.R. Greten, Nat. Rev. Cancer 25 (2025) 945–964. doi: 10.1038/s41568-025-00872-1
J.Y. Deng, Q. Gou, L. Yang, et al., J. Immunother. Cancer 11 (2023) e007218. doi: 10.1136/jitc-2023-007218
K. Aliazis, A. Christofides, R. Shah, et al., Nat. Cancer 6 (2025) 924–937. doi: 10.1038/s43018-025-00986-3
J. Sawada, Y. Kikuchi, M. Duah, et al., Nat. Immunol. 26 (2025) 1766–1780. doi: 10.1038/s41590-025-02259-8
W. Yan, Y. Cao, S. Xu, et al., Adv. Mater. 37 (2025) 2411361. doi: 10.1002/adma.202411361
Y.T. Liu, Y.L. Wang, S. Wang, et al., Mol. Cancer 24 (2025) 254. doi: 10.1049/icp.2025.3057
M. Ochoa de Olza, B. Navarro Rodrigo, S. Zimmermann, et al., Lancet Oncol. 21 (2020) e419–e430. doi: 10.1016/S1470-2045(20)30234-5
T. Zhang, W. Yu, X. Cheng, et al., Sci. Immunol. 9 (2024) eadh2334. doi: 10.1126/sciimmunol.adh2334
X. Wang, Z. Wang, Q. Liao, et al., Nat. Commun. 16 (2025) 3348. doi: 10.1038/s41467-025-58511-0
C.J. Imianowski, Q. Chen, C.J. Workman, et al., Nat. Rev. Cancer 25 (2025) 703–722. doi: 10.1038/s41568-025-00832-9
P. Yuan, X. Xu, D. Hu, et al., J. Am. Chem. Soc. 145 (2023) 7941–7951. doi: 10.1021/jacs.2c13218
J. Xu, L. Ding, J. Mei, et al., Signal Transduct. Target Ther. 10 (2025) 268. doi: 10.3390/land14020268
S. Joshi, A. Sharabi, Pharmacol. Ther. 235 (2022) 108114. doi: 10.1016/j.pharmthera.2022.108114
S. He, L. Zheng, C. Qi, Mol. Cancer 24 (2025) 5. doi: 10.1109/cisat66811.2025.11181725
K.A. Warrick, C.N. Vallez, H.E. Meibers, et al., Annu. Rev. Immunol. 43 (2025) 489–514. doi: 10.1146/annurev-immunol-083122-040624
A. Iwasaki, R. Medzhitov, Science 327 (2010) 291–295. doi: 10.1126/science.1183021
A. Iwasaki, R. Medzhitov, Nat. Immunol. 16 (2015) 343–353. doi: 10.1038/ni.3123
Z. Zhang, C. Zhang, Nat. Rev. Immunol. 25 (2025) 425–444. doi: 10.1038/s41577-024-01112-7
Z. Lv, X. Guo, R. Zhang, et al., J. Am. Chem. Soc. 147 (2025) 13545–13555. doi: 10.1021/jacs.5c00481
D. Verthelyi, K.J. Ishii, M. Gursel, et al., J. Immunol. 166 (2001) 2372–2377. doi: 10.4049/jimmunol.166.4.2372
A.M. Krieg, Nat. Rev. Drug Discov. 5 (2006) 471–484. doi: 10.1038/nrd2059
B. Temizoz, K. Hioki, S. Kobari, et al., Int. Immunol. 34 (2022) 353–364. doi: 10.1093/intimm/dxac012
C.K. Tang, T. Aoshi, N. Jounai, et al., PLoS One 8 (2013) e60038. doi: 10.1371/journal.pone.0060038
Y. Sun, L. Liu, H. He, et al., J. Control. Release 379 (2025) 327–343. doi: 10.1117/12.3085475
Y. Li, Z. Chen, X. Lu, et al., Nano Res. 16 (2023) 13322–13334. doi: 10.1007/s12274-023-6295-5
B.R. Kimmel, K. Arora, N.C. Chada, et al., Nat. Biomed. Eng. 9 (2025) 1719–1739. doi: 10.1038/s41551-025-01400-0
N.S. Hsu, C. Tang, R.V. Mendes, et al., Nat. Chem. 17 (2025) 1941–1951. doi: 10.1038/s41557-025-01930-9
X. Liu, S. Chen, J. Huang, et al., Nat. Nanotechnol. 19 (2024) 1745–1756. doi: 10.1038/s41565-024-01759-2
Y. Guo, Q. Bao, P. Hu, et al., Nat. Commun. 14 (2023) 7306. doi: 10.1038/s41467-023-42972-2
A.J. Grippin, D. Lee, E.E. Parkes, et al., Nat. Cancer 6 (2025) 1311–1325. doi: 10.1038/s43018-025-01025-x
H. Zhang, C. Liang, X. Ding, et al., Chin. Chem. Lett. 36 (2025) 110525. doi: 10.1016/j.cclet.2024.110525
L. Xue, A.S. Thatte, D. Mai, et al., Nat. Rev. Mater. 9 (2024) 100–118.
Y. Sun, L. Zheng, Y. Yang, et al., Nano-Micro Lett. 12 (2020) 103. doi: 10.1007/978-981-15-7056-8_7
C. He, D. Liu, W. Lin, Chem. Rev. 115 (2015) 11079–11108. doi: 10.1021/acs.chemrev.5b00125
H. Zheng, Y. Zhang, L. Liu, et al., J. Am. Chem. Soc. 138 (2016) 962–968. doi: 10.1021/jacs.5b11720
S. Hu, L.L. Yang, C. Yan, et al., Chem. Eng. J. 498 (2024) 154844. doi: 10.1016/j.cej.2024.154844
B. Liu, W. Xu, W. Xu, et al., Chin. Chem. Lett. 37 (2026) 111851. doi: 10.1016/j.cclet.2025.111851
B. Ding, H. Chen, J. Tan, et al., Angew. Chem. Int. Ed. 62 (2023) e202215307. doi: 10.1002/anie.202215307
J. Li, W. Lv, Z. Han, et al., Adv. Sci. 12 (2025) 2501542. doi: 10.1002/advs.202501542
J. Kim, H.S. Kim, J.H. Chung, Exp. Mol. Med. 55 (2023) 510–519. doi: 10.1038/s12276-023-00965-7
S. Liang, J. Yao, D. Liu, et al., Chin. Chem. Lett. 36 (2025) 109856. doi: 10.1016/j.cclet.2024.109856
L. Sun, F. Shen, L. Tian, et al., Adv. Mater. 33 (2021) 2007910. doi: 10.1002/adma.202007910
J. Yan, G. Wang, L. Xie, et al., Adv. Mater. 34 (2022) 2105783. doi: 10.1002/adma.202105783
Z. Ding, R. Wang, Y. Li, et al., Mol. Cell 85 (2025) 2610–2625.e5. doi: 10.1016/j.molcel.2025.06.005
C. Deng, J. Zhang, Y. Yang, et al., Small 21 (2025) e2503117. doi: 10.1002/smll.202503117

Scheme 1 Schematic illustration of the construction of the ZIF@AC nanoagonist and its application in cancer immunotherapy via activation of the STING and TLR9 pathways.

Figure 1 Characterizations of the ZIF and ZIF@AC. (a, b) TEM images of ZIF and ZIF@AC. (c, d) Size distribution of ZIF and ZIF@AC. (e) Elemental mapping images of ZIF@AC. (f) Zeta potentials of ZIF and ZIF@AC. (g) XRD patterns of ZIF and ZIF@AC. (h) Zn2+ release profiles from ZIF@AC in PBS solution (pH 7.4 and 5.5). Data are presented as mean ± SD (n = 3).

Figure 2 In vitro cellular uptake of nanomedicine. (a, b) Confocal microscope images and corresponding fluorescence intensities of RAW264.7 cells treated with free CpG-Cy5 and ZIF@AC–Cy5 respectively at different time points. The free CpG and CpG in ZIF@AC were labeled with Cy5 (red), and the nuclei were stained with Hoechst (blue). (c, d) Fluorescence microscopy images and corresponding fluorescence quantification showing the colocalization of free CpG or ZIF@AC with lysosomes in RAW264.7 cells after 4 h incubation. The ZIF@AC was labeled with Cy5 (red), and the lysosome was labeled with LysoTracker (green). Scale bar: 50 µm. (e, f) Flow cytometry analysis and corresponding fluorescence intensities of 4T1 cells treated with free CpG-Cy5 and ZIF@AC–Cy5 at different time points. Data are presented as mean ± SD (n = 3). ns, no significance. *P < 0.05, ***P < 0.001, ****P < 0.0001 (one-way ANOVA).

Figure 3 In vitro cGAS-STING pathway activation and immune response. (a, b) Fluorescence images and corresponding fluorescence intensities of 4T1 cells showing ROS to assess the extent of mitochondrial damage. Scale bar: 50 µm. (c, d) Fluorescence images and corresponding fluorescence intensities of γ-H2AX expression (green) in various groups, providing insights into DNA damage (blue: cell nuclei). Scale bar: 50 µm. (e) Western blot results of STING protein expression in various groups. β-Actin was set as the control. Concentrations of TNF-α (f) and IL-6 (g) in 4T1 cells after different treatments measured by ELISA. Data are presented as mean ± SD (n = 3). *P < 0.05, **P < 0.01, ***P < 0.001, ****P < 0.0001 (one-way ANOVA).

Figure 4 In vivo antitumor efficacy of nanoagonist formulations in 4T1 tumor-bearing mice. (a, c) In vivo distribution images and corresponding fluorescence intensities of CpG and ZIF@AC in the tumor regions (n = 3). (b) Ex vivo fluorescence images of the major organs and tumors (n = 3). (d) Schematic diagram of the in vivo experimental protocol: 4T1 tumor cells were inoculated on day −7, intratumoral injections of various formulations were initiated on day 0 for four administrations, and all analyses were performed on day 14. (e) Representative photographs of tumors isolated from mice in different groups at the end of the experiment (n = 6). (f) Quantitative analysis of tumor weights in each group (n = 6). (g) Dynamic changes in tumor volumes of mice during the 14-day period (n = 6). (h) Representative images of H&E and Ki67 IHC staining of tumor tissue sections from each group (n = 3). Scale bar: 150 µm. Data are presented as mean ± SD. **P < 0.01, ****P < 0.0001 (one-way ANOVA).

Figure 5 ZIF@AC elicits immune activation in vivo. (a) Flow cytometry contour plots of M1 TAMs (F4/80+CD86+) in tumor tissues. (b) Quantitative analysis of M1 TAM percentage in tumors. (c) Representative flow cytometry plots of mature DCs (CD80+CD86+) in tumor tissues. (d) Quantitative analysis of mature DC percentage in tumors. (e) Representative flow cytometry plots of CD4+ and CD8+ T cells in tumor tissues. (f) Quantitative analysis of CD4+ and CD8+ T cell percentages in tumors. ELISA analysis of (g) TNF-α levels and (h) IL-6 levels in tumor homogenates. Data are presented as mean ± SD (n = 3). *P < 0.05, **P < 0.01, ***P < 0.001, ****P < 0.0001 (one-way ANOVA).

 扫一扫看文章


扫一扫关注我们
 DownLoad:
 下载:
 下载: