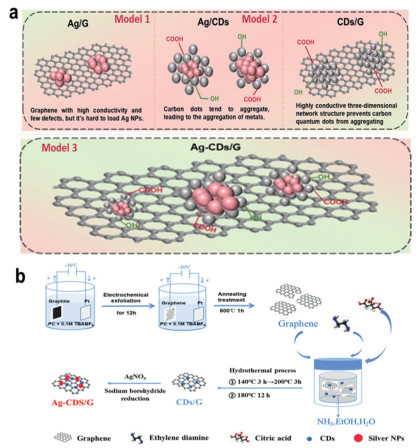
Figure 1.
(a) Schematic diagram of the model for designing Ag-CDs/G electrocatalyst. (b) Synthesis diagram of Ag-CDs/G.

Programming selective formation of epoxy bond: Carbon dots as multifunctional mediators for steering propylene electro oxidation pathways on Ag-graphene hybrids
Man Zhao , Liwu Qiang , Zonghang Liu , Wei Wen , Ze Wang , Qilin Guo , Yanxia Zhang , Aiqin Hao , Yuhong Chang , Junming Zhang , Baoliang Lv , Xiaofang Ma , He Xiao , Jianfeng Jia


The industrial synthesis of propylene oxide (PO) and propylene glycol (PG), which is the essential intermediates for polymers, pharmaceuticals, and antifreeze, currently depends on energy-intensive and environmentally damaging chlorohydrin or hydroperoxide routes [1–3]. These methods require harsh operational conditions, employ hazardous oxidants such as chlorine or organic peroxides, and generate considerable waste [4–9]. Electrocatalytic propylene oxidation, which uses water as a green oxygen source, presents a sustainable alternative. This approach is compatible with renewable electricity and can proceed under ambient conditions. However, its practical application is impeded by low Faradaic efficiency (FE) and unsatisfactory selectivity towards target oxygenates, and side reactions, resulted from the competing oxygen evolution reaction (OER) and over-oxidation of propylene to CO2.
Silver-based electrocatalysts are promising candidates for this transformation due to their unique capability to activate the C=C bond in propylene and their tunable electronic structures [5,10,4,11,12]. Recent advances underscore the critical influence of the Ag oxidation state, coordination environment, and nanoparticle size on catalytic performance. For example, Wang et al. demonstrated that ligand-tuning with phenanthroline derivatives stabilizes high-valent Ag-oxo species, which facilitates C—H activation and enhances PG selectivity [10]. In a separate study, Geng et al. highlighted the (100) crystal face of Ag3PO4 crystal face exhibits the highest yield rate of PO than those over (110) facet and (111) facet, due to its advantage for breaking the symmetric π bonding and facilitating the formation of C—O bond [13]. Despite this progress, two fundamental challenges persist: (1) Achieving precise control over Ag nanoparticle size and dispersion to optimize propylene adsorption and activation, and (2) ensuring the efficient generation and delivery of active oxygen species (e.g., *OH) for selective C—O coupling. However, these approaches often address only one aspect of the challenge, and a design principle that concurrently tackles nanoparticle dispersion, electronic tuning, and local reactant management remains elusive. We envisioned that an ideal functional modifier should act as a multi-role mediator at the metal-support interface.
The selection of CDs as the key interfacial modifier is underpinned by several distinct advantages over conventional materials. First, compared to traditional metal oxide supports (e.g., SiO2, Al2O3, TiO2) or carbon materials like pristine graphene and carbon nanotubes, CDs offer a unique combination of ultrasmall size, tunable surface chemistry, and excellent conductivity [14–16]. Their abundant oxygen-containing functional groups (carboxyl, hydroxyl, carbonyl) serve as robust anchoring sites that can immobilize metal nanoparticles with high dispersion, addressing the common challenge of metal agglomeration on inert carbon surfaces. Second, unlike conventional ligands or molecular modifiers that may block active sites or desorb under reaction conditions, CDs form stable π-π interactions with graphene supports and establish strong metal-support interactions (SMSI) with Ag nanoparticles, ensuring long-term operational stability [17,18]. Third, the electronic structure of CDs can be readily tuned by controlling their size, graphitization degree, and surface functional groups, enabling precise modulation of the Ag d-band center, a capability not easily achievable with bulk supports or simple organic modifiers. Recent advances have demonstrated that CDs can function as versatile interfacial platforms in various catalytic systems, and their ability to mediate charge transfer and stabilize active species has been leveraged in photoinduced polymerization and adaptive optical materials, underscoring their potential for programmable electrocatalyst design. Herein, we propose carbon dots (CDs) as such a multifunctional platform and demonstrate their efficacy in constructing a hierarchical Ag-CDs/G hybrid electrocatalyst. In our previous work, we produced highly conductive graphene with few defects through electrochemical cathodic exfoliation (Fig. 1a, Model 1). This material exhibits exceptional charge transport properties, while its inert surface provides limited metal-anchoring sites, resulting in poor dispersion of active phases. Carbon dots (CDs) feature abundant oxygen-containing functional groups (e.g., -COOH, -OH) that can immobilize metal nanoparticles and modulate their electronic properties via strong metal-support interactions (SMSI) [19–24]. However, CDs tend to aggregate, which diminishes their efficacy as carriers (Fig. 1a, Model 2). To solve this problem, CDs/graphene structure is designed. CDs combines with graphene supporter via π-π bonding. This structure not only mitigates the aggregation of carbon dots, but also enables the construction of a three-dimensional conductive network structure.
By integrating the advantages of these components, we designed a hierarchical “graphene-CDs-Ag” architecture (Fig. 1a, Model 3). In this architecture, CDs are π-π stacked onto conductive graphene, while Ag nanoparticles are anchored onto the CD surfaces. This design ingeniously merges high conductivity with rich surface chemistry. We hypothesize that CDs can synergistically fulfill three critical roles: (1) As anchoring sites to control Ag nanoparticle size and dispersion; (2) as electronic modulators to tailor the Ag d-band via size and strong metal-support interactions; and (3) as local reaction promoters to activate water molecules via their oxygen functional groups. Through a combination of in situ spectroscopy, electrochemical analysis, and density functional theory (DFT) calculations, we verify these distinct yet synergistic functions, revealing how CDs collectively boost the selectivity and activity for propylene epoxidation. This work transcends the demonstration of a single high-performance catalyst. This provides a generalizable multi-component design paradigm where functional nano modifiers like CDs can be leveraged to holistically optimize electrocatalytic systems for sustainable synthesis.
The Ag-CDs/G hybrid is fabricated through a multi-step procedure outlined in Fig. 1b. First, graphene is prepared via electrochemical cathodic exfoliation of graphite in propylene carbonate solvent containing 0.1 mol/L tetrabutylammonium tetrafluoroborate (TBABF4) [25,26]. The resulting exfoliated graphene is subsequently annealed at 600 ℃ for 1 h under an inert atmosphere. This thermal treatment enhances the exfoliation degree of graphene and removes residual oxygen-containing groups. CDs are then grafted onto the graphene support through a solution-phase reaction involving ammonia, ethanol, and water, yielding a CDs/G composite. In the final step, silver species are anchored onto this CDs/G framework to produce the Ag-CDs/G electrocatalyst. This rational design strategy synergistically integrates three key components: The high electrical conductivity of thermally reduced graphene, the abundant active sites provided by the CDs, and the intrinsic catalytic activity of silver. The resulting architecture offers a promising approach for developing advanced metal-CDs/G hybrid electrocatalysts.
X-ray diffraction (XRD) patterns confirm the crystalline structure and successful formation of the Ag-carbon composites. As shown in Fig. S1a (Supporting information), all catalysts exhibit characteristic diffraction peaks of graphitic carbon. The reflections at 26.4° and 54.5° correspond to the (002) and (004) planes of Graphite-2H (PDF #41–1487) [27], indicating that the carbon support maintains its structural integrity across all samples. In the magnified region from 30° to 55° (Fig. S1b in Supporting information), the Ag-containing catalysts display additional peaks attributable to metallic silver. The distinct diffraction features at 38.1° and 44.2° are indexed to the (111) and (200) planes of face-centered cubic Ag (PDF #04–0783). ICP-OES results (Table S1 in Supporting information) also confirm the Ag species have been successfully load on these samples. Concurrently, weaker carbon-related signals appear at about 42.2° and 44.3°, corresponding to the (100) and (101) planes of graphite. The sharp and unshifted Ag diffraction peaks confirm the successful deposition of Ag nanoparticles on the carbon supports without significant lattice distortion. These results verify the formation of well-defined Ag-carbon composites, a crucial prerequisite for tailoring their electrocatalytic performance.
X-ray photoelectron spectroscopy (XPS) of the Ag 3d core level reveals the oxidation state and electronic environment of silver in the catalysts. As shown in Fig. S1c (Supporting information), all samples show Ag 3d doublets at binding energies of approximately 367.9 eV (3d5/2) and 373.9 eV (3d3/2), characteristic of metallic Ag0 [28]. This indicates that silver remains predominantly in its zero-valent state prior to reaction. The O 1s XPS spectra offer additional mechanistic insight (Fig. S1d in Supporting information). Two dominant components appear at approximately 531.5 and 532.8 eV, corresponding to C=O and C—OH species, respectively. Relative to Ag/G, the intensity of the C—OH peak increases systematically with carbon dot loading. The enriched hydroxyl population could promotes water adsorption through hydrogen bonding. This facilitates water dissociation, generating active oxygen species that enhance the electrooxidation of propylene.
The successful loading of CDs is characterized by Raman spectroscopy. As shown in Fig. S1e (Supporting information), all samples exhibit two prominent characteristic peaks: The D band at approximately 1350 cm‒1 and the G band at around 1580 cm‒1, corresponding to defective carbon structures and graphitic carbon structures, respectively. Therefore, the intrinsic defects of the electrocatalysts can be reflected by the ID/IG ratio. The loading of carbon dots onto the graphene surface increases the number of defects or disordered sites, with a higher ID/IG ratio indicating a greater amount of carbon dot loading. The intensity ratio increases progressively across the catalyst series: 0.067 (G), 0.076 (6CDs/G), 0.16 (Ag/G), 0.88 (Ag-2CDs/G), 1.03 (Ag-6CDs/G), and 1.10 (Ag-10CDs/G) [29,30]. This trend indicates that the carbon defect density is positively correlated with the carbon dot loading amount, with an increasing order of Ag-2CDs/G < Ag-6CDs/G < Ag-10CDs/G. Furthermore, due to the strong interaction between carbon dots and Ag, the loading amount of Ag also increases correspondingly with the increase in carbon dot content. As shown in Fig. S1f (Supporting information), the mass fraction of silver increases from 2.03% in Ag/G to 5.59% in Ag-10CDs/G, which is consistent with the ICP-OES measurements. This correlation demonstrates that CD concentration directly governs Ag nanoparticle loading. Together, these results confirm that CDs serve as effective anchoring sites. They simultaneously tailor the defect structure of the support and enhance the dispersion and loading of Ag nanoparticles.
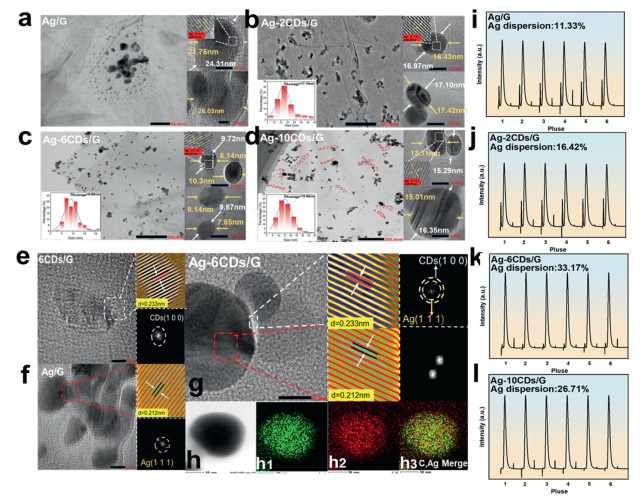
Transmission electron microscopy (TEM) is applied to analyze the morphology and size distribution of Ag nanoparticles in these catalysts. TEM images show that Ag nanoparticles are homogeneously distributed on the carbon support in all samples (Figs. 2a-d). The mean diameters for Ag/G, Ag-2CDs/G, Ag-6CDs/G and Ag-10CDs/G are 18.36, 17.10, 9.60 and 15.06 nm, respectively. And Ag-6CDs/G exhibits the smallest average Ag nanoparticle size. These results demonstrate that CDs effectively modulate Ag nanoparticle size. Increasing the CD content from twofold to sixfold reduces the Ag particle size, while a further increase to tenfold leads to a slight enlargement. This size dependence is critical for electrocatalytic performance, as nanoparticle dimensions directly influence available surface area, the exposure of active sites, and electronic properties. CO pulse chemisorption measurements quantitatively assess Ag nanoparticle dispersion across the catalyst series [31,32]. The Ag dispersion decreases in the order: Ag-6CDs/G (33.17%) > Ag-10CDs/G (26.71%) > Ag-2CDs/G (16.42%) > Ag/G (11.33%) (Figs. 2i-l). These results confirm that CDs significantly regulate Ag dispersion, with Ag-6CDs/G exhibiting the highest value (Table 1). The improved dispersion correlates well with the smaller nanoparticle sizes observed by TEM, indicating a greater proportion of exposed surface Ag atoms and thus more accessible active sites. The initial enhancement in dispersion is attributed to CDs, serving as anchoring sites that suppress Ag nanoparticle agglomeration through strong interfacial interactions. The decreased dispersion in Ag-10CDs/G suggests that excessive CD loading may partially block Ag surfaces, reducing site accessibility. This observation is consistent with studies of metal-carbon composites, where an overabundance of functional groups can limit active site availability. Obviously, CDs function as effective modulators of Ag nanoparticle dispersion and size, governing the population of catalytically active sites. High-resolution TEM (HRTEM) reveals the structural details of the synthesized composites. The 6CDs/G sample (Fig. 2e) exhibits lattice fringes with a spacing of 0.212 nm, corresponding to the (100) plane of carbon dots, confirming their successful deposition on graphene. In Ag/G (Fig. 2f), lattice fringes of 0.233 nm are assigned to the (111) plane of metallic Ag, indicating uniform nanoparticle dispersion. The Ag-6CDs/G hybrid (Fig. 2g) displays both spacings, 0.212 nm for CDs (100) and 0.233 nm for Ag (111), revealing a hierarchical structure in which Ag nanoparticles are anchored onto CDs supported by graphene. This triadic configuration promotes interfacial contact and charge transfer, consistent with reported metal-carbon heterostructures that enhance electrocatalytic performance. HAADF-STEM and corresponding EDS mapping of Ag-6CDs/G (Figs. 2h–h3) further confirm the homogeneous distribution of carbon and silver.

 DownLoad:
CSV
DownLoad:
CSV
| Catalyst | Ag particle size (nm) | Ag dispersion (%) |
| Ag/G | 18.36 | 11.33 |
| Ag-2CDs/G | 17.10 | 16.42 |
| Ag-6CDs/G | 9.60 | 33.17 |
| Ag-10CDs/G | 15.06 | 26.71 |
Based on TEM, HRTEM, and CO chemisorption results, it is concluded Ag nanoparticles aggregate significantly on pristine graphene (Ag/G), forming large particles due to the lack of anchoring sites. Similarly, at high CD loadings (Ag-10CDs/G), overcrowding of carbon dots induces agglomeration of Ag nanoparticles. In contrast, an appropriate CD loading (Ag-6CDs/G) promotes the formation of small and well-dispersed Ag nanoparticles. To understand the size-dependent catalytic behavior at the molecular level, we construct structural models for Ag/G (S1), Ag-6CDs/G (S2), and Ag-10CDs/G (S3) (Figs. 3a-c and Fig. S2 in Supporting information) and perform DFT calculations. Charge transfer between Ag clusters and the support is first evaluated. Bader charge analysis reveals electron transfers of 0.083 |e|, 0.304 |e|, and 0.259 |e| for S1, S2, and S3, respectively. This indicates that Ag clusters in S2 experience the strongest electronic activation. Propylene activation by calculating its binding energy on each model is next examined (Fig. S3 in Supporting information). The values are −0.230 eV for S1, −0.699 eV for S2, and −0.355 eV for S3, suggesting optimal propylene activation in S2. This enhanced binding is attributed to effective coupling between the π-electrons of propylene and Ag 3d orbitals. For the *OH species involved in the *Pr to *PO conversion for POR, the binding energies are 0.765 eV (S1), 0.446 eV (S2), and 0.499 eV (S3). The lower values for S2 and S3 imply a reduced energy barrier for oxygen insertion.
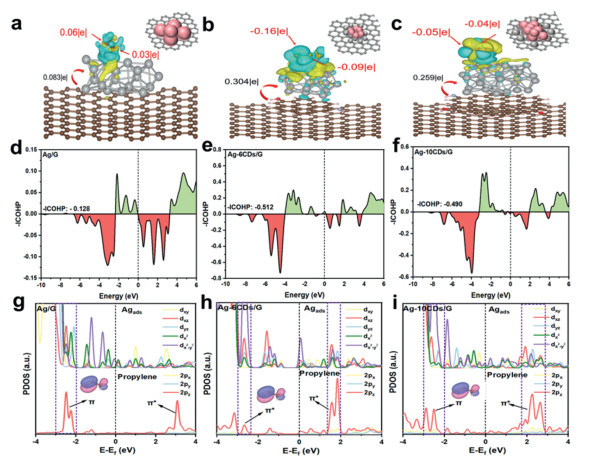
Crystal orbital Hamilton population (COHP) analysis further elucidates the Ag-C bonding interactions (Figs. 3d-f). The integrated COHP (–ICOHP) value for S2–Pr is –0.512 eV, which is more negative than those for S1-Pr (–0.128 eV) and S3–Pr (–0.490 eV). This confirms the strongest Ag-propylene adsorption in S2. Projected density of states (PDOS) analysis provides insight into the orbital interactions between Ag and propylene (Figs. 3g-i). In S2, the Ag 3d orbitals (dxy, dyz, dxz, dz2, and dx2-y2) exhibit strong overlap with both the π and π* orbitals of propylene. This facilitates stronger binding and more effective activation. In S1, orbital overlap occurs mainly with the π system. In S3, splitting of the π orbitals reduces the overlap and weakens the Ag-propylene interaction. As concluded, Ag-6CDs/G is demonstrated to show potential superior electrocatalytic activity for propylene oxidation. This is consistent with its optimal Ag nanoparticle dispersion, efficient charge transfer, and favorable orbital interaction characteristics. As concluded, DFT calculations further unravel the electronic origin of the optimized adsorption. The PDOS reveals an upward shift of the Ag d-band center in the Ag-6CDs/G model (S2) compared to Ag/G (S1), which strengthens the interaction with the π-orbitals of propylene, as evidenced by the more negative binding energy (−0.699 eV). Crucially, this shift is moderate, preventing overly strong binding of the *OH intermediate (0.446 eV for S2 vs. 0.765 eV for S1), which would hinder its subsequent coupling step. This balanced adsorption strength for both key intermediates positions Ag-6CDs/G near the Sabatier apex for the epoxidation reaction.
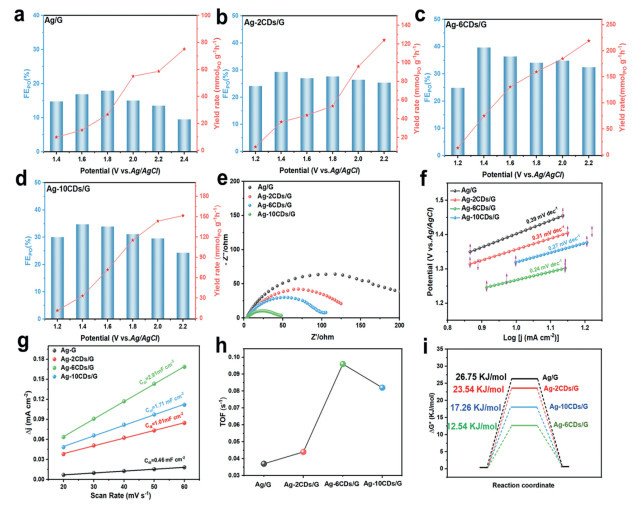
The electrocatalytic performance for PO production is assessed by Faradaic efficiency and molar yield rate inferred from 1H NMR results (Fig. S4 in Supporting information). As shown in Figs. 4a-d and Figs. S5-S7 (Supporting information). Ag-6CDs/G achieves the highest PO Faradaic efficiency of 39.71%. The PO yield rate reaches 218.85 mmolpo g‒1 h‒1, with a mass-specific yield of 249.71 gpo m‒2 h‒1. These values significantly surpass those of 6CDs/G, Ag/G, Ag-2CDs/G, and Ag-10CDs/G. Meanwhile, Ag-6CDs/G also displays competitive activity compared with reported Ag-based samples (Table S2 in Supporting information). Moreover, by product analysis (Fig. S8 in Supporting information) shows that only minimal amounts of acetone and acetic acid are generated, with the corresponding Faradaic efficiencies for Ag-6CDs/G being 2.94% and 6.05%, significantly lower than those for Ag/G (5.74%, 7.51%), Ag-2CDs/G (5.63%, 7.82%), and Ag-10CDs/G (6.57%, 7.01%). In the electrooxidation of propylene, the oxygen evolution reaction is an unavoidable competing reaction, and the remaining Faradaic efficiency is entirely attributed to oxygen generation. Additionally, within the tested potential range (Fig. S9 in Supporting information), the Ag-6CDs/G catalyst exhibits a high average selectivity for propylene oxide (approximately 74.4%), outperforming Ag/G (58.2%), Ag-2CDs/G (69.95%), and Ag-10CDs/G (74.12%). This highlights the critical role of carbon dots in suppressing overoxidation and steering the reaction toward highly selective propylene oxide formation. As expected, Ag-6CDs/G shows the highest partial current density among these Ag-based samples (Fig. S10 in Supporting information). Besides, Ag-6CDs/G shows well stability with eight-cycle test (Fig. S11 in Supporting information) and scarcely any Ag lost (Table S3 in Supporting information). Inferred from oxidation peak from 0.1 V to 0.3 V vs. Ag/AgCl in the CV test (Fig. S12 in Supporting information), it is found these Ag-based samples are inevitably oxidized. Appearance of Ag2O characteristic peak in XRD (Fig. S13 in Supporting information) and Ag+ peak in XPS spectrum (Fig. S14 in Supporting information) after POR on Ag-6CDs/G further verify this fact of oxidative reconstruction. Electrochemical impedance spectroscopy (EIS) reveals the lowest charge-transfer resistance for Ag-6CDs/G (Fig. 4e), suggesting enhanced electron transfer facilitated by the carbon dots. The Tafel slope of Ag-6CDs/G is 0.24 mV/dec (Fig. 4f) indicating favorable reaction kinetics. Double-layer capacitance (Cdl) measurements calculated from the non-faraday region CVs (Fig. S15 in Supporting information) show that Ag-6CDs/G possesses the highest Cdl value of 2.91 mF/cm2 (Fig. 4g), reflecting a large electrochemically active surface area. Furthermore, Ag-6CDs/G exhibits the highest turnover frequency (TOF, Fig. 4h) and the lowest activation energy among the series (Fig. 4i). The activation energy (Ea) for propylene electrooxidation was determined from Arrhenius plots (Fig. S16 and S17 in Supporting information) by measuring the partial current density at different temperatures (298–318 K) under a fixed overpotential. Ag-6CDs/G displays an Ea of only 12.54 kJ/mol, significantly lower than those of Ag-2CDs/G (108.27 kJ/mol), Ag-10CDs/G (21.03 kJ/mol), and Ag/G (24.61 kJ/mol). This minimal activation energy confirms that the CD-mediated interface substantially lowers the kinetic barrier for the rate-determining step, consistent with the enhanced reaction kinetics observed in Tafel analysis and the superior intrinsic activity reflected by the TOF values. The outstanding performance of Ag-6CDs/G originates from an optimal carbon dot loading that balance active site accessibility and electronic modulation. Insufficient CD content leads to inadequate Ag activation, whereas excessive CDs may block active sites or impede mass transport. This structure-activity relationship indicates the importance of an ideal functional modifier in designing efficient epoxidation electrocatalysts.
To decipher the origin of the superior activity, the electronic structures and interfacial properties of the catalysts are explored. Ultraviolet photoelectron spectroscopy (UPS) reveals that incorporating CDs significantly modulates the electronic landscape of Ag (Figs. S18a-e in Supporting information). The work function (Φ) decreases systematically from 4.52 eV for Ag/G to 4.36 eV (Ag-2CDs/G), 4.21 eV (Ag-6CDs/G), and 4.30 eV (Ag-10CDs/G). The optimal Ag-6CDs/G exhibits the lowest Φ, indicating the highest Fermi level and the most facilitated electron transfer ability [33]. TDOS results (Fig. S19 in Supporting information) further confirm the d-band center of Ag-6CDs/G closer to Fermi level in comparison with that of Ag-2CDs/G and Ag-10CDs/G. Concurrently, the valence band spectrum of Ag-6CDs/G shows the valence band maximum (Ev) closest to the Fermi level (EF) among all samples [34–37]. This upward shift of the Ag d-band center relative to EF is a direct consequence of size effect controlled by CDs, as corroborated by the Bader charge analysis in DFT.
This tailored electronic structure critically governs the adsorption behavior of key species. First, the lowered Φ and upshifted d-band center strengthen the Ag-ethylene π-back bonding. Galvanostatic measurements under alternating Ar and Pr atmospheres directly reflect this enhanced Pr adsorption (Figs. S18f-i in Supporting information). Upon switching to Pr, Ag-6CDs/G shows the most pronounced current density increase (Δ = 0.93), outperforming Ag-10CDs/G (Δ = 0.89), Ag-2CDs/G (Δ = 0.63), and Ag/G (Δ = 0.47). This trend agrees perfectly with the calculated Pr adsorption energies (DFT, Fig. 3) and confirms that the electronic modulation by CDs optimizes Pr adsorption on Ag-6CDs/G. Propylene stripping voltammetry provides further evidence (Fig. S18j in Supporting information), where the most positive stripping peak for Ag-6CDs/G (~0.569 V vs. Ag/AgCl) indicates the strongest binding of propylene-derived intermediates (Pr*), consistent with its lowest Pr desorption barrier predicted by DFT (late for Fig. 5e). Second, the adsorption of the oxygen-active species is also optimized. Zeta potential measurements (Fig. S18k in Supporting information) demonstrate that Ag-6CDs/G possesses the surface charge of −23.72 mV in 1 mol/L KOH, comparable with Ag-10CDs/G, more negative than Ag/G (−15.81 mV), 6CDs/G (−11.87 mV), and pristine graphene (−0.9 mV). This indicates the strongest affinity for hydroxide (OH-) ions [38]. Except that, by comparing 6CDs/G with pristine graphene, it is seen the abundant oxygenated groups on the CDs themselves provide more sites for OH- association probably via hydrogen bonding. This optimized OH- adsorption, coupled with the moderate *OH binding energy on Ag-6CDs/G (0.499 eV from DFT, between the too-strong binding on Ag/G and the too-weak scenario), ensures an efficient supply and appropriate reactivity of oxygen species for the subsequent epoxidation step. The in situ EIS data, presented as Bode plots and subsequently deconvoluted via distribution of relaxation times (DRT) analysis [39–41], elucidate the kinetic processes governing propylene electrooxidation on the Ag-6CDs/G composite and control samples (6CDs/G and Ag/G). Bode plots for all catalysts under a propylene atmosphere (Figs. S20a-c in Supporting information) display characteristic phaseangle peaks whose intensity and position shift systematically with increasing applied potential from 1.0 V to 1.3 V. This shift confirms the potentialdependent kinetics of the Faradaic processes. Notably, the Ag-6CDs/G composite exhibits a more pronounced and welldefined phaseangle peak in the midfrequency region (~1–100 Hz) compared to the broader, weaker features of Ag/G and the faint response of 6CDs/G. As seen in Figs. S20d-f (Supporting information), three regions including low-frequency region (LF, τ > 1 s), medium-frequency region (MF, τ ~ 0.01–1 s), and high-frequency region (HF, τ < 0.01s) are shown in the DRT curves, which are attributed to the mass-transfer/diffusion of products, charge-transfer reaction in surface catalytic reaction, and electron transfer from the electrode to the electrocatalyst interface, respectively. In the low-frequency region, these three samples all show enhanced mass-transfer with increased potential. Obvious differences are observed in medium-frequency region. 6CDs/G shows only a lowintensity, distributed relaxation, consistent with a slow, adsorptionlimited process on the lowactivity carbon surface. For Ag/G, a stronger dominant process appears, attributable to the chargetransfer step during propylene activation on metallic Ag. In stark contrast, the Ag-6CDs/G composite displays a distinct bimodal distribution (τ1 ~ 0.01–0.1 s and τ2 ~ 0.1–1 s). The emergence of two resolved relaxations in the composite suggests a decoupling of sequential reaction steps induced by the synergistic interaction between Ag nanoparticles and CDs on graphene. Here, the faster process (τ1) is assigned to the initial chargetransfer step (for example, C=C bond activation), which is accelerated by enhanced electronic interaction at the Ag-CDs interface. This interaction likely optimizes the adsorption strength of propylenederived intermediates. The slower process (τ2) corresponds to a subsequent surface chemical step, such as evolution/conversion of intermediates. This apparent process originates from optimized d-band center and work function by CDs. In situ FT-IR spectra acquired during propylene electrooxidation on the Ag-6CDs/G catalyst reveal the potential-dependent evolution of surface intermediates (Figs. 5a and b). In the spectral region between 1350 cm‒1 and 1650 cm‒1, characteristic vibrational bands emerge and intensify with increasing potential, reflecting the adsorption and transformation of key species [10,16,37]. Two bands appear at approximately 1442 and 1473 cm‒1, which correspond to the -C-H vibration and -CH3 vibration of dissolved propylene in solution. Moreover, characteristic peaks of intermediates also occur at 1541 cm‒1 (-C=C- (*Pr)), 1508 cm‒1 (-C-C- (*Pr+*OH or *PO)), and 1377 cm‒1 (*C—C (*PrOH)), respectively. As observed, with increase of voltage, dissolved propylene is consumed and converted. Appearance of 1508 and 1377 cm‒1 confirm conversion of -C=C- in *Pr into -C-C- and formation of PrOH*/PrO* intermediate, which supports an OH-involved reaction pathway. For comparison, the Ag/G catalyst is also investigated. However, the Ag/G only exhibits the two peaks appear at approximately 1442 and 1473 cm‒1 (Fig. S21 in Supporting information). This suggests poor POR activity on Ag/G, because of lower loading amount of Ag and weaker adsorption of Pr in comparison with Ag-6CDs/G.
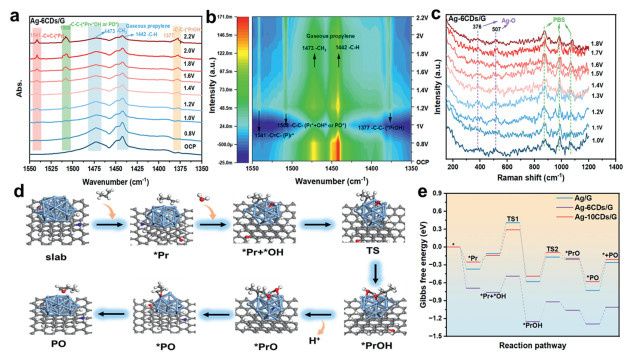
The evolution process of the Ag-6CDs/G catalyst is also investigated by the operando Raman spectra. The spectrum (Fig. 5c) is characterized by two distinct peaks: A band at approximately 376 cm‒1 is assigned to a specific, well-defined Ag-O vibrational mode, potentially indicative of a stabilized Ag+ species [15,42]; the other band at about ~507 cm‒1 likely corresponds to oxygen-related species, such as surface-adsorbed *O or *OH. This confirms important intermediate formation of Ag-O and *O/*OH on surface of Ag-6CDs/G during POR process. While the initial XPS characterization confirms that silver is predominantly in the metallic Ag0 state before reaction, the appearance of this peak under applied potential indicates a dynamic electrochemical oxidation of the Ag surface. This potential-driven formation of Ag+-O species represents an in situ reconstruction of the active sites. The stable intensity of this peak throughout the operando measurement suggests that a steady-state population of these Ag+-O motifs is maintained under reaction conditions, serving as the genuine active centers for selective C—O bond formation. The concurrent appearance of the ~507 cm‒1 feature further supports that these Ag+-O sites facilitate water activation and stabilize reactive oxygen intermediates without leading to catalyst deactivation. However, these two peaks on Ag/G are almost absent (Fig. S22 in Supporting information). This spectroscopic divergence elucidates the superior performance of the Ag-6CDs/G catalyst. The CD modifier acts as an electronic and structural regulator. It prevents the deep, non-selective oxidation of Ag nanoparticles by stabilizing a specific, active Ag+ state, as evidenced by the Ag-O peak. This modulated electronic structure facilitates the efficient generation and stabilization of reactive oxygen species (the ~507 cm‒1 features), which are crucial for the selective electrophilic/nucleophilic attack on the adsorbed propylene. Consequently, the reaction is steered toward the formation of desirable partial oxidation intermediates (enhanced C—O signals) rather than following a pathway dominated by catalyst over-oxidation and subsequent unselective C—C bond cleavage. Based on the combined in situ FT-IR and Raman evidence, the reaction pathway is proposed and illustrated in Fig. 5d. Water adsorbs and dissociates into OH on Ag sites. The OH species then reacts directly with Pr to form a bidentate PrOH intermediate. Subsequent O—H bond cleavage in PrOH* produces a CH3CHCH2O* (*PrO) species, which finally transforms into adsorbed PO (*PO) before desorption. We also compare the Gibbs free energy changes and reaction energy barriers for the *Pr → *PrO conversion across different catalysts (Fig. 5e). Notably, the *Pr → *Pr + *OH step is endothermic (ΔG > 0) for Ag-6CDs/G, whereas it is exothermic for Ag/G and Ag-10CDs/G. This endothermic character on Ag-6CDs/G prevents excessively strong adsorption of the *OH intermediate, which would otherwise hinder the subsequent C—O coupling. Conversely, a moderately endothermic *OH adsorption on Ag-6CDs/G ensures that *OH species are sufficiently activated but not over-stabilized. In the *PrOH →PrO* step, Ag-6CDs/G shows the lowest energy barrier (0.19 eV), compared to 0.27 eV for Ag/G and 0.30 eV for Ag-10CDs/G. Similarly, the *PrO desorption barrier is lowest for Ag-6CDs/G (0.28 eV) versus Ag/G (0.47 eV) and Ag-10CDs/G (0.37 eV). As seen, Ag-6CDs/G is the most effective catalyst for oxidizing *Pr to *PrO, owing to its optimized reaction energetics.
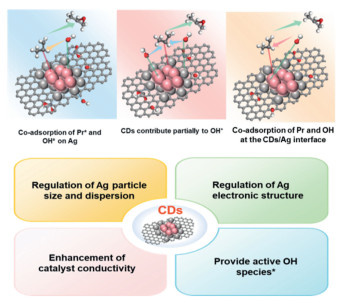
In the Ag-CDs/G catalyst system, three distinct models for propylene epoxidation active sites may be considered (Fig. 6). In the first model, propylene and dissociated hydroxyl species (OH) both adsorb on Ag sites, where epoxidation occurs between Pr and adsorbed OH. In the second model, oxygen-containing groups on the CDs could promote water dissociation via hydrogen bonding, generating OH species that migrate to neighboring Ag sites to react with adsorbed propylene. In these two models, as shown in DFT calculation, the reaction occurs on Ag, with OH originating either from Ag or CDs. Except that, in the third case, propylene adsorbs on Ag while OH is generated on adjacent CDs, with the epoxidation reaction taking place at the Ag/CD interface. This model involves dual-site activation at the interface. In our designed Ag-CDs/G composite, CDs play multiple synergistic roles. First, they act as anchoring sites for Ag nanoparticles, controlling both their size and dispersion. Second, by modulating Ag nanoparticle dimensions, the CDs tune the d-band center and work function of Ag, thereby optimizing the adsorption of reactants and intermediates. Third, surface oxygen functional groups on the CDs facilitate water dissociation through hydrogen bonding, supplying reactive OH species. Fourth, the CDs form an interconnected three-dimensional conductive network with graphene, significantly enhancing the overall electrical conductivity of the catalyst.
In summary, this work demonstrates that carbon dots (CDs) can serve as a versatile multifunctional interfacial platform to unlock the synergistic potential of Ag–graphene hybrids for the selective electrochemical epoxidation of propylene. Through a combination of experimental characterization and theoretical simulations, we have decoupled and validated the triple role of CDs: As morphological regulators to control Ag nanoparticle size and dispersion, as electronic modulators to tailor the Ag d-band center and work function for balanced adsorption of key intermediates, and as local reaction promoters to facilitate water dissociation and OH- supply via surface oxygen functional groups. This synergistic regulation results in optimized Ag dispersion, an appropriately shifted dband, and an enhanced local concentration of active oxygen species, collectively leading to a high FEPO of 39.71% and a notable yield rate of 218.85 mmolpo g‒1 h‒1. Beyond the specific reaction system studied here, our findings establish a generalizable design paradigm for advanced hybrid electrocatalysts: The deliberate integration of functional nanomodifiers (such as CDs) at the metal–support interface provides a powerful strategy to simultaneously address multiple common limitations, including poor metal dispersion, suboptimal electronic structure, and insufficient local reactant concentration, that often hinder electrocatalytic performance.
Man Zhao: Writing – review & editing, Writing – original draft, Methodology, Data curation. Liwu Qiang: Writing – review & editing, Writing – original draft, Methodology, Data curation. Zonghang Liu: Validation, Software, Methodology. Wei Wen: Validation, Software, Methodology. Ze Wang: Software, Methodology. Qilin Guo: Validation, Software, Methodology. Yanxia Zhang: Validation, Software, Methodology. Aiqin Hao: Validation, Software, Methodology. Yuhong Chang: Validation, Software, Methodology. Junming Zhang: Validation, Software, Methodology. Baoliang Lv: Validation, Software, Methodology. Xiaofang Ma: Validation, Software, Methodology. He Xiao: Writing – review & editing, Validation, Supervision, Resources, Funding acquisition, Conceptualization. Jianfeng Jia: Writing – review & editing, Project administration, Funding acquisition, Conceptualization.
The authors declare that they have no known competing financial interests or personal relationships that could have appeared to influence the work reported in this paper.
This research was supported by the National Natural Science Foundation of China (Nos. U24A2023, 21571119), the Natural Science Foundation of Shanxi Province (No. 202203021221136), "Chunhui Plan" Cooperative Scientific Research Project of Education Ministry (No. HZKY20220510), Scientific and Technological Innovation Programs of Higher Education Institution in Shanxi (No. 2019L0466), the Graduate Education Innovation Project of Shanxi Province (Nos. 2023JG093, 2024KY421, 2024XSY43), the Graduate Education Innovation Project of Shanxi Normal University (No. 2021XSY038) and 1331 Engineering of Shanxi Province. We thank the photoemission end stations (BL10B) in National Synchrotron Radiation Laboratory (NSRL) and BL14W1 in Shanghai Synchrotron Radiation Facility (SSRF) for help in characterizations.
Supplementary material associated with this article can be found, in the online version, at doi:
J. Herzberger, K. Niederer, H. Pohlit, et al., Chem. Rev. 116 (2016) 2170. doi: 10.1021/acs.chemrev.5b00441
C.P. Gordon, H. Engler, A.S. Tragl, et al., Nature 586 (2020) 708. doi: 10.1038/s41586-020-2826-3
M.I. Childers, A.K. Vitek, L.S. Morris, et al., J. Am. Chem. Soc. 139 (2017) 11048. doi: 10.1021/jacs.7b00194
Z. Li, Y. Lin, X. Miao, et al., Nat. Commun. 16 (2025) 3113. doi: 10.1038/s41467-025-58486-y
J. Ke, J. Zhao, M. Chi, et al., Nat. Commun. 13 (2022) 932. doi: 10.1038/s41467-022-28516-0
M. Chung, J.H. Maalouf, J.S. Adams, et al., Science 383 (2024) 49. doi: 10.1126/science.adh4355
T.G. Yun, B. Chen, S. Wells, et al., J. Am. Chem. Soc. 147 (2025) 12318. doi: 10.1021/jacs.5c02585
M. Zhao, Electrochemical Synthesis and Application of Low-Dimensional Carbon-Based/Phosphorene Nanomaterials and Their Composites, China Atomic Energy Press, Beijing, 2025.
M. Cheng, J. Lan, X. Sun, et al., Angew. Chem. 137 (2025) e202420780. doi: 10.1002/anie.202420780
X. Wang, S.M. Xu, A.Z. Li, et al., J. Am. Chem. Soc. 147 (2025) 23090. doi: 10.1021/jacs.5c06198
J. Ke, M. Chi, J. Zhao, et al., J. Am. Chem. Soc. 145 (2023) 9104. doi: 10.1021/jacs.3c00660
M. Chi, J. Zhao, J. Ke, et al., Nano Lett. 24 (2024) 1801. doi: 10.1021/acs.nanolett.3c04978
M. Zhao, X.Y. Guo, O. Ambacher, et al., Carbon 83 (2015) 128. doi: 10.1016/j.carbon.2014.11.033
Z. Xia, C. Ma, Y. Fan, et al., ACS Catal. 14 (2024) 1930–1938. doi: 10.1021/acscatal.3c04568
S. Zhong, B. He, S. Wei, et al., Appl. Catal. B: Environ. 362 (2025) 124743. doi: 10.1016/j.apcatb.2024.124743
Z. Li, H. Sun, Q. Liu, et al., Appl. Catal. B: Environ. 374 (2025) 125368. doi: 10.1016/j.apcatb.2025.125368
S. Zhong, S.A.H. Zaidi, B. He, et al., Chem. Eng. J. 519 (2025) 165278. doi: 10.1016/j.cej.2025.165278
J. Zhang, D. Yan, G. Ding, et al., Angew. Chem. Int. Ed. 64 (2025) e202511448. doi: 10.1002/anie.202511448
H. Xiao, S. Xue, J. Zhang, et al., Chem. Eng. J. 408 (2021) 127271. doi: 10.1016/j.cej.2020.127271
M. Zhao, L. Qiang, M. Bai, et al., Chem. Eng. J. 507 (2025) 160520. doi: 10.1016/j.cej.2025.160520
K. Gao, B. Wang, L. Tao, et al., Adv. Mater. 31 (2019) 1805121. doi: 10.1002/adma.201805121
W. Li, Y. Zhao, Y. Liu, et al., Angew. Chem. Int. Ed. 60 (2021) 3290. doi: 10.1002/anie.202013985
H. Song, M. Wu, Z. Tang, et al., Angew. Chem. Int. Ed. 60 (2021) 7234. doi: 10.1002/anie.202017102
H. Xiao, J. Zhang, M. Zhao, et al., J. Power Sources 451 (2020) 227770. doi: 10.1016/j.jpowsour.2020.227770
L. Qiang, M. Bai, Z. Liu, et al., Green Chem. 27 (2025) 12364. doi: 10.1039/d5gc03796d
L. Bai, C.S. Hsu, D.T.L. Alexander, H.M. Chen, X. Hu, J. Am. Chem. Soc. 141 (2019) 14190. doi: 10.1021/jacs.9b05268
Q. Li, Q. Wang, Y. Zeng, et al., Adv. Funct. Mater. 35 (2025) 2416975. doi: 10.1002/adfm.202416975
M. Zhou, T. Lin, F. Huang, et al., Adv. Funct. Mater. 23 (2013) 2263. doi: 10.1002/adfm.201202638
J. Chen, H. Li, C. Fan, et al., Adv. Mater. 32 (2020) 2003134. doi: 10.1002/adma.202003134
C.N. Costa, S.Y. Christou, G. Georgiou, A.M. Efstathiou, J. Catal. 219 (2003) 259. doi: 10.1016/S0021-9517(03)00151-9
T. Tanabe, Y. Nagai, T. Hirabayashi, et al., Appl. Catal. A: Gen. 370 (2009) 108. doi: 10.1016/j.apcata.2009.09.030
M. Yuan, Y. Bai, J. Zhang, et al., J. Mater. Chem. A 8 (2020) 26066. doi: 10.1039/d0ta08914a
F. Liu, R. Shi, Z. Wang, et al., Angew. Chem. Int. Ed. 58 (2019) 11791–11795. doi: 10.1002/anie.201906416
Y. Fan, X. Yang, E. Wei, et al., Appl. Catal. B: Environ. 345 (2024) 123716. doi: 10.1016/j.apcatb.2024.123716
M. Yuan, S. Dipazir, M. Wang, et al., J. Mater. Chem. A 7 (2019) 3317. doi: 10.1039/c8ta11976g
Y. Wang, X. Li, M. Zhang, et al., Adv. Mater. 32 (2020) 2000231. doi: 10.1002/adma.202000231
K. Wang, M. Wu, Y. Zhang, et al., Adv. Funct. Mater. 35 (2025) 2424435. doi: 10.1002/adfm.202424435
Y. Zhao, Z. Shi, F. Li, et al., ACS Catal. 14 (2024) 3926. doi: 10.1021/acscatal.3c05144
W. Chen, W. Zeng, Z. Chen, et al., Angew. Chem. Int. Ed. 65 (2026) e202516997. doi: 10.1002/anie.202516997
J. Wei, Q. Wang, X. Song, G. He, H. Chen, Adv. Funct. Mater. 35 (2025) e07281. doi: 10.1002/adfm.202507281
W. Xiong, X.K. Gu, Z. Zhang, et al., Nat. Commun. 12 (2021) 6429. doi: 10.1038/s41467-021-26712-y
D. Chen, P.L. Kang, Z.P. Liu, ACS Catal. 11 (2021) 8317. doi: 10.1021/acscatal.1c02029

Figure 1 (a) Schematic diagram of the model for designing Ag-CDs/G electrocatalyst. (b) Synthesis diagram of Ag-CDs/G.

Figure 2 Representative TEM images of (a) Ag/G, (b) Ag-2CDs/G, (c) Ag-6CDs/G, and (d) Ag-10CDs/G. Inset plots show histograms of the nanoparticle size distribution. Representative HRTEM images of (e) 6CDs/G, (f) Ag/G, and (g) Ag-6CDs/G. (h) The HAADF-STEM image of Ag-6CDs/G is complemented by EDS elemental mapping images, which illustrate the spatial distribution of (h1) Ag, (h2) C, and (h3) their recombination. CO-pulse profiles of (i) Ag/G, (j) Ag-2CDs/G, (k) Ag-6CDs/G, and (l) Ag-10CDs/G.

Figure 3 (a-c) The differential charge density and Bader charge analysis of these three models. (d-f) COHP curves of Ag-C bonds in these models. (g-i) DOS plots of these three models.

Figure 4 FE and yield rate of PO at different applied potentials on (a) Ag/G, (b) Ag-2CDs/G, (c) Ag-6CDs/G and (d) Ag-10CDs/G. (e) EIS curves, (f) Tafel slopes, (g) Cdl value, (h) TOF value and (i) calculated activation energy for these Ag based samples.

Figure 5 (a) In-situ FT-IR spectra of Ag-6CDs/G. (b) In-situ Raman spectra of Ag-6CDs/G collected at different voltages. (c) Contour map corresponding to the color background regions in (b). (d) Reaction path for POR. (e) Gibbs free energy diagram of POR process over calculation for Ag-6CDs/G.

Figure 6 Proposed model for propylene epoxidation active sites and multiple synergistic roles of CDs.
Table 1. Comparison of average particle size and distribution for different Ag-based catalysts.
| Catalyst | Ag particle size (nm) | Ag dispersion (%) |
| Ag/G | 18.36 | 11.33 |
| Ag-2CDs/G | 17.10 | 16.42 |
| Ag-6CDs/G | 9.60 | 33.17 |
| Ag-10CDs/G | 15.06 | 26.71 |
 下载: 导出CSV

 扫一扫看文章


扫一扫关注我们
 下载:
下载: