Beijing Key Laboratory of Theory and Technology for Advanced Batteries Materials, School of Materials Science and Engineering, Peking University, Beijing 100871, China
b.
State Key Laboratory of Materials Low-Carbon Recycling, Center of Excellence for Environmental Safety and Biological Effects, Department of Chemistry, College of Chemistry and Life Science, Beijing University of Technology, Beijing 100124, China
c.
College of Health Science and Engineering, Hubei University, Wuhan 430062, China
d.
State Key Laboratory of Applied Organic Chemistry, Key Laboratory of Nonferrous Metals Chemistry and Resources Utilization of Gansu Province, College of Chemistry and Chemical Engineering, Lanzhou University, Lanzhou 730000, China
Received Date:
30 December 2025 Accepted Date:
13 April 2026 Revised Date:
25 February 2026 Available Online:
15 December 2026
Abstract:
The blood-brain barrier (BBB) is a dynamic and selective barrier that maintains cerebral homeostasis but severely restricts drug delivery to the central nervous system, hampering the diagnosis and treatment of neurological disorders. Understanding how nanocarriers cross the BBB is thus essential for designing safe and efficient brain-targeted delivery systems. Here, we established an in vitro BBB model with enhanced barrier integrity using a three-cell-type co-culture in a Transwell system. Angiopep-2-functionalized nanoparticles (ANG NPs) were developed to investigate nanoparticle transport mechanisms. Integrated multi-omics analysis revealed that unmodified nanoparticles lack a defined transport pathway, whereas ANG-functionalized nanoparticles cross the BBB through receptor-mediated transcytosis involving lysosomal and phagosomal pathways. Both nanoparticles activated the ABC transporter pathway, leading to the efflux of nonspecific substrates back into the bloodstream. This multi-omics approach systematically elucidated distinct transport mechanisms, holding promise for informing the rational design of safer and more efficient brain-targeted nanocarriers.
The blood-brain barrier (BBB) is a highly selective, semipermeable barrier that critically maintains central nervous system (CNS) homeostasis by regulating molecular exchange between the bloodstream and the brain [1,2]. While effective delivery of drugs or nanocarriers to lesion sites is essential for diagnosing and treating CNS disorders [3,4], the BBB severely restricts the free passage of most diagnostic and therapeutic agents. This limitation greatly complicates the in situ acquisition of biochemical information within the brain and hinders the development of effective neurological therapies [5,6].
Advancing brain-targeted drug delivery requires a deeper understanding of how nanoparticles cross the BBB. At the macroscopic level, nanoparticles are known to traverse the BBB via several routes, including passive transmembrane diffusion, the paracellular pathway, carrier-mediated transport, and receptor- or adsorptive-mediated transcytosis [7–10]. However, nanoparticle trafficking within endothelial cells is highly complex and influenced by multiple physiological and environmental factors. Although current studies have largely focused on characterizing these transcytosis pathways at a macroscopic level, mechanistic insights, particularly those involving molecular-level changes, remain limited and fragmented. Elucidating the detailed mechanisms of BBB crossing is essential not only for understanding brain drug delivery but also for guiding the design of more efficient and safer brain-targeted nanocarriers [11]. This represents a critical and urgent challenge in neurological disease research.
Advances in mass spectrometry have led to its broad adoption in proteomics and metabolomics research. Proteomics aims to characterize protein composition and dynamics changes across cellular, tissue, and organismal systems [12,13], while metabolomics enables the comprehensive profiling of endogenous small molecules, revealing metabolic changes, identifying biomarkers, and reflecting functional states under specific conditions or time points [14,15]. By integrating mass spectrometry-based proteomics and metabolomics, researchers can systemically profile molecular events involved in nanoparticle transport across the BBB, offering a multidimensional perspective on the associated biochemical alterations.
The Transwell system offers a simplified yet physiologically relevant platform for establishing diverse co-culture models, making it particularly suitable for investigating nanoparticle transport mechanisms of the BBB [16,17]. In this study, we constructed an in vitro BBB model using Transwell systems, developed angiopep-2-functionalized nanoparticles (ANG NPs), and applied integrated mass spectrometry-based proteomics and metabolomics analyses to elucidate the molecular mechanisms of BBB transport. We first evaluated three BBB models and identified the three-cell-type co-culture system as exhibiting the highest physiological relevance. This optimized model was used to evaluate the transport of surface-functionalized nanoparticles and systematically characterize the associated molecular dynamics. The integrated multi-omics analysis revealed that ANG NPs cross the BBB primarily through receptor-mediated transcytosis involving lysosomal and phagosomal pathways. These findings provide novel insights into nanocarrier–BBB interactions and support future efforts toward designing nanoparticles with improved BBB penetration and favorable safety characteristics.
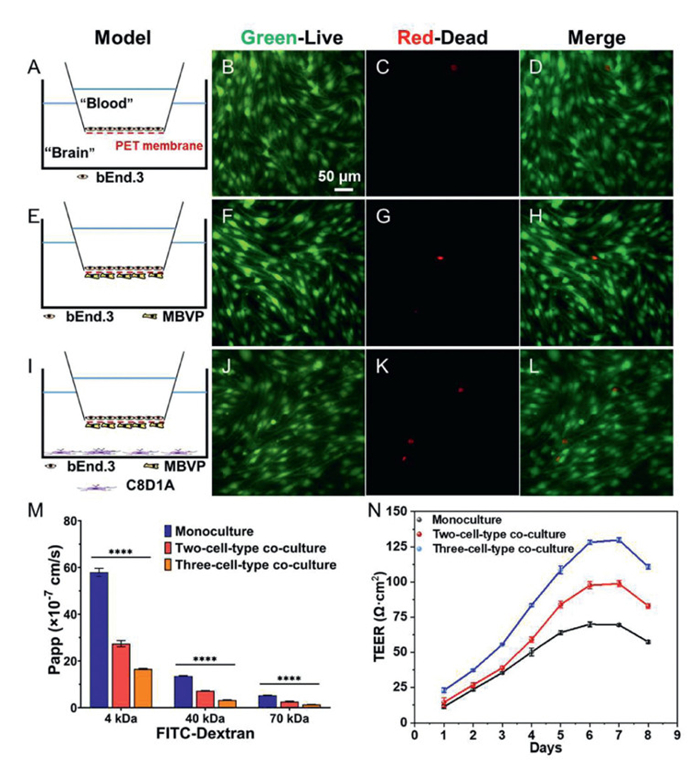
Three distinct in vitro BBB models with physiological relevance were established using the Transwell system. The corresponding cell seeding strategies are schematically illustrated in Figs. 1A, E, and I. Cell viability within these models was evaluated using live/dead staining, which revealed robust survival of brain microvascular endothelial cells (bEnd.3) across all configurations (Figs. 1B–D, F–H, J–L). All three models exhibited well-defined cellular morphology with only sporadic red fluorescence, indicating minimal cell death. No statistically significant differences in viability were observed among the models, supporting their consistent and reliable use for subsequent studies.
Figure 1
Figure 1.
Characterization of in vitro BBB models. (A, E, I) Schematic diagrams of the monoculture, two-cell-type, and three-cell-type co-culture models, respectively. Live/dead staining of the corresponding models: (B, F, J) Calcein-AM (live cells), (C, G, K) EthD-1 (dead cells), and (D, H, L) merged images. (M) Permeability measurements (n = 3). (N) TEER measurements (n = 6). All microscopic images have the same scale bar. Data are presented as mean ± standard deviation (SD). ****P < 0.0001.
The barrier integrity of the three in vitro BBB models was evaluated by measuring permeability to fluorescein isothiocyanate–dextran (FITC–dextran) tracers of varying molecular weights (4, 40, and 70 kDa) and by monitoring transepithelial electrical resistance (TEER). In all models, the permeability decreased with increasing tracer size, with the 70 kDa tracer exhibiting approximately 90% lower permeability than the 4 kDa tracer. The three-cell-type co-culture model showed the lowest overall permeability, with apparent permeability coefficients of 16.56 × 10⁻⁷, 3.30 × 10⁻⁷, and 1.38 × 10⁻⁷ cm/s for the 4, 40, and 70 kDa tracers, respectively (Fig. 1M), indicating superior barrier tightness. TEER values increased over time, peaking on day 6, stabilizing through day 7, and subsequently declining (Fig. 1N), confirming the formation of functional barriers in all models. Notably, the three-cell-type model exhibited significantly higher TEER and lower permeability than the single- and two-cell-type models, reflecting enhanced barrier integrity and greater physiological relevance.
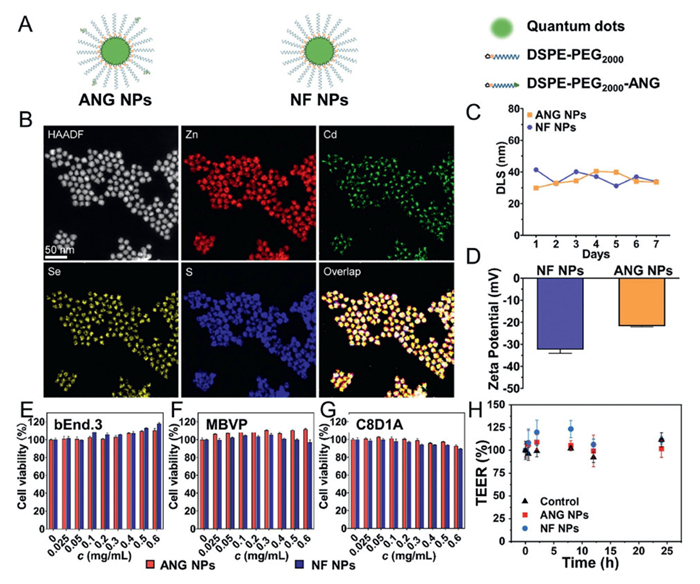
Angiopep-2 (ANG), a 19-amino acid peptide derived from the Kunitz protease inhibitor domain, exhibits high binding affinity for the low-density lipoprotein receptor-related protein-1 (LRP-1) and demonstrates efficient BBB penetration capability [18–21]. Surface modification of nanoparticles with ANG enhances their interaction with brain endothelial cells and improves their ability to cross the BBB. Although ANG is known to cross the BBB primarily via receptor-mediated transcytosis, the detailed molecular mechanisms remain incompletely understood [22–24]. Quantum dots are widely used in biomedical imaging due to their excellent optical properties, such as high quantum yield, narrow emission bands, broad excitation range, and strong photostability [25,26]. In this study, two types of quantum dots-based nanoparticles, ANG NPs and non-functionalized nanoparticles (NF NPs), were constructed to investigate their BBB transport mechanisms (Fig. 2A). High-angle annular dark-field scanning transmission electron microscopy (HAADF-STEM) in conjunction with elemental mapping confirmed that the quantum dots possess a core–shell structure composed of Zn, Cd, Se, and S (Fig. 2B). The quantum dots surface was functionalized with oleic acid ligands and further encapsulated via hydrophobic interactions with the amphiphilic polymers DSPE-PEG2000 and DSPE-PEG2000-ANG, which improve biocompatibility and colloidal stability [27,28]. To optimize BBB penetration, ANG NPs were prepared with a 4:1 molar ratio of DSPE-PEG2000 to DSPE-PEG2000-ANG, corresponding to a 20% ANG surface density previously shown to enable efficient transcytosis [29].
Figure 2
Figure 2.
Characterization of synthesized nanoparticles. (A) Schematic structures of ANG NPs and NF NPs. (B) HAADF-STEM images and elemental mappings of quantum dots. All images have the same scale bar. (C) Zeta potential. (D) Hydrodynamic size (n = 3). (E–G) Cell viability of bEnd.3, MBVP, and C8D1A cells after 24 h incubation with nanoparticles at various concentrations (n = 3). (H) Effect of ANG NPs and NF NPs on the TEER of the BBB model (n = 4). Data are presented as mean ± SD.
Transmission electron microscopy (TEM) showed that the quantum dots, ANG NPs, and NF NPs were well dispersed with uniform morphology. Their average diameters measured 12.83 ± 1.53, 12.29 ± 1.50, and 13.09 ± 1.85 nm, respectively, indicating no significant change in size after surface modification. High-resolution TEM images revealed clear lattice fringes in the bare quantum dots, which became less distinct following coating with DSPE-PEG2000 or DSPE-PEG2000-ANG, confirming successful surface functionalization (Fig. S1 in Supporting information). Dynamic light scattering (DLS) indicated hydrodynamic diameters of 30–40 nm for both nanoparticles, which remained stable over 7 days, reflecting good thermodynamic stability (Fig. 2C). Since nanoparticles larger than 200 nm poorly cross the BBB [30,31] and those smaller than 5 nm undergo rapid renal clearance [32], most BBB-penetrating nanoparticles are designed within the 10–100 nm range [33]. The nanoparticles developed here have the potential to cross the BBB. Both ANG NPs and NF NPs carried negative zeta potentials in aqueous solution. Owing to the positive charge of the ANG peptide [34], the zeta potential of ANG NPs shifted toward neutrality compared with NF NPs, demonstrating effective peptide functionalization (Fig. 2D). The Fourier transform infrared (FTIR) spectrum further confirmed the surface chemistry. The characteristic P=O stretching vibration of DSPE-PEG2000 was observed at 1120 cm–1. In contrast, DSPE-PEG2000 -ANG exhibited an additional peak at 1654 cm–1, corresponding to the N–H bending vibration of the ANG peptide amide group. Both nanoparticle types showed the DSPE-PEG2000 signature, while ANG NPs also displayed the distinctive DSPE-PEG2000–ANG peak, verifying successful polymer functionalization (Fig. S2 in Supporting information).
The biosafety of the synthesized nanoparticles was evaluated using the CCK-8 assay. Three constituent cell types of the BBB model, bEnd.3, pericytes (MBVP), and astrocytes (C8D1A), were incubated with ANG NPs or NF NPs at concentrations ranging from 0 to 0.6 mg/mL for 24 h. Cell viability remained above 80% across all concentrations, indicating minimal cytotoxicity of both nanoparticle types (Figs. 2E–G). Furthermore, when added to the apical chamber of a Transwell-based BBB model at 0.5 mg/mL, neither nanoparticle induced significant changes in TEER over 24 h, suggesting no adverse effect on barrier integrity (Fig. 2H).
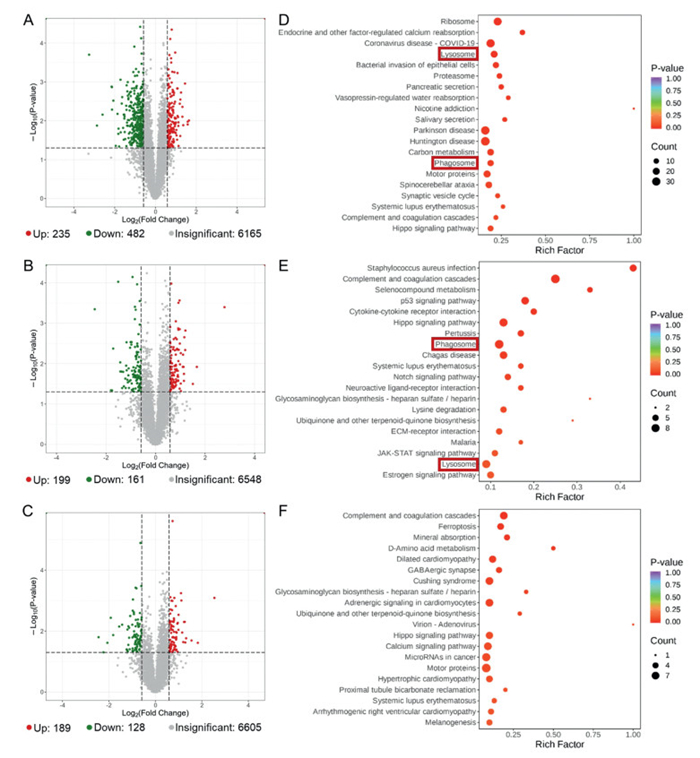
To simulate nanoparticle transport across the BBB, ANG NPs and NF NPs were separately introduced into the apical chamber of the BBB model. bEnd.3 cells were collected at 0.5, 2, and 8 h post-treatment for proteomic analysis. Functional annotation of identified proteins was performed using the Kyoto encyclopedia of genes and genomes (KEGG) database, yielding a total of 6456 annotated proteins. Proteins with a fold change > 1.5 or < 0.6667 and a P < 0.05 relative to the untreated control group were considered differentially expressed. Compared to the control group, the ANG NPs group induced significant changes in 717, 360, and 317 proteins at 0.5, 2, and 8 h, respectively (Figs. 3A-C), while the NF NPs group altered 757, 1177, and 557 proteins at the corresponding time points (Fig. S3 in Supporting information).
Figure 3
Figure 3.
Proteomic analysis of ANG NPs group versus the control group across time points. (A–C) Volcano plots of differentially expressed proteins. (D–F) Bubble plots of KEGG enrichment analysis of differentially expressed proteins. (A, D) 0.5 h, (B, E) 2 h, (C, F) 8 h.
Integrated bioinformatic analysis of differentially expressed proteins identified 79 in the ANG NPs group and 107 in the NF NPs group that were consistently altered throughout the experimental period compared to the control group (Fig. S4 in Supporting information). Notably, LAMP2 and AP3M1 in the ANG NPs group, localized to the plasma membrane and cytoplasm, respectively, are associated with lysosomal signaling and exhibited sustained expression changes throughout delivery. AP3M1 was additionally found to be persistently altered in the NF NPs group. Temporal profiling of lysosome-related differentially expressed proteins identified 19, 8, and 7 at 0.5, 2, and 8 h, respectively, in the ANG NPs group, accumulating to 27 proteins in total, while the NF NPs group showed 17, 19, and 5 alterations at the corresponding time points, for a total of 29 proteins. These results demonstrate that both nanoparticles significantly modulate the lysosomal pathway, indicating a time-dependent cellular response to nanoparticle exposure.
KEGG enrichment analysis of the differentially expressed proteins identified the top 20 most significantly altered pathways. Compared to the control, the ANG NPs group showed alterations in both lysosome and phagosome pathways at 0.5 and 2 h (Figs. 3D and E). Lysosomes participate in intracellular transport and degradation via endocytosis and autophagy [35], while phagosomes are plasma membrane-derived vesicles responsible for internalizing and degrading foreign particles and apoptotic debris [36]. Both pathways are closely linked to receptor–mediated transcytosis, directly affecting the trafficking and processing of receptor–ligand complexes and thus influencing cellular uptake efficiency. By 8 h post–treatment with ANG NPs, neither pathway differed significantly from the control, suggesting the completion of receptor–mediated transport (Fig. 3F). In contrast, the NF NPs group displayed lysosomal pathway changes only at 0.5 h and phagosomal alterations at 8 h (Fig. S5 in Supporting information). Unlike the temporally coordinated response in the ANG NPs group, the NF NPs group exhibited delayed and less synchronized pathway modulation, indicating distinct intracellular trafficking mechanisms potentially attributable to differences in surface functionalization. Further studies are needed to elucidate the precise molecular basis of these differences.
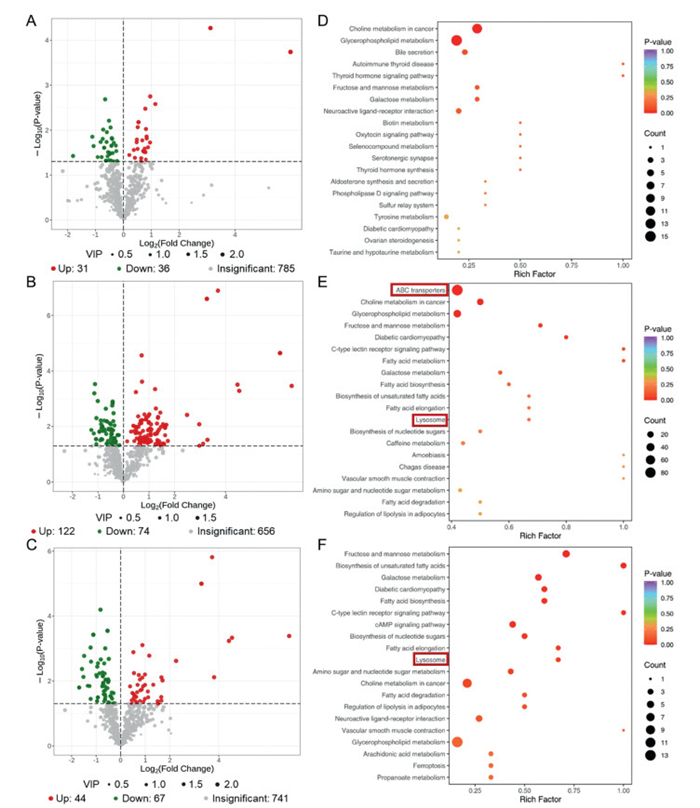
A nanoparticle transport model was established as described, and cells were collected at 0.5, 2, and 8 h for metabolite profiling by mass spectrometry. Among the 852 metabolites identified (Table S1 in Supporting information), those with a variable importance in projection (VIP) > 1 and P < 0.05 versus control were considered differentially expressed. The ANG NPs group showed 67, 196, and 111 altered metabolites at 0.5, 2, and 8 h, respectively (Figs. 4A-C), while the NF NPs group exhibited 65, 192, and 214 changes at the same time points (Fig. S6 in Supporting information). In the ANG NPs group, 24 differentially expressed metabolites were persistently altered (Fig. S7A in Supporting information), including mannose and inositol—both linked to the lysosomal pathway—which changed at 2 and 8 h, suggesting a sustained influence of ANG NPs on lysosomal function and related metabolism. Similarly, the NF NPs group showed persistent changes in 43 metabolites (Fig. S7B in Supporting information), with mannose and inositol also altered at 2 and 8 h, pointing to partially overlapping mechanisms of lysosomal metabolic modulation. Furthermore, adenosine diphosphate (ADP), a lysosome-related metabolite involved in cellular energy metabolism [37], was significantly altered at 2 h in the NF NPs group, implying an effect on energy–lysosome crosstalk. In summary, both nanoparticles markedly reshape cellular metabolism, especially lysosome-associated metabolites. While they share certain modes of action, distinct metabolic changes also occur, likely reflecting the presence or absence of surface ANG peptide modification.
Figure 4
Figure 4.
Metabolomic analysis of ANG NPs group versus the control group across time points. (A–C) Volcano plots of differentially expressed metabolites. (D–F) Bubble plots of KEGG enrichment analysis of differentially expressed metabolites. (A, D) 0.5 h, (B, E) 2 h, (C, F) 8 h.
KEGG enrichment analysis of the detected differential metabolites identified the 20 most significantly enriched pathways. The lysosome pathway was significantly altered in the ANG NPs group at 2 and 8 h, and the ABC transporters pathway was changed at 2 h (Figs. 4D-F). In contrast, both pathways showed alterations in the NF NPs group at 2 and 8 h (Fig. S8 in Supporting information). ABC transporters play a crucial role in BBB physiology by utilizing ATP to drive substrate efflux. These proteins are predominantly localized on the luminal membrane of brain microvascular endothelial cells, where they transport diverse substrates from the endothelium back into the circulation [38]. This mechanism maintains homeostasis of the cerebral microenvironment by preventing the entry of harmful substances, yet it poses a major obstacle to nanoparticle delivery. Both nanoparticles encountered efflux mediated by the ABC transporter pathway, but the non-targeted NF NPs experienced prolonged inhibition. Lacking active targeting capability, NF NPs are more readily recognized and effluxed by ABC transporters, limiting their brain accumulation. In contrast, the ANG NPs enable partial evasion of ABC transporter-mediated clearance through specific receptor interactions, thereby reducing efflux and enhancing barrier penetration. Consequently, the untargeted nanoparticles undergo sustained efflux-mediated obstruction during BBB crossing.
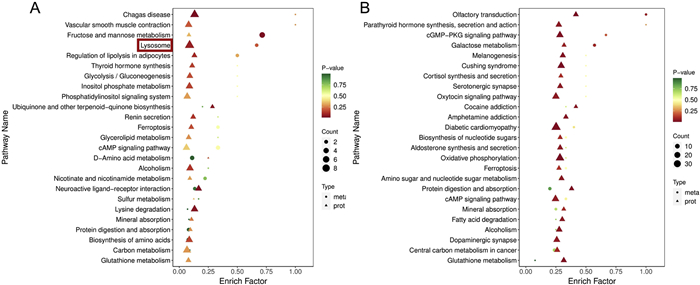
Proteomic analysis revealed significant alterations in the lysosome and phagosome pathways at 0.5 and 2 h following ANG NPs exposure, both of which are closely linked to receptor–mediated transcytosis—a key cellular mechanism for the internalization and processing of extracellular substances. These findings suggest that ANG NPs likely enter cells via this route. Metabolomic analysis further detected changes in phagosome pathway–associated metabolites at 2 and 8 h, showing a delayed response relative to protein–level alterations. This temporal pattern implies that lysosome–related proteins, acting upstream in signaling and metabolic networks, are perturbed first, subsequently triggering downstream biochemical cascades that lead to metabolic reprogramming. Integrated proteomic and metabolomic profiling confirmed significant lysosomal pathway changes at 2 h, underscoring its central role in the cellular response to ANG NPs (Fig. 5A). A similar delay between protein and metabolite changes was observed for NF NPs: Lysosomal proteins were altered at 0.5 h, while corresponding metabolic shifts emerged at 2 and 8 h. However, integrated analysis showed no significant changes in transport–related pathways (Fig. 5B), indicating that NF NPs may employ a different intracellular trafficking mechanism or exert weaker effects on these pathways. Mapping differentially expressed metabolites and proteins onto KEGG pathways illustrated the remodeling of the lysosomal network at 2 h (Fig. S9 in Supporting information), visually summarizing the key molecular players involved in this process.
Figure 5
Figure 5.
Bubble plot of KEGG enrichment from multi-omics data at 2 h. (A) ANG NPs group versus the control group. (B) NF NPs group versus the control group.
The above results demonstrate that ANG NPs cross the BBB primarily through receptor–mediated transcytosis associated with lysosomal and phagosomal pathways, a highly specific and efficient cellular uptake mechanism. In the BBB microenvironment, ANG NPs are recognized by the LRP–1 receptor on brain microvascular endothelial cells and internalized via receptor–mediated endocytosis. The nanoparticles are subsequently encapsulated in phagosomes, which fuse with lysosomes, enabling intracellular processing and eventual transcytosis into brain tissue. Although ABC transporters also recognize ANG NPs and efflux a fraction back into the bloodstream, limiting overall brain delivery efficiency, receptor–mediated transcytosis remains the dominant route, allowing effective BBB penetration. In the case of NF NPs, changes in lysosome– and phagosome–related metabolites and proteins were also detected, but without a clear temporal profile. Integrated proteomic and metabolomic analysis failed to delineate a coherent translocation mechanism, likely due to the absence of a specific ligand on NF NPs that could engage endothelial receptors. This deficiency likely disrupts regulated intracellular trafficking, resulting in a more stochastic and less efficient transport process. Moreover, ABC transporters exerted a stronger and more prolonged efflux effect on NF NPs, given their higher susceptibility to recognition by these efflux pumps. This persistent exclusion significantly impeded NF NPs' ability to cross the BBB, resulting in lower delivery efficiency than ANG NPs over the same period, consistent with their distinct transport mechanism (Fig. S10 in Supporting information). Clathrin-mediated endocytosis serves as a crucial pathway for receptor-mediated endocytosis. To further validate the transport mechanism of ANG NPs across the BBB, chlorpromazine, a specific inhibitor targeting clathrin-mediated endocytosis, was introduced during the transport process. In comparison with the control group lacking the inhibitor, the efficiency of ANG NPs across the BBB decreased significantly after the addition of chlorpromazine (Fig. S11 in Supporting information), which confirms that its transport mechanism is associated with receptor-mediated endocytic transport.
This study developed a series of in vitro BBB models using Transwell systems, including single-, two-, and three-cell-type co-culture configurations. Functional characterization confirmed that all models exhibited adequate barrier integrity, with the three-cell-type model demonstrating superior structural and functional properties. Two quantum dot-based nanoparticles, ANG NPs and NF NPs, were constructed for investigating BBB crossing mechanisms. Integrated proteomics and metabolomics analyses revealed that ANG NPs cross the BBB via receptor-mediated transcytosis involving lysosomal and phagosomal pathways, whereas NF NPs lack a defined translocation route. Both nanoparticles activated the ABC transporter pathway, promoting efflux of nonspecific substrates from endothelial cells back into circulation. The mass spectrometry-based multi-omics approach provided systematic insights into nanoparticle transport, revealing distinct transport mechanisms for the two nanoparticles and clarifying how these mechanisms govern delivery efficiency. These findings provide a conceptual basis for designing nanoparticles with optimized BBB penetration and biosafety, potentially supporting the advancement of effective brain disease treatments.
The authors declare that they have no known competing financial interests or personal relationships that could have appeared to influence the work reported in this paper.
Acknowledgments
This work was financially supported by the National Natural Science Foundation of China (Nos. 22327805, 22476223) and the Beijing Outstanding Young Scientist Program (No. BJJWZYJH01201910005017).
Supplementary materials
Supplementary material associated with this article can be found, in the online version, at doi:10.1016/j.cclet.2026.112770.
S. Shen, W. Zhang, Rev. Neurosci. 21 (2010) 29–53.
Figure 1
Characterization of in vitro BBB models. (A, E, I) Schematic diagrams of the monoculture, two-cell-type, and three-cell-type co-culture models, respectively. Live/dead staining of the corresponding models: (B, F, J) Calcein-AM (live cells), (C, G, K) EthD-1 (dead cells), and (D, H, L) merged images. (M) Permeability measurements (n = 3). (N) TEER measurements (n = 6). All microscopic images have the same scale bar. Data are presented as mean ± standard deviation (SD). ****P < 0.0001.
Figure 2
Characterization of synthesized nanoparticles. (A) Schematic structures of ANG NPs and NF NPs. (B) HAADF-STEM images and elemental mappings of quantum dots. All images have the same scale bar. (C) Zeta potential. (D) Hydrodynamic size (n = 3). (E–G) Cell viability of bEnd.3, MBVP, and C8D1A cells after 24 h incubation with nanoparticles at various concentrations (n = 3). (H) Effect of ANG NPs and NF NPs on the TEER of the BBB model (n = 4). Data are presented as mean ± SD.
Figure 3
Proteomic analysis of ANG NPs group versus the control group across time points. (A–C) Volcano plots of differentially expressed proteins. (D–F) Bubble plots of KEGG enrichment analysis of differentially expressed proteins. (A, D) 0.5 h, (B, E) 2 h, (C, F) 8 h.
Figure 4
Metabolomic analysis of ANG NPs group versus the control group across time points. (A–C) Volcano plots of differentially expressed metabolites. (D–F) Bubble plots of KEGG enrichment analysis of differentially expressed metabolites. (A, D) 0.5 h, (B, E) 2 h, (C, F) 8 h.
Figure 5
Bubble plot of KEGG enrichment from multi-omics data at 2 h. (A) ANG NPs group versus the control group. (B) NF NPs group versus the control group.


 DownLoad:

 下载:


 下载:

