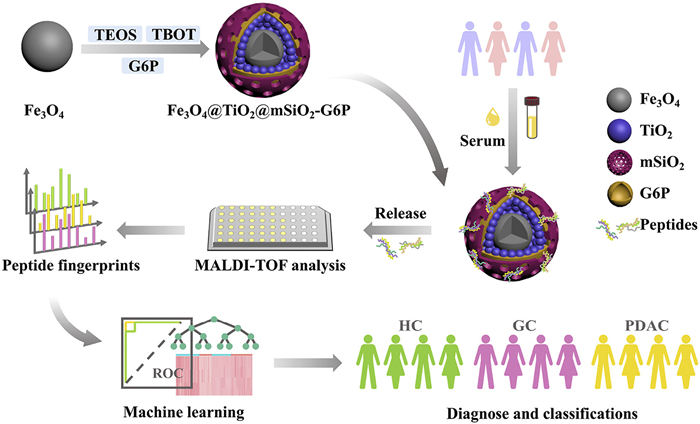
Figure 1.
Construction of hydrophilic molecular trap and its application in smart peptidomic diagnostics.

Smart peptidomic diagnostics: Hydrophilic molecular traps with machine learning-driven pattern recognition
Yanchao Zhang , Man Zhang , Wantong Zhang , Shuangshuang Ji , Xufang Hu , Nianrong Sun , Chunhui Deng


According to the most recent statistics, gastric cancer (GC) and pancreatic cancer ranked as the fifth and sixth leading causes of cancer-related deaths globally across 185 countries, posing significant threats to human health and safety [1]. Data from a high-income country (2014–2020) showed GC patients had a 36% five-year survival rate, contrasting with 13% for pancreatic cancer [2]. This is because the initial clinical manifestations of GC and pancreatic cancer are often nonspecific, closely resembling symptoms of common benign conditions such as dyspepsia and gastritis. When patients are diagnosed upon symptom manifestation, the disease has typically already progressed to advanced stages or reached an incurable state, leading to delayed diagnosis of cancer [3,4]. Approximately 85% of pancreatic cancer cases are pancreatic ductal adenocarcinoma (PDAC) [5]. Currently, methods used for early diagnosis and high-level screening of GC and PDAC include computed tomography (CT), positron emission computed tomography (PET), endoscopy and magnetic resonance cholangiopancreatography (MRCP) [3,6]. However, PET/CT has limited accuracy for mucinous/diffuse-type carcinomas due to false positives and reduced sensitivity, precluding standalone use [7]. Endoscopy requires anaesthesia techniques, which is invasive and costly for the patient. What is more, the sensitivity of MRCP is significantly influenced by tumor size [8]. Virtually 100% of pancreatic cancer patients develop metastatic disease, with mortality ultimately resulting from the metabolic sequelae of uncontrolled tumor proliferation [9]. Consequently, the development of minimally invasive yet highly sensitive detection methods for timely early diagnosis of GC and PDAC is critical for improving therapeutic outcomes and carries significant clinical implications.
Endogenous peptides, as integral components of differentially expressed proteins among patients, hold significant potential for personalized medicine applications. Numerous endogenous peptides such as neuropeptide transmitters, peptide hormones, and growth factors play vital roles in biological processes. Blood, circulating through all physiological systems, serves as a vital diagnostic window reflecting the patient's comprehensive health status [10]. Low-molecular-weight peptides can readily traverse vascular endothelial barriers into circulation, potentially carrying molecular signatures of disease that serve as valuable biomarkers for early diagnosis [11,12]. Several studies have demonstrated the feasibility of utilizing plasma-derived peptides as cancer biomarkers, with these findings significantly advancing the field of cancer biomarker discovery [13–15]. Xu et al. identified 8 peptides features for differentiating Crohn's disease from healthy controls (HC) [16]. Zhang et al. found that 3 peptides features could be used for the diagnosis of Alzheimer's disease [17]. Surprisingly, all these peptides are hydrophilic. Therefore, we speculate that hydrophilic peptides play an important role in the human body and may have great potential in disease diagnosis.
Mass spectrometry (MS) is an excellent tool for the development of minimally invasive yet highly sensitive detection methods. Studies have demonstrated that matrix-assisted laser desorption/ionization time-of-flight mass spectrometry (MALDI-TOF MS) can effectively detect and characterize endogenous peptides from tissue extracts, making it an indispensable tool in peptidomics research for clinical sample analysis [18,19]. Wang et al. prepared a functionalized magnetic probe and combined it with MALDI-TOF MS to enrich N-linked glycopeptides in the serum of patients with hepatocellular carcinoma and HC, thereby deepening the understanding of the mechanism of liver cancer [20]. Additionally, MALDI-TOF MS has been applied to breast cancer diagnosis and lung nodule classification through the analysis of lipid molecules and metabolites [21,22]. Compared with the time-consuming and complex LC-MS/MS-based diagnostic strategies reported recently [23], the MALDI-TOF MS-based detection scheme established in this study requires no complicated sample preparation. It significantly reduces the preprocessing time and cuts the serum sample consumption from several hundred microliters to only 2 µL, all while maintaining high sensitivity and markedly enhancing its clinical utility. However, numerous biomarkers relevant for early cancer detection exist at ultralow abundances that fall below the detection limits of current mass spectrometry platforms [11]. Therefore, pre-analytical enrichment and concentration of peptides are critical and indispensable steps in the workflow. Currently, various magnetic nanoparticles have been engineered for peptidomics sample preparation, offering enhanced efficiency in peptide enrichment and analysis [24]. Under an external magnetic field, magnetic nanoparticles exhibit rapid and controllable dispersion within sample solutions. Their high specific surface area significantly reduces equilibrium time between the magnetic nanoparticles and analytes, thereby streamlining operational procedures while enhancing extraction efficiency. As an exceptional porous material, mesoporous materials have been widely adopted in proteomics sample preparation due to their outstanding size-exclusion capability, large specific surface area, tunable pore dimensions, and excellent chemical and thermal stability [25,26]. Mesoporous materials enable selective enrichment of peptides through size-based filtration, where smaller peptide molecules enter the pores while other substances are excluded. This size-exclusion mechanism effectively concentrates peptides for subsequent MS analysis [25,27]. Xu et al. combined mesoporous materials with MALDI-TOF MS and used machine learning algorithms to conduct data analysis, thereby identifying 3 characteristic hydrophilic peptides. This provided a real-time, low-cost platform for disease detection and facilitated the design of peptide enzyme analysis tools [24].
In this work, we developed a hydrophilic molecular trap consisting of a magnetic core and hydrophilic mesoporous channels, which enables rapid dispersion and separation while exhibiting excellent size-exclusion capacity. Thereinto, the hydrophilic modification of the mesoporous channels is attributed to the affinity between the phosphorylated group of D-glucose-6-phosphate (G6P) and metal oxides [28,29]. Integrating with MALDI-TOF MS, we obtained high-quality serum peptide fingerprints from 65 GC, 38 PDAC, and 72 HC. All the samples were provided by Zhongshan Hospital of Fudan University, and this research was approved by the Ethics Committee of Zhongshan Hospital of Fudan University (No. B2021-837R). Machine learning was applied to conduct smart diagnosis on these peptide fingerprints for GC and PDAC, achieving exceptional performance, with area under the receiver operating characteristic curve (AUC) values of 1 (HC vs. PDAC), 0.968 (HC vs. GC), and 1 (GC vs. PDAC) in test sets, respectively. Futhermore, we applied the random forest algorithm to identify 4 (HC vs. PDAC), 5 (HC vs. GC) and 3 (GC vs. PDAC) peptide features, by which highly accurate classification could be achieved in pairwise combination samples. These results demonstrate that smart peptidomic diagnostics using hydrophilic molecular traps with machine learning-driven pattern recognition have strong clinical potential, enabling disease diagnosis and prognostic monitoring.
Based on the design shown in Fig. 1, we developed a G6P-functionalized molecular trap (Fe3O4@TiO2@mSiO2-G6P) for capturing serum hydrophilic peptidomes, which was constructed through mesoporous layer deposition on magnetic TiO2 surfaces followed by intramesopore modification. The detailed synthesis steps are provided in Supporting information.
The field emission transmission electron microscopy (FE-TEM) image in Fig. 2a clearly demonstrates a well-defined core-shell architecture of the Fe3O4@TiO2@mSiO2-G6P. The dark-colored inner core consists of a titania-coated magnetic sphere, which provides strong magnetic responsiveness to facilitate rapid solid-liquid separation through magnetic manipulation [30]. The outer gray layer represents the mesoporous silica shell enveloping the magnetic core. The mesoporous channels in this shell permit the entry of peptides while effectively excluding higher-molecular-weight proteins, thereby achieving size-selective enrichment. Elements mapping results confirmed the homogeneous distribution of Fe, O, Si, Ti, and P elements throughout the particles, suggesting the successful coating of TiO2 and grafting of G6P (Fig. 2b). This was further confirmed by Fourier transform infrared spectroscopy (FT-IR), which detected the presence of characteristic functional groups. As shown in Fig. 2c, the absorption peak at 581 cm-1 corresponds to the Fe-O-Fe stretching vibration [31]. The absorption peaks observed in the range of 458–634 cm-1 are characteristic of Ti-O-Ti stretching vibrations [29,32]. The absorption peak at 1080 cm⁻¹ corresponds to the Si-O-Si asymmetric stretching vibration [29]. The absorption peak at 2924 cm⁻1 is attributed to the asymmetric stretching vibration of CH2 in G6P [33]. The broad absorption peak at 3407 cm−1 indicating the existence of some Si-OH and the stretching vibrations of O-H [34]. Thereinto, the abundant hydroxyl groups introduced by G6P modification are evidenced by an increase in the negative zeta potential of the substrate surface [29]. We evaluated the synthesis of Fe3O4@TiO2@mSiO2-G6P by testing the zeta potential of magnetic nanoparticles before and after modifying G6P. As shown in Fig. 2d, the zeta potential of the magnetic nanoparticles decreased from −12.5 mV to −23.0 mV after modification of G6P. This further indicates the successful modification of the hydrophilic G6P.
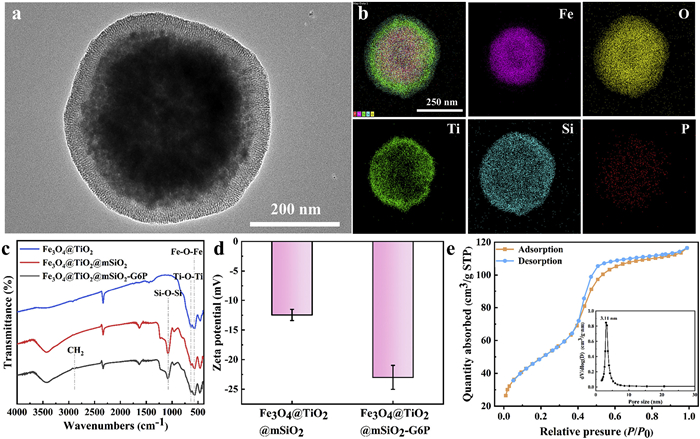
In addition, the nitrogen adsorption-desorption isotherm in Fig. 2e shows a type Ⅳ hysteresis loop, providing conclusive evidence of mesoporous structure formation in the constructed molecular traps. The specific surface area was calculated to be 179.69 m2/g and the pore volume was 0.17 cm3/g by the Brunauer-Emmett-Teller (BET) method. The pore size distribution analyzed by the BJH (Barrett-Joyner-Halenda) method, as shown in the inset of Fig. 2e, reveals 3.11 nm of pores, suggesting its capability for macromolecular protein exclusion in the subsequent experiments [29].
To evaluate the detection sensitivity of Fe3O4@TiO2@mSiO2-G6P, a series of horseradish peroxidase (HRP) tryptic digest samples (230 μL) containing 300 μg of nanoparticles were prepared at five different concentrations (200, 100, 10, 1, 0.5 fmol/μL). As shown in Fig. S1 (Supporting information), when the concentration of HRP tryptic digest is as low as 0.5 fmol/μL, two hydrophilic peptides could still be detected. The detailed information of hydrophilic peptides is shown in Table S1 (Supporting information). It can be observed that almost all of the peptides have a grand average of hydropathicity (gravy) value less than 0. This indicates that Fe3O4@TiO2@mSiO2-G6P has a high sensitivity to the hydrophilic peptide. Additionally, the loading capacity of Fe3O4@TiO2@mSiO2-G6P was determined by incubating the material with varying masses of HRP tryptic digests. After incubation, the supernatant was analyzed via MS to monitor the signal-to-noise ratio (SNR) of a characteristic hydrophilic peptide peak (m/z = 2611.7) from HRP tryptic digests. This peak transitioned from undetectable to clearly observable indicates that the loading capacity of Fe3O4@TiO2@mSiO2-G6P had reached saturation. Based on the ratio of HRP digest concentration to the amount of nanomaterial used, the loading capacity of Fe3O4@TiO2@mSiO2-G6P was measured to be 60 mg/g (Fig. S2 in Supporting information). The morphological analysis of the post-use Fe3O4@TiO2@mSiO2-G6P confirmed the retention of its mesoporous structure, indicating good structural stability (Fig. S3 in Supporting information).
Moreover, considering the interference of large-size proteins in complex biological samples on the detection of hydrophilic peptides, we evaluate the size-exclusion capability of Fe3O4@TiO2@mSiO2-G6P. BSA was mixed with 0.4 μg HRP tryptic digest at mass ratios of 1:100, 1:500, and 1:1000 in 230 μL of enrichment buffer containing 300 μg Fe3O4@TiO2@mSiO2-G6P. As shown in Fig. S4 (Supporting information), when HRP trypsin digest was mixed with BSA at a mass ratio of 1:100, BSA could be easily detected before the enrichment with Fe3O4@TiO2@mSiO2-G6P, while the signal of hydrophilic peptides was low in intensity due to protein interference. After enrichment of Fe3O4@TiO2@mSiO2-G6P, the BSA signals disappeared as the proteins were effectively excluded by the mesoporous channels, whereas the hydrophilic peptides were clearly detected with significantly increase in both intensity and quantity. Further increasing the mass ratios of HRP tryptic digest to BSA to 1:500 and 1:1000, we found that Fe3O4@TiO2@mSiO2-G6P maintained its efficient enrichment capability for hydrophilic peptides while exhibiting excellent protein exclusion performance. These results clearly indicate that Fe3O4@TiO2@mSiO2-G6P can play a crucial role in hydrophilic peptide analysis, particularly in complex samples containing high-abundance proteins.
The enrichment efficiency of the hydrophilic molecular trap for targeted peptides depends heavily on the buffer type. Therefore, we identify an optimal loading buffer conditions using serum sample of patients with GC. Seven loading buffers with different contents of acetonitrile (ACN) and trifluoroacetic acid (TFA) were used with serum sample as test samples. An ACN gradient (40% to 95%) was applied to modulate solvent polarity and the concentration of TCA (0.1% and 3%) was varied to adjust ionic strength and pH. As shown in Fig. S5 (Supporting information), solution of 70% ACN/29.9% H2O/0.1% TFA was identified as the optimal enrichment buffer by comparing the intensity and quantity of 11 representative hydrophilic peptides. The detailed information of the 11 representative hydrophilic peptides of serum is shown in Table S2 (Supporting information). Consequently, this buffer composition was selected for all subsequent experiments.
In this work, serum samples were collected from 175 participants including 65 GC, 38 PDAC and 72 HC. The study protocol was approved by the Ethics Committee of Zhongshan Hospital of Fudan University, China (B2021-837R), ensuring compliance with ethical guidelines. The gender and age distribution of all samples are displayed in Fig. 3a. The chi-square test of gender distribution proved that there was no statistical difference among these three groups (Table S3 in Supporting information). While the non-parametric Mann-Whitney U test of age distribution indicated that GC and PDAC was related to age factor (P < 0.001) (Table S4 in Supporting information), which was consistent with the results reported in the literature previously [35–39]. The experimental workflow is shown in Fig. 1. To minimize random variability, each serum sample was analyzed in triplicate by MALDI-TOF MS to generate three independent mass spectra. Representative original MS spectra from GC, PDAC, and HC groups (Fig. 3b) clearly demonstrate distinct differences in peak intensities, making further research meaningful. MALDIquant was used to perform a series of data operations baseline normalization, and 2157 characteristic peaks were finally obtained across all groups. Machine learning provides the tools to analyze complex data sets to sift through key information and make distinctions. Initially, unsupervised learning using principal component analysis (PCA) revealed overlap among the HC, GC, and PDAC groups (Fig. 3c), indicating that unsupervised methods alone were insufficient for effective classification.
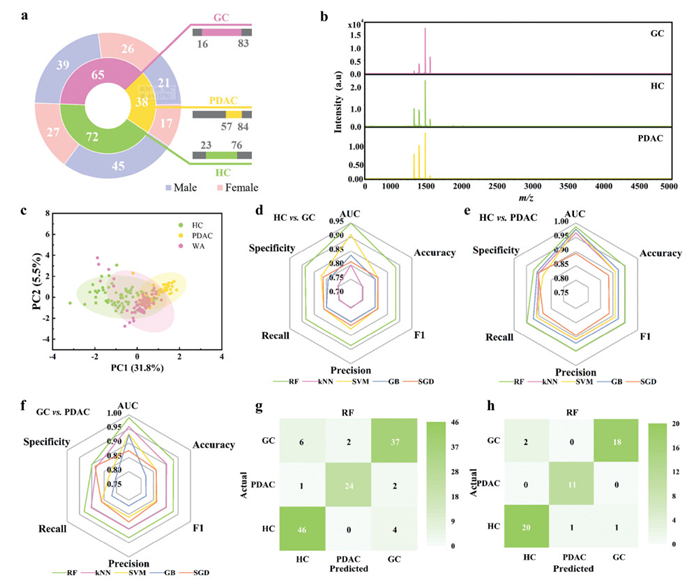
All data were divided into training set (HC/GC/PDAC, 50/45/27) and test set (HC/GC/PDAC, 22/20/11) according to 7:3. Stratification was applied during the splitting process to preserve the proportion of age and gender groups in both the training and test sets. Detailed information for all samples is provided in Table S5 (Supporting information). We apply five machine learning models, including Random Forest (RF), K-Nearest Neighbo (kNN), Support Vector Machine (SVM), Gradient Boosting (GB), and Stochastic Gradient Descent (SGD) to distinguish HC, GC, and PDAC based on all the features. To prevent overfitting, the number of iterations was set to 5. Hyperparameter optimization was performed to improve the performance of the five models. In RF, the number of trees was set to 100 and do not split subsets smaller than 5. In kNN, the number of neighbors was set to 5. The Euclidean distance was adopted as the metric to compute the geometric similarity between instances in the feature space, and a uniform weight scheme was applied, granting equal voting power to each of the K nearest neighbors. In SVM, the optimal hyperparameter set was determined to be an RBF kernel and the numerical tolerance for the optimizer was kept at the default value of 0.001. In GB, the number of trees was set to 100, the learning rate was set to 0.1, the maximum depth of individual trees was set to 3 and the fraction of training instances was set to 1. In SGD, L2 regularization (Ridge) was used with a strength setting of 0.00001. A constant learning rate schedule was employed. The model was trained for a maximum of 1000 iterations with an early stopping tolerance of 0.001. As shown in Figs. 3d–f and Fig. S6 (Supporting information), the radar plots based on AUC, Accuracy, Precision, F1 Score, Specificity and Recall show that all the models can predict HC, GC, and PDAC, with the RF model performing the best. RF shows good discriminative ability in both the training set and the test set, with the test sets of the three paired groups achieving AUC values of 1 (GC vs. PDAC), 1 (HC vs. PDAC) and 0.968 (HC vs. GC). The RF model is a classical supervised learning algorithm, which performs well in dealing with nonlinear problems, handling high-dimensional data and improving the prediction accuracy. The confusion matrix plots of the five machine learning models further validate the superior performance of RF in predicting HC, GC and PDAC (Figs. 3g and h, Fig. S7 in Supporting information), and it was found that the confusion matrix of RF has the highest diagonal value and the lowest number of misclassified samples, which is better to the confusion matrices predicted by the other models. Therefore, we chose the RF model to continue the subsequent analysis of the three pairwise groups.
Encouraged by the results of the RF model on all m/z features, we proceeded to combine each of the three groups in pairs to further select a limited number of features m/z with sufficient information. Fig. 4a illustrates the detailed process of screening feature m/z, including the processing of raw data and the setting of subsequent screening criteria. According to the model prediction results obtained previously, we adopted the RF model to train all feature m/z in the training set and obtained the feature m/z order with a score greater than 0.003 among the 2157 feature m/z. T-test of expression leval analysis and fold change analysis were also applied to screen specific serum peptides for monitoring and distinguishing HC, GC and PDAC. Setting the fold change (FC) value > 2 or < 0.5, P-value < 0.05 in t-test, and combining the RF model scores > 0.003, we selected 4 (HC vs. PDAC), 5 (HC vs. GC), and 3 (PDAC vs. GC) feature m/z, respectively. Heatmaps of all samples in the paired groups were plotted separately based on the selected feature m/z, visualising the differential abundance of feature m/z in different components. From the clustered heatmap in Fig. S8a (Supporting information), it can be seen that the features are differentially expressed in different patients, which indicates that a total of 12 features screened have satisfactory classification results.
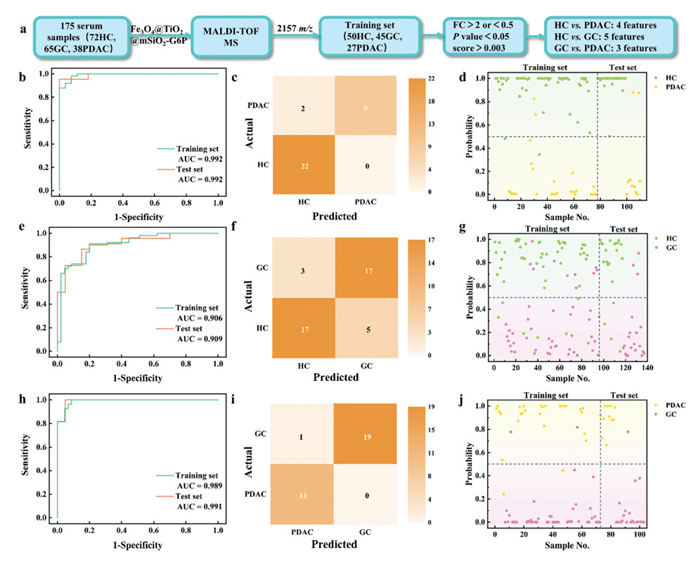
Next, according to the 3 groups of feature m/z screened out, the RF machine learning algorithm was continued to be applied to explore the effective supervision model of HC, GC and PDAC. To prevent overfitting, we performed 5-fold cross validation. Fig. S8b (Supporting information) illustrates the evaluation parameters of the RF model based on 4 (HC vs. PDAC), 5 (HC vs. GC) and 3 (PDAC vs. GC) feature m/z. Detailed data are shown in Table S6 (Supporting information). The RF model parameter data shows that AUC, Accuracy, F1 Score, Precision, and Recall are all relatively high in the 3 groups. For the training set, they reach 0.992, 0.948, 0.948, 0.948 and 0.948 in the HC vs. PDAC group; 0.906, 0.832, 0.831, 0.832 and 0.832 in the HC vs. GC group; 0.989, 0.944, 0.944, 0.944 and 0.944 in the PDAC vs. GC group, respectively. The receiver operating characteristic curves (ROC) of the 3 groups are shown in Figs. 4b, e and h. The AUC values of HC vs. PDAC, HC vs. GC and PDAC vs. GC in the test set reached 0.992, 0.909 and 0.991, respectively. The AUC values in the test set also exceeded 0.900, indicating that the RF model shows strong diagnostic performance. In addition, the confusion matrix diagram of the training set (Fig. S9 in Supporting information) and the confusion matrix diagram of the test set (Figs. 4c, f and i) between each two groups indicate that the selected feature m/z shows high true positive rate (TPR) and true negative rate (TNR) for disease classification, and the number of misclassified samples is low, showing a robust recognition rate. As can be seen from Fig. 4d, in the group of HC vs. PDAC, the probability of HC samples is mostly close to 1 (status set as 1), and the probability of PDAC samples is mostly close to 0 (status set as 1). The two groups in Figs. 4g and j can also distinguish well. We divided the HC, GC and PDAC samples into two groups respectively based on their median age as the dividing point, and observed the differences in the levels of predicted probability between the two age groups within each paired group. As exhibited in the Table S7 (Supporting information), the Mann-Whitney U test for the predicted probability in each age group of the high and low age ranges of each group in paired groups yielded P-values far greater than 0.05. This indicates that there are no significant differences in the distribution of the predicted probability between different age groups. This indicates that the model's prediction results are not biased towards age. Among the three paired groups, the RF classifier trained based on the screened three feature m/z for differential diagnosis of PDAC and GC has simplicity and high accuracy. In the clinical translation scenario, only the abundance of these three biomarkers needs to be detected and input into this model, and an objective diagnostic probability score can be obtained, greatly simplifying the decision-making process. These exciting results and high parameters indicate that the screened peptide features have great potential in the detection of HC, GC and PDAC, prompting more detailed studies on clinical diagnosis and detection of GC and PDAC.
We evaluated the differential abundance of the selected 4 (HC vs. PDAC), 5 (HC vs. GC) and 3 (PDAC vs. GC) feature m/z within groups. From the grouped half violin plots (Fig. 5), it can be seen that the abundance of the screened feature m/z were significantly different in different groups of samples. Therein, m/z = 1455.6 in HC vs. PDAC is significantly down-regulated in PDAC samples; m/z = 2081.0 in HC vs. GC is down-regulated in GC samples and m/z = 1613.7 in PDAC vs. GC is significantly up-regulated in GC samples.
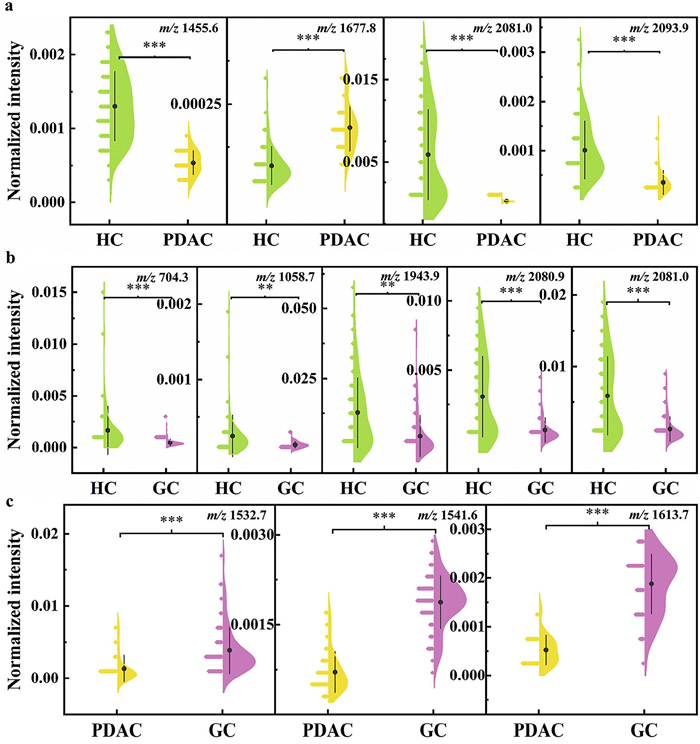
The feature m/z obtained from the screening were analysed using LC-MS/MS and Uniprot database. The results show these 12 characteristic peptides originate from 7 protein fragments, and the details of the characteristic peptides are listed in Table S8 (Supporting information). The 7 protein fragments include kininogen-1, fibrinogen alpha chain, leukemia inhibitory factor, iroquois class homeodomain protein IRX-5, albumin, alpha-1-antitrypsin and serum amyloid A-1 protein. Notably, prior studies have established links between all 7 proteins and GC/PDAC development. For example, Orchekowski and Barber et al. used antibody microarrays to probe the associations of multiple serum proteins with pancreatic cancer and determine the effects of nutritional supplement on the concentrations of proteins in advanced pancreatic cancer patients. In PDAC patients, alpha-1-antitrypsin acts as acute phase proteins (APP), and its expression is altered and abnormal [39,40]. Chung et al. validated the clinical usefulness of serum fibrinogen as a biomarker for PDAC. The mean level of fibrinogen in the PDAC group was significantly higher than that in the control group, suggesting that the level of serum fibrinogen may be a useful biomarker for diagnosis and prediction of PDAC prognosis [41]. Liu et al. identified cancer biomarkers in human serum by two-dimensional difference gel electrophoresis (2D-DIGE) and tandem mass spectrometry revealed that there was a significant difference in the expression of kininogen-1 in the serum of GC patients compared to HC [42]. This suggests that kininogen-1 may be involved in GC progression.
In summary, we successfully constructed a hydrophilic molecular trap with ordered mesopores, enabling rapid and high-throughput serum peptide extraction. A total of 2157 m/z features were obtained as serum peptide fingerprints in 175 serum samples, including HC, GC and PDAC. Different machine learning algorithms were constructed based on these peptide fingerprints, and RF was finally selected for the subsequent analysis. Based on the screening principles of FC > 2 or < 0.5, P-value < 0.05 and score > 0.003, 4 (HC vs. PDAC), 5 (HC vs. GC) and 3 (PDAC vs. GC) potential hydrophilic peptide biomarkers were selected, which showed excellent classification performance to distinguish HC, GC and PDAC, respectively. These features demonstrated high accuracy and precision in monitoring and diagnosing different samples. The AUC values of test set reached 0.992 (HC vs. PDAC), 0.909 (HC vs. GC) and 0.991 (PDAC vs. GC). Heat map and violin plot further showed the differential abundance of the 12 peptide biomarkers in the samples. All the experimental results confirmed the reliability of the screened characteristic peptides as potential biomarkers of diseases. As a conclusion, we established a smart peptidomic diagnostics method based on machine learning, which exhibits excellent performance in serum hydrophilic peptide analysis and in vitro diagnosis of HC, GC and PDAC. This work provides insights into clinical diagnosis and early screening of HC, GC and PDAC, and contributes to the development of diagnostic and monitoring tools for accurate disease prediction and timely prognosis.
This study was approved by the Ethics Committee of Zhongshan Hospital of Fudan University (No. B2021-837R). All experiments in this study were strictly conducted in accordance with ethical standards and the Declaration of Helsinki of the World Medical Association.
Yanchao Zhang: Writing – original draft, Validation, Investigation, Formal analysis. Man Zhang: Software, Formal analysis. Wantong Zhang: Methodology. Shuangshuang Ji: Visualization, Supervision. Xufang Hu: Validation. Nianrong Sun: Writing – review & editing, Supervision, Project administration. Chunhui Deng: Project administration.
The authors declare that they have no known competing financial interests or personal relationships that could have appeared to influence the work reported in this paper.
This work was financially supported by the National Key R&D Program of China (Nos. 2024YFA1307503 and 2024YFC3405402) and the National Natural Science Foundation of China (Nos. 22574028 and 22264024).
Supplementary material associated with this article can be found, in the online version, at doi:
F. Bray, M. Laversanne, H. Sung, et al., CA Cancer J. Clin. 74 (2024) 229–263. doi: 10.3322/caac.21834
R.L. Siegel, T.B. Kratzer, A.N. Giaquinto, et al., CA Cancer J. Clin. 75 (2025) 10–45. doi: 10.3322/caac.21871
E.C. Smyth, M. Nilsson, H.I. Grabsch, et al., Lancet 396 (2020) 635–648. doi: 10.1016/S0140-6736(20)31288-5
L. Zhang, S. Sanagapalli, A. Stoita, World J. Gastroenterol. 24 (2018) 2047–2060.
M. Yang, R.F. Coates, A. Ambaye, et al., Biomark. Res. 6 (2018) 25. doi: 10.1007/978-3-319-72697-7_3
R. Li, B. Liu, J. Gao, Cancer Lett. 386 (2017) 123–130. doi: 10.1016/j.canlet.2016.10.032
E. Smyth, H. Schöder, V.E. Strong, et al., Cancer 118 (2012) 5481–5488. doi: 10.1002/cncr.27550
B. Agarwal, E. Abu-Hamda, K.L. Molke, et al., Am. J. Gastroenterol. 99 (2004) 844–850. doi: 10.1111/j.1572-0241.2004.04177.x
D. Li, K. Xie, R. Wolff, et al., Lancet 363 (2004) 1049–1057. doi: 10.1016/S0140-6736(04)15841-8
H.J. Issaq, Z. Xiao, T.D. Veenstra, Chem. Rev. 107 (2007) 3601–3620. doi: 10.1021/cr068287r
C. Fredolini, F. Meani, A. Luchini, et al., AAPS J. 12 (2010) 504–518. doi: 10.1208/s12248-010-9211-3
E.F. Petricoin, C. Belluco, R.P. Araujo, et al., Nat. Rev. Cancer 6 (2006) 961–967. doi: 10.1038/nrc2011
M. Bassani-Sternberg, E. Barnea, I. Beer, et al., Proc. Natl. Acad. Sci. U. S. A. 107 (2010) 18769–18776. doi: 10.1073/pnas.1008501107
L. Liotta, E. Petricoin, J. Clin. Invest. 116 (2006) 26–30.
H. Yu, B. Wen, M. Huang, et al., Chin. Chem. Lett. 35 (2024) 108235. doi: 10.1016/j.cclet.2023.108235
Z. Xu, H. Chen, H. Chu, et al., Chin. Chem. Lett. 34 (2023) 107829. doi: 10.1016/j.cclet.2022.107829
W. Zhang, Z. Xu, X. Zhang, et al., Talanta 274 (2024) 125948. doi: 10.1016/j.talanta.2024.125948
M.L. Colgrave, A. Jones, D.J. Craik, J. Chromatogr. A 1091 (2005) 187–193. doi: 10.1016/j.chroma.2005.07.094
R. Hellinger, A. Sigurdsson, W. Wu, et al., Nat. Rev. Methods Primers 3 (2023) 25. doi: 10.1038/s43586-023-00205-2
J. Wang, X. Wang, J. Li, et al., J. Mater. Chem. B 10 (2022) 2011–2018. doi: 10.1039/d1tb02827h
X. Han, Y. Yang, J. Lu, et al., Chin. Chem. Lett. 36 (2025) 110183. doi: 10.1016/j.cclet.2024.110183
Q. Wan, Z. Zhang, M. Zhao, et al., Chin. Chem. Lett. 36 (2025) 110794. doi: 10.1016/j.cclet.2024.110794
M. Rao, Z. Guo, H. Dong, et al., Clin. Chim. Acta 571 (2025) 120210. doi: 10.1016/j.cca.2025.120210
Z. Xu, W. Zhang, C. Deng, et al., Chem. Commun. 59 (2023) 11081–11084. doi: 10.1039/d3cc03231k
J. Yao, N. Sun, C. Deng, TrAC Trends Anal. Chem. 99 (2018) 88–100. doi: 10.1016/j.trac.2017.11.016
Y. Guo, Y. Luo, S. Hua, et al., Chin. Chem. Lett. 36 (2025) 110070. doi: 10.1016/j.cclet.2024.110070
G. Weng, B. Wang, Y. Ye, et al., Anal. Chem. 95 (2023) 7735–7742. doi: 10.1021/acs.analchem.3c00927
H. Zhou, M. Ye, J. Dong, et al., Nat. Protoc. 8 (2013) 461–480. doi: 10.1038/nprot.2013.010
Y. Li, H. Wu, N. Sun, et al., J. Chromatogr. A 1587 (2019) 24–33. doi: 10.1117/12.2508620
C. Yang, H. Chen, C. Deng, et al., Anal. Chem. 96 (2024) 2774–2782. doi: 10.3390/electronics13142774
Z. Xu, Y. Wu, Z. Deng, et al., Talanta 234 (2021) 122713. doi: 10.1016/j.talanta.2021.122713
Z. Xu, Y. Wu, X. Hu, et al., Chin. Chem. Lett. 33 (2022) 4695–4699. doi: 10.1016/j.cclet.2021.12.069
B. Jordanov, D. Tsankov, E.H. Korte, J. Mol. Struct. 651-653 (2003) 101–107. doi: 10.1016/S0022-2860(02)00632-4
S. Liu, Y. Qi, L. Cui, et al., Appl. Surf. Sci. 493 (2019) 1013–1020. doi: 10.1016/j.apsusc.2019.07.047
S.Y. Nam, S.W. Jeon, Y.H. Kwon, et al., Dig. Liver Dis. 53 (2021) 1185–1191. doi: 10.1016/j.dld.2021.05.006
M. Saito, N. Asano, A. Imatani, et al., Gastroenterology 164 (2023) S-82.
M.L. Kromrey, R. Bülow, J. Hübner, et al., Gut 67 (2018) 138–145. doi: 10.1136/gutjnl-2016-313127
A. Pourshams, S.G. Sepanlou, K.S. Ikuta, et al., Lancet Gastroenterol. Hepatol. 4 (2019) 934–947. doi: 10.1016/S2468-1253(19)30347-4
R. Orchekowski, D. Hamelinck, L. Li, et al., Cancer Res. 65 (2005) 11193–11202. doi: 10.1158/0008-5472.CAN-05-1436
M.D. Barber, J.A. Ross, T. Preston, et al., J. Nutr. 129 (1999) 1120–1125. doi: 10.1093/jn/129.6.1120
K.H. Chung, J.C. Lee, J. Lee, et al., Pancreatology 20 (2020) 1465–1471. doi: 10.1016/j.pan.2020.06.010
W. Liu, B. Liu, Q. Cai, et al., Clin. Chim. Acta 413 (2012) 1098–1106. doi: 10.1016/j.cca.2012.03.003

Figure 1 Construction of hydrophilic molecular trap and its application in smart peptidomic diagnostics.

Figure 2 (a) FE-TEM image of Fe3O4@TiO2@mSiO2-G6P. (b) Elements mapping images of Fe3O4@TiO2@mSiO2-G6P. (c) FT-IR spectra of Fe3O4@TiO2, Fe3O4@TiO2@mSiO2 and Fe3O4@TiO2@mSiO2-G6P. (d) Zeta potential of magnetic nanoparticles before and after modifying G6P. (e) Nitrogen adsorption-desorption isotherms of Fe3O4@TiO2@mSiO2-G6P. The pore size distribution profile was inserted.

Figure 3 (a) Age and gender distribution of GC patients, PDAC patients and HC in training set and test set. (b) Representative MS spectra of GC, PDAC and HC. (c) PCA to distinguish GC patients, PDAC patients and HC in all samples based on 2157 feature peaks. Radar plots of HC vs. GC (d), HC vs. PDAC (e), GC vs. PDAC (f) predicted by RF, kNN, SVM, GB and SGD in training sets. (g) Confusion matrices of HC vs. PDAC vs. GC predicted by RF in training set based on all features. (h) Confusion matrices of HC vs. PDAC vs. GC predicted by RF in test set based on all features.

Figure 4 (a) Overview scheme of data processing and feature selection workflow. ROC curves of the discrimination in training set and test set between HC and PDAC (b), HC and GC (e), PDAC and GC (h) by RF. Confusion matrix diagram of the test set between HC and PDAC (c), HC and GC (f), PDAC and GC (i) by RF. Scatter plots of predicted probabilities obtained through RF for HC and PDAC (d), HC and GC (g), and PDAC and GC (j).

 扫一扫看文章


扫一扫关注我们
 DownLoad:
 下载:

 下载: