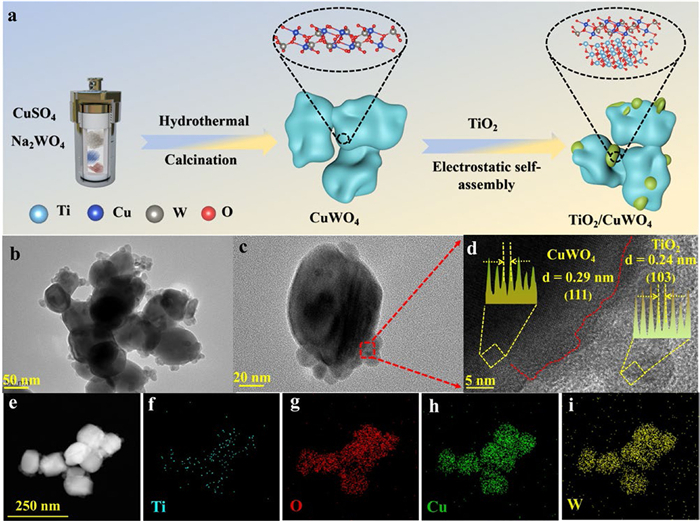
Figure 1.
(a) Diagram of TC heterojunction sample preparation. (b, c) TEM and (d) HRTEM image of TC sample. (e-i) EDS elemental mapping of TC heterojunction.

Interfacial charge transfer in TiO2/CuWO4 S-scheme heterojunction photocatalysts for enhanced CO2 reduction
Heng Zhang , Jiayi Zhang , Wenke Wang , Shuang Ma , Peiying Yang , Changdong Chen , Haopeng Jiang , Hao Xu


In recent years, the excessive exploitation and use of fossil fuels have caused severe energy and environmental problems, with the intensified greenhouse effect driven by massive CO2 emissions being particularly urgent [1–3]. Among various carbon-mitigation technologies, photocatalytic CO2 reduction to high-value carbon products is especially promising [4,5]. Conventional photocatalytic CO2 reduction typically employs triethanolamine as a sacrificial agent to capture photogenerated carriers, which shortens catalyst lifetime and introduces secondary pollution [6]. Moreover, single-component photocatalysts face an irreconcilable trade-off between light-harvesting efficiency and redox capability, leading to low CO2-reduction efficiencies [7–9]. To overcome these limitations, researchers have advanced photocatalytic CO2-reduction systems and constructed heterojunctions to address the band-gap constraints of single photocatalysts. Such heterojunctions generally deliver higher carrier-separation efficiencies and superior activities than their single-component counterparts [10–13]. Among these heterojunction architectures, the conventional Type-Ⅱ heterojunction enables spatial charge carrier separation but inevitably compromises the overall redox capability of the photocatalytic system. In sharp contrast, the S-scheme heterojunction, fabricated by integrating oxidation-type and reduction-type semiconductors, not only preserves robust redox capability but also establishes a prominent internal electric field (IEF) that facilitates the selective recombination of useless carriers [14–17]. Among numerous semiconductors, titanium dioxide (TiO2) has garnered extensive research attention owing to its excellent photocatalytic activity and superior chemical stability [18]. However, as a metal oxide with a 3.0–3.4 eV band gap, TiO2 suffers from limited visible-light absorption and rapid carrier recombination [19–21]. Enhancing carrier transport and visible-light harvesting-thereby unlocking its CO2-reduction potential-requires coupling TiO2 with a narrow-band-gap oxidation-type semiconductor to construct an optimal S-scheme heterojunction. Copper tungstate (CuWO4) is an n-type semiconductor with a suitable band gap, low toxicity, and strong oxidation capability [22,23]. Thus, assembling an efficient S-scheme photocatalyst from CuWO4 and TiO2 is a promising strategy, whereas TiO2 nanoparticles are uniformly loaded onto CuWO4. The strong electrostatic assembly yields intimately bonded crystalline interfaces, which reduces interfacial transport resistance and strengthens the IEF-driven charge-transfer force. Here, we couple TiO2 with CuWO4 via electrostatic self-assembly to construct TiO2/CuWO4 heterojunctions (abbreviated TC) with excellent photocatalytic performance. Photoelectrochemical tests confirm that TC sample exhibits an excellent IEF and strong redox capability. The CO yield reaches 9.53 μmol g−1 h−1. Kinetic analyses show that the TC heterojunction possesses higher carrier density, longer carrier lifetimes, and faster charge-transfer rates than single-component photocatalysts, explaining its superior performance. Density functional theory (DFT) calculations further indicate that TC heterojunction lowers the reaction barrier of the rate-determining step *CO2 to *COOH thereby enabling efficient CO2 reduction.
Herein, TC composite photocatalysts were prepared via electrostatic self-assembly (Fig. 1a), where the zeta potentials of TiO2 and CuWO4 were +13.0 mV and −12.31 mV, respectively (Fig. S1 in Supporting information). Transmission electron microscopy (TEM) was employed to examine the microstructure, revealing that TiO2 nanoparticles are uniformly coupled to the CuWO4 surface, forming a tight heterojunction interface (Figs. 1b and c). HRTEM provided lattice information for TC heterojunction [24]. As shown in Fig. 1d, the measured interplanar spacings are 0.24 nm (TiO2) and 0.29 nm (CuWO4), corresponding to the characteristic crystal planes of the respective phases [25,26]. The lattice fringes of the two phases overlap distinctly at the interface, further confirming the intimate coupling of the heterojunction. In addition, as shown in Figs. 1e-i, energy-dispersive X-ray spectroscopy (EDS) elemental mapping clearly shows a uniform distribution of Ti, W, Cu, and O elements indicates that the TC heterojunction was successfully synthesized [21]. As shown in Fig. S2 (Supporting information), the water contact angles of TiO2, CuWO4, and TC-3 are 30.1°, 40.6°, and 30.7°, respectively, indicating that the prepared samples all exhibit excellent hydrophilicity [27,28]. The diffraction peaks of TiO2 match those of the standard TiO2 card (JCPDS No. 21–1272), indicating the successful synthesis of high-purity TiO2 (Fig. S3 in Supporting information) [29]. In Fig. S3, CuWO4 exhibits strong diffraction peaks at 15.4°, 18.8°, 30.2°, and 36.9°, which can be attributed to the (010), (001), (111), and (002) crystal planes of CuWO4 (JCPDS No. 70–1732) [26]. The XRD pattern of the TC-3 composite also shows diffraction peaks at the same angles, corresponding to the crystal planes of both TiO2 and CuWO4, further confirming the successful construction of the TC-3 composite photocatalyst.
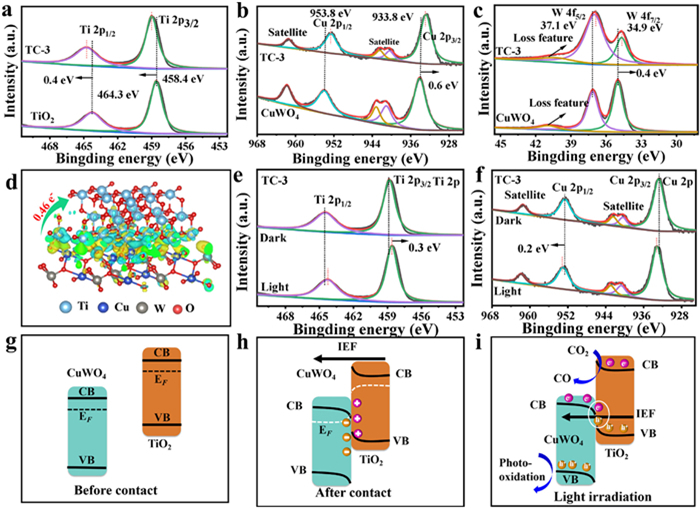
The TC-3 composite photocatalyst contains Ti, W, Cu, and O elements (Fig. S4 in Supporting information) [30]. In Fig. 2a, the X-ray photoelectron spectroscopy (XPS) of Ti 2p in TiO2 sample can be deconvoluted into two peaks at 458.4 eV (Ti 2p3/2) and 464.3 eV (Ti 2p1/2) [31]. In the TC-3 composite, these two characteristic peaks shift slightly to 458.8 and 464.7 eV, respectively. The Cu 2p XPS spectrum of CuWO4 shows two characteristic peaks at 953.8 and 933.8 eV, corresponding to the 2p3/2 and 2p1/2 orbitals of Cu (Fig. 2b) [32]. After constructing the heterojunction, the Cu 2p of TC-3 shift to lower binding energies (0.6 eV). In Fig. 2c, the W 4f XPS spectrum shows two peaks at 37.1 and 34.9 eV, corresponding to the 4f5/2 and 4f7/2 orbitals of W [20,32]. In the TC-3 heterojunction, the W 4f XPS spectrum of CuWO4 also shift slightly to lower binding energies, reaching 36.7 and 34.5 eV. Additionally, the Ti 2p peak in the TC-3 heterojunction shifts to higher binding energies under dark conditions, indicating that TiO2 acts as an electron (e-) donor, while the Cu 2p and W 4f peaks shift to lower binding energies, suggesting that CuWO4 acts as an e- acceptor [33]. As shown in Fig. S5 (Supporting information), the light absorption edge of TiO2 is 385 nm. Compared with pure TiO2, the TC-3 heterojunction composite photocatalyst exhibits a broader light absorption range, laying a foundation for efficient CO2 photocatalytic reduction. Fig. 2d clearly shows the charge migration from CuWO4 to TiO2, which is consistent with the XPS characterization results, confirming the strong interaction between TiO2 and CuWO4. As shown in Fig. S6 (Supporting information), the work functions of TiO2 and CuWO4 are 4.14 and 6.29 eV, respectively. When TiO2 and CuWO4 are in close contact, the mismatch in their Fermi energy levels causes charge migration from TiO2 to CuWO4, resulting in the formation of a IEF at the interface of heterojunction, which aligns with the XPS results. Under light exposure, the characteristic peaks of Cu and W elements in the TC-3 composite shift toward higher binding energies, while the Ti 2p peaks show the opposite trend (Figs. 2e and f, Fig. S7 in Supporting information) [13]. This indicates that the photogenerated charges migrate from CuWO4 to TiO2, driven by the IEF, forming an S-scheme charge transfer pathway (Figs. 2g and h) [34,35]. Therefore, under light illumination, photogenerated charges in CuWO4 combine with holes in TiO2, accelerating the recombination of nonproductive carriers and leaving behind the strongly redox-active carriers to participate in the reaction (Fig. 2i). The band structures of TiO2 and CuWO4 were investigated using the Kubelka-Munk function and XPS valence band spectra [13]. As shown in Figs. S8 and S9 (Supporting information), the band gaps of TiO2 and CuWO4 were calculated to be 3.26 and 1.94 eV, respectively, based on the Kubelka-Munk function. As shown in Figs. S10 and S11 (Supporting information), the valence band (VB) levels of TiO2 and CuWO4 were determined using XPS valence band spectra, which were found to be 1.85 and 2.46 V, respectively [12]. Additionally, the conduction band (CB) values of TiO2 and CuWO4 were calculated using the formula (Eg = EVB - ECB), which yielded values of −1.41 and 0.52 V, respectively. These values are consistent with the results obtained from the Mott-Schottky test (Fig. S12 in Supporting information) [36,37].
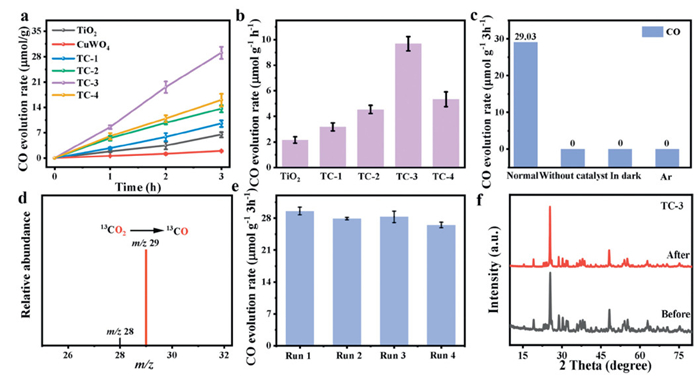
In Figs. 3a and b, pure TiO2 and CuWO4 exhibits low photocatalytic activity due to the rapid recombination of photogenerated carriers. The CO yield of TiO2 and CuWO4 is 2.13 and 0.71 μmol g-1 h-1, respectively. The highest CO yield of 9.53 μmol g-1 h-1 with 96.7% carbon products selectivity is observed for the TC-3, which is 4.47 times that of pure TiO2 (Fig. S13 in Supporting information). Compared with recently reported photocatalysts (Tables S1 in Supporting information), the prepared TC-3 S-scheme heterojunction shows excellent photocatalytic activity. In a sealed reaction vessel, photogenerated holes oxidize H2O to produce oxygen (O2). However, due to the thermodynamically favorable O2 reduction reaction, the produced O2 is consumed, which is consistent with previous report [38]. As displayed in Figs. S14 and S15 (Supporting information), the hydrogen peroxide (H2O2) is the only oxidation production. The H2O2 production rate of TC-3 is 9.07 μmol g-1 h-1. The apparent quantum yield of the TC-3 S-scheme heterojunction at 420 nm reaches 0.46%. In Fig. 3c, no CO production was detected under the conditions of argon (Ar), darkness, and no catalyst. A peak at m/z = 29 (13CO) was observed, further confirming that the detected CO indeed originates from the photoreduction of CO2 (Fig. 3d) [38]. After continuous photocatalytic CO2 reduction experiments, the CO yield of the TC-3 S-scheme heterojunction only slightly decreased (Fig. 3e). After continuous photocatalytic CO2 reduction reactions, the XPS spectra of the TC-3 sample (including the characteristic peaks of Ti 2p, W 4f, Cu 2p, and O 1s) exhibited no discernible shifts, indicating the preservation of the elemental valence states and surface chemical composition (Figs. S16 in Supporting information). Meanwhile, the X-ray diffraction (XRD) patterns revealed that the crystallinity of TC-3 remained intact (Fig. 3f). These results collectively demonstrate the excellent structural and chemical stability of this catalyst during long-term photocatalytic CO2 conversion. As shown in Fig. S17a (Supporting information), the surface charge densities of TiO2 and TC-3 composites are 2.3 and 0.1 μC/cm2, respectively. The steady-state surface photovoltage (SPV) of the TC-3 composite material reaches 170.2 μV, which is higher than that of TiO2 (52.5 μV) (Fig. S17b in Supporting information). Using formula Fs = (−2Vsρ/εε0)1/2, the IEF strength of the prepared photocatalysts was calculated [13]. As shown in Fig. S17c (Supporting information), the IEF strength of the TC-3 composite is 8.6 times of TiO2. The fluorescence (PL) intensity of TC-3 is much weaker than that of TiO2 and CuWO4, indicating that the construction of the S-scheme heterojunction facilitates the rapid separation of charge carriers (Fig. S18a in Supporting information). TiO2 and CuWO4 samples display a larger high-frequency semicircle in the Nyquist plot compared to the TC-3 S-scheme heterojunction, indicating that TC-3 has the lowest charge transfer resistance (Fig. S18b in Supporting information). The photocurrent response of the TC-3 composite photocatalyst is significantly higher than that of pure TiO2 and CuWO4, suggesting that the construction of an excellent IEF promotes the rapid migration of charge carriers (Fig. S18c in Supporting information). As shown in Fig. S19 (Supporting information), TC-3 exhibits a larger electrochemical active surface area, indicating that its surface has more active sites, which is favorable for the photocatalytic reduction of CO2 to CO [39,40].
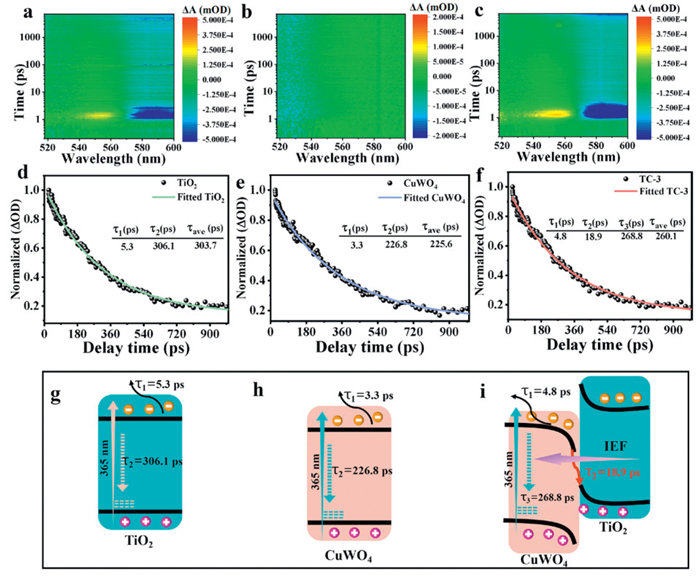
After pump pulse excitation, the TiO2 sample exhibits significant stimulated emission (SE) and ground state bleaching (GSB) signals (Fig. 4a and Fig. S20a in Supporting information) [41,42]. In contrast, CuWO4 shows no distinct SE signals (Fig. 4b and Fig. S20b in Supporting information), but a negative peak at 528 nm, which corresponds to a typical GSB signal. The TC-3 composite photocatalyst exhibits clear GSB and SE signals (Fig. 4c and Fig. S20c in Supporting information). The signal intensity of femtosecond transient absorption spectroscopy (fs-TAS) for TiO2 and CuWO4 is significantly lower than that of TC-3, indicating a relatively fast recombination rate of their photogenerated charge carriers [43]. Additionally, an extra negative peak (573 nm) is observed in the fs-TA spectrum of the TC-3 sample, which is not present in the fs-TA spectra of TiO2 and CuWO4 (Fig. S20c). Therefore, this extra negative peak is attributed to charge transfer at the heterojunction interface of the TC-3 composite material, providing direct evidence for the S-scheme charge transfer pathway. The decay curve of the TiO2 sample at 570 nm, fitted with a biexponential model, reveals two relaxation pathways for the photogenerated charges: Charge diffusion (τ1 = 5.3 ps, shorter) and carrier recombination (τ2 = 306.1 ps) (Figs. 4d and g) [44]. For the CuWO4 photocatalyst, the decay curve, also fitted using the biexponential model, shows that τ1 = 3.3 ps is associated with charge diffusion, and τ2= 226.8 ps corresponds to the recombination of photogenerated charges and holes (Figs. 4e and h). As shown in Figs. 4f and i, the TC-3 composite photocatalyst exhibits three distinct relaxation pathways. Specifically, τ1 = 4.8 ps is assigned to charge diffusion, and τ3 = 268.8 ps is attributed to the recombination of photogenerated e- and holes. However, τ2 = 18.9 ps is ascribed to the recombination of photogenerated holes in TiO2 with photogenerated charges in CuWO4, promoting the consumption of nonproductive carriers [42].
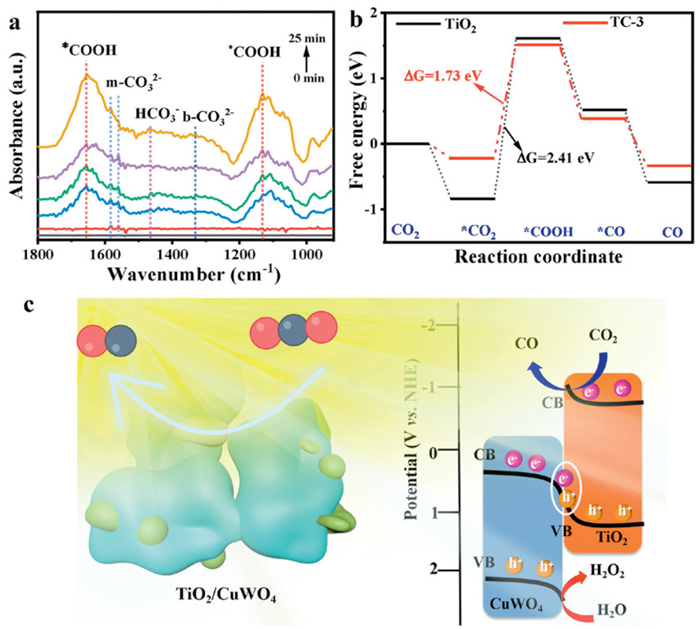
These characteristic peaks correspond to monodentate carbonate (m-CO32-), bicarbonate (HCO3-), carboxyl (COOH), and bidentate carbonate (b-CO32-) groups (Fig. 5a) [45]. The peaks at 1582 and 1558 cm-1 are attributed to m-CO32-, while the peaks at 1330 cm-1 correspond to adsorbed b-CO32-. The peaks at 1470 cm-1 correspond to adsorbed HCO3-. The characteristic peak at 1652 and 1130 cm-1 are assigned to the key intermediate *COOH [46]. The following photocatalytic CO2 reduction process is proposed: First, some CO2 molecules are adsorbed and activated on the TiO2 surface (*CO2), while other CO2 molecules react with water to form H2CO3. Then, H2CO3 dissociates into HCO3-, H+, and CO32-. Next, *CO2 reacts with H+ and photogenerated charges on the TiO2 material surface to generate the key intermediate *COOH (*CO2 + H++ e- → *COOH). The key intermediate *COOH is reduced by H+ and photogenerated charges to *CO (*COOH + H++ e- → *CO + H2O). Finally, the CO molecule desorbs from the TiO2 surface (Figs. S21 and S22 in Supporting information). First, CO2 is adsorbed and activated at the active sites on TiO2 and TC-3. Next, proton-coupled e- transfer occurs, leading to the formation of the key intermediate *COOH (Fig. 5b) [47]. The reaction free energy barriers for the formation of *COOH on TiO2 and TC-3 are 2.41 and 1.73 eV, respectively [48]. The DFT results confirm that the construction of the S-scheme heterojunction promotes proton-coupled e- transfer to generate the key intermediate *COOH, which is further converted into *CO, thereby enabling efficient photocatalytic CO2 reduction. We calculated the charge density differences before and after CO2 and *COOH adsorption on the TiO2 and TC-3 S-scheme heterojunction, showing that the charge redistribution at the heterojunction interface facilitates CO2 activation and *COOH stabilization (Figs. S23 and S24 in Supporting information). The mechanism of photocatalytic CO2 reduction under UV–vis-IR light for the TC-3 composite sample is shown in Fig. 5c. The TC-3 composite sample follows an S-scheme charge transfer mechanism. Under UV–vis-IR illumination, TiO2 and CuWO4 in the TC-3 composite photocatalyst are rapidly excited, and a large number of holes and charges accumulate in the VB and CB of the TiO2 and CuWO4 semiconductor photocatalysts, respectively. Due to the IEF between TiO2 and CuWO4, which provides a strong driving force for the S-scheme charge transfer pathway, useless carriers are quickly recombined, increasing the utilization of carriers with strong redox capabilities. Finally, the photogenerated e- with strong reducing power in the CB of TiO2 participate in the CO2 reduction reaction. Eventually, efficient conversion of CO2 into CO via photocatalysis is accomplished.
In summary, we designed an S-scheme heterojunction based on nanoscale TiO2 using hydrothermal and electrostatic self-assembly techniques. The fs-TA spectroscopy analysis confirmed that the IEF accelerates useless carrier recombination at the heterojunction interface, promoting the participation of strongly reducing carriers in the photocatalytic reaction. The IEF strength of TC-3 is 7.6 times higher than that of TiO2. The optimal TC-3 S-scheme heterojunction achieved a CO yield of 9.53 μmol g-1 h-1, while the CO yield of pure TiO2 was only 2.13 μmol g-1 h-1. This work provides new insights for constructing efficient and stable S-scheme heterojunction photocatalysts, addressing the inherent limitations of single-component photocatalysis.
Heng Zhang: Writing – original draft, Software, Resources, Investigation. Jiayi Zhang: Project administration, Investigation. Wenke Wang: Supervision, Formal analysis. Shuang Ma: Writing – original draft, Validation. Peiying Yang: Supervision, Funding acquisition. Changdong Chen: Software, Funding acquisition. Haopeng Jiang: Writing – review & editing, Visualization, Validation. Hao Xu: Writing – review & editing, Supervision, Investigation, Data curation.
The authors declare that they have no known competing financial interests or personal relationships that could have appeared to influence the work reported in this paper.
This work was supported by the National Natural Science Foundation of China (Nos. 22571067, U1904184 and U1904191) and the Natural Science Foundation of Henan Province (No. 252300423125).
Supplementary material associated with this article can be found, in the online version, at doi:
Z.K. Xie, W.J. Cheng, H.Y. Luo, et al., Adv. Energy Mater. 16 (2026) 2501840. doi: 10.1002/aenm.202501840
Q. Cheng, J.M. Li, Y.X. Huang, et al., J. Mater. Sci. Technol. 261 (2026) 83–93. doi: 10.1016/j.jmst.2025.10.030
T.W. Zhao, W.X. Zhang, J.Y. Xiong, et al., Sep. Purif. Technol. 360 (2025) 130849. doi: 10.1016/j.seppur.2024.130849
K. Wang, Y.J. Hu, X.F. Liu, et al., Nat. Commun. 16 (2025) 2094. doi: 10.1038/s41467-025-57140-x
G. Yang, J.Y. Xiong, M.J. Lu, et al., J. Colloid. Interface Sci. 624 (2022) 348–361. doi: 10.1016/j.jcis.2022.05.092
K.N. Song, S.J. Liang, X.H. Zhong, et al., Appl. Catal. B: Environ. 309 (2022) 121232. doi: 10.1016/j.apcatb.2022.121232
K. Wang, C. Liu, J.P. Li, et al., Appl. Catal. B: Environ. 361 (2025) 124560. doi: 10.1016/j.apcatb.2024.124560
G. Yang, P. Qiu, J.Y. Xiong, et al., Chin. Chem. Lett. 33 (2022) 3709–3712. doi: 10.1016/j.cclet.2021.10.047
K. Wang, Q. Cheng, W.D. Hou, et al., Adv. Funct. Mater. 34 (2024) 2309603. doi: 10.1002/adfm.202309603
L.H. Tan, X.H. Wu, J.C. Xu, et al., Chin. J. Catal. 79 (2025) 174–185. doi: 10.1016/S1872-2067(25)64849-2
F.Y. Xu, F.F. Zhao, X.Y. Deng, et al., Nat. Commun. 16 (2025) 6882. doi: 10.1038/s41467-025-60961-5
G. Santos, L. Tian, R. Gonçalves, et al., Adv. Funct. Mater. 35 (2025) 242205.
H. Jiang, L. Wang, X. Yu, et al., Chem. Eng. J. 414 (2023) 3129.
X.H. Wu, M. Sayed, G.H. Wang, et al., Adv. Mater. 38 (2026) e11322. doi: 10.1002/adma.202511322
L.J. Sun, J.S. Gao, J. Shen, et al., Ceram. Int. 50 (2024) 53801–53811. doi: 10.1016/j.ceramint.2024.10.234
J.C. Wang, H.R. Ma, W.N. Shi, et al., ACS Sustain. Chem. Eng. 13 (2025) 11537–11546. doi: 10.1021/acssuschemeng.5c04025
X.H. Wu, L.H. Tan, G.Q. Chen, et al., Sci. China Mater. 67 (2024) 444–472. doi: 10.1007/s40843-023-2755-2
L.J. Sun, X.H. Yu, L.Y. Tang, et al., Chin. J. Catal. 52 (2023) 164–175. doi: 10.1016/S1872-2067(23)64507-3
A. Zhou, Y. Dou, C. Zhao, Appl. Catal. B: Environ. Energy 264 (2020) 118519. doi: 10.1016/j.apcatb.2019.118519
X. Bai, Z.Y. Fu, X.Y. Ma, et al., J. Cleaner Prod. 369 (2022) 133099. doi: 10.1016/j.jclepro.2022.133099
R.T. Han, K. Wang, Q.C. Jiang, et al., J. Colloid Interface Sci. 671 (2024) 680–691. doi: 10.1016/j.jcis.2024.05.206
Y. Ding, B. Ding, H. Kanda, et al., Nat. Nanotechnol. 17 (2022) 598–605. doi: 10.1038/s41565-022-01108-1
H.W. Su, H.B. Yin, W. Orbell, et al., Angew. Chem. Int. Ed. 64 (2025) e202425446. doi: 10.1002/anie.202425446
S. Ma, P.Y. Yang, H. Sun, et al., Sep. Purif. Technol. 354 (2025) 128976. doi: 10.1016/j.seppur.2024.128976
G. Wang, C. Wang, J. Zheng, J. Mater. Sci. 55 (2020) 3940–3950. doi: 10.1007/s10853-019-04283-0
C. Wang, Y.Q. Zhang, L.J. Zhao, et al., J. Colloid Interface Sci. 592 (2021) 186–194. doi: 10.1016/j.jcis.2021.02.047
L. Liu, W.K. Zhao, T. Gao, et al., Mater. Today Chem. 48 (2025) 103000. doi: 10.1016/j.mtchem.2025.103000
F.L. Zhao, M.L. Zhang, D. Yan, et al., ACS Appl. Nano Mater. 6 (2023) 14478–14487. doi: 10.1021/acsanm.3c02534
N. Sondezi, Z. Njengele-Tetyana, K.P. Matabola, ACS Omega 9 (2024) 15959–15970. doi: 10.1021/acsomega.3c09308
S. Ma, X.X. Wang, X. Zhang, et al., Inorg. Chem. Commun. 180 (2025) 114981. doi: 10.1016/j.inoche.2025.114981
M. Sun, Y.R. Ma, Y.W. Tan, et al., SusMat 5 (2025) e70011. doi: 10.1002/sus2.70011
D.F. Zhang, D. Zhang, F.P. Zhao, et al., J. Mater. Chem. A 12 (2024) 33546–33558. doi: 10.1039/d4ta06654e
X.W. Shi, Z.Q. Su, C. Deng, et al., Adv. Mater. 37 (2025) 2508492. doi: 10.1002/adma.202508492
Z.K. Xie, L.H. Li, S.H. Gong, Angew. Chem. Int. Ed. 63 (2024) e202410250. doi: 10.1002/anie.202410250
Z.Q. Yang, S.Y. Yang, H.J. Yang, et al., Small 21 (2025) e08960. doi: 10.1002/smll.202508960
D. Yan, H. Miao, J. Fan, et al., Langmuir 39 (2023) 16648–16656. doi: 10.1021/acs.langmuir.3c02719
T. Yang, X.Y. Hu, J. Fan, et al., Surf. Interfaces 42 (2023) 103352. doi: 10.1016/j.surfin.2023.103352
W. Song, C. Wang, Y. Liu, et al., J. Am. Chem. Soc. 146 (2024) 29028–29039. doi: 10.1021/jacs.4c10023
M.L. Zhang, F.L. Zhao, K.T. Feng, et al., J. Alloys Compd. 963 (2023) 171302. doi: 10.1016/j.jallcom.2023.171302
T. Sun, C.X. Li, Y.P. Bao, et al., Acta Phys. Chim. Sin. 39 (2023) 2212009. doi: 10.3866/pku.whxb202212009
F.Y. Xu, W.T. Mei, P.Y. Hu, et al., Angew. Chem. Int. Ed. 64 (2025) e202513364. doi: 10.1002/anie.202513364
L.J. Sun, W.C. Yan, W.K. Wang, et al., Angew. Chem. Int. Ed. 64 (2025) e202511080. doi: 10.1002/anie.202511080
W.K. Wang, W. Shan, Y. Hu, et al., Chem. Eng. J. 493 (2024) 152516. doi: 10.1016/j.cej.2024.152516
H.Y. Li, J.J. Zhang, B.C. Zhu, et al., Adv. Funct. Mater. 36 (2026) e21318. doi: 10.1002/adfm.202521318
L. Hao, L. Kang, H.W. Huang, et al., Adv. Mater. 31 (2019) 1900546. doi: 10.1002/adma.201900546
D.D. Liu, L.P. Jiang, D.Q. Chen, et al., ACS Catal. 14 (2024) 5326–5343. doi: 10.1021/acscatal.4c00409
S.H. Yang, W.J. Byun, F.M. Zhao, et al., Adv. Mater. 36 (2024) 2312616. doi: 10.1002/adma.202312616
J.Y. Wang, H.Y. Zhang, Y. Nian, et al., Adv. Funct. Mater. 34 (2024) 2406549. doi: 10.1002/adfm.202406549

Figure 1 (a) Diagram of TC heterojunction sample preparation. (b, c) TEM and (d) HRTEM image of TC sample. (e-i) EDS elemental mapping of TC heterojunction.

Figure 2 The XPS spectra of Ti 2p (a), Cu 2p (b), and W 4f (c). (d) The charge-density-difference images of TC-3 heterojunction interfacial structure (the green area represents the consumption of e-, and the yellow regions represent e- aggregation regions). In situ XPS spectra of Ti 2p (e) and Cu 2p (f). (g-i) Sketches of TiO2 and CuWO4 before/after contact and light irradiation.

Figure 3 (a, b) Photocatalytic activity of the TiO2, TC-1, TC-2, TC-3, and TC-4. (c) CO evolution under different reaction conditions. Mass spectra of 13CO result (d), stability test (e), and XRD patterns of TC-3 before and after photoreduction CO2 reaction cycles (f).

Figure 4 2D pseudo-color fs-TA spectra of TiO2 (a), CuWO4 (b), and TC-3 (c) under 365 nm pump. The extracted decay kinetics of TiO2 (e), CuWO4 (e), and TC-3 (f). The schematic illustration of e- dynamics in TiO2 (g), CuWO4 (h), and TC-3 (i).

 扫一扫看文章


扫一扫关注我们
 DownLoad:
 下载:

 下载: