Push-pull electronic engineering induced Ru-Ni2P/FeCo2O4 bifunctional electrocatalyst with multiple electron transport channel for efficient water splitting
Citation:
Danhua Jiao, Tianxue Li, Qi Li, Xiaodong Cai, Qian Liao, Hua Zhou, Ying Li, Qian Zheng, Weiwei Xu, Qizhao Wang. Push-pull electronic engineering induced Ru-Ni2P/FeCo2O4 bifunctional electrocatalyst with multiple electron transport channel for efficient water splitting[J]. Chinese Chemical Letters,
2026, 37(12): 112703.
doi:
10.1016/j.cclet.2026.112703
Push-pull electronic engineering induced Ru-Ni2P/FeCo2O4 bifunctional electrocatalyst with multiple electron transport channel for efficient water splitting
English
Push-pull electronic engineering induced Ru-Ni2P/FeCo2O4 bifunctional electrocatalyst with multiple electron transport channel for efficient water splitting
School of Materials Science and Engineering, Guizhou Minzu University, Guiyang 550025, China
b.
School of Physics and Mechatronic Engineering, Guizhou Minzu University, Guiyang 550025, China
c.
School of Chemical Engineering, Guizhou Minzu University, Guiyang 550025, China
d.
State Key Laboratory for Comprehensive Utilization of Nickel and Cobalt Resources, Jinchang 737100, China
e.
Office of International Exchange and Cooperation, Guizhou Minzu University, Guiyang 550025, China
f.
School of Water and Environment, Key Laboratory of Subsurface Hydrology and Ecological Effects in Arid Region of Ministry of Education, Chang’an University, Xi’an 710054, China
wangqizhao@163.com (Q. Wang). 1 These authors contributed equally to this work.
Received Date:
27 November 2025 Accepted Date:
31 March 2026 Revised Date:
28 February 2026 Available Online:
15 December 2026
Abstract:
Green hydrogen energy is highly desired but is constrained by sluggish reaction kinetics and the low efficiency of active sites. This study presented a synergistic enhancement of efficient electron transportation and push-pull charge modulation in the electrocatalytic water splitting system Ru-Ni2P/FeCo2O4 (Ni2P/FCO) by rationally optimizing the charge environment of active sites. Experimental findings exhibited satisfactory overpotentials of 16 mV and 41 mV for the hydrogen evolution reaction (HER) in 1 mol/L KOH and seawater environments, respectively, to reach a current density of 10 mA/cm2. Exceptional oxygen evolution reaction (OER) and overall water splitting performance (with an overpotential of 1.74 V at 100 mA/cm2) were also demonstrated. In addition, the Ru-Ni2P/FCO system showed comparable durability during 50 h. Density functional theory (DFT) simulations explained the reason for the improved activity: The metallic alteration of Ni2P/FCO, along with the established steady built-in electric field at the interface, accelerated charge transportation and improved the adsorption-desorption dynamics during HER/OER procedures. The push-electron activity of Ni2P and the pull-charge capability of Ru promoted the charge accumulation at reactive sites, thereby decreasing the energy barriers for both HER and OER intermediates. This study provides novel insights into the development of effective electron-transfer routes and the enhancement of catalysts’ intrinsic activity.
The electrolysis of water is a promising method for hydrogen production; nevertheless, its large-scale application is hindered by elevated costs [1]. The prompt advancement of effective and stable non-precious metal electrocatalysts for water electrolysis is essential to overcome the key challenges of high costs and scarcity associated with noble metal catalysts (e.g., Pt, IrO2, RuO2) [2]. Recent years have witnessed substantial advancements in the research of non-precious metal catalysts [3,4]. Oxides [5], hydroxides [6], phosphides [7], carbides [8,9], nitrides [10], and sulfides [11] have emerged as viable electrocatalysts for water decomposition processes. In particular, cobalt-based spinel bimetallic oxides (MCo2O4, where M = Zn, Ni, Mn, or Cu) have advantageous applications owing to their merits of affordability, eco-friendliness, and remarkable stability [12,13]. The synergistic interaction between bimetallic materials may enhance the adsorption energy of intermediates, thereby modulating the d-band center of Co in FeCo2O4 catalysts, which significantly improves charge transfer efficiency and catalytic performance [14]. Luo et al. discovered that this unique bimetallic synergistic process results in a substantial reduction of the OER overpotential, with a 95 mV decrease in η10 for Fe-Co3O4 compared to Co3O4 [15]. Furthermore, good catalytic stability could also be provided in these catalytic systems [16]. However, the low intrinsic conductivity and inadequate ion diffusion capacity of FeCo2O4 result in redox reactions, hence diminishing the overall utilization of active sites and exhibiting suboptimal intrinsic activity for HER [17].
Efficient modification techniques have been conducted, including heteroatom doping, morphological control, heterostructure engineering, and defect introduction [18]. In general, the creation of heterostructure facilitates the redistribution of interfacial electrons, hence expediting charge transfer and augmenting catalytic activity. For example, FeCo2O4/CeO2 [19] and FeCo2O4@NiMn LDH/NF [20] facilitate interfacial electron redistribution, expedite charge transfer, and improve catalytic efficacy. Research indicates that transition-metal phosphides (TMPs) are attracting intense interest because they combine metallic conductivity with a dense network of catalytically active centers on both the metal atoms and the phosphorus anions [21]. Incorporating electron-rich P into the lattice limits electron delocalization on the metal, resulting in the metal-P bonds with a mixed covalent/ionic character that enhances thermal, mechanical, and chemical robustness [22]. Phosphorus also narrows the occupied molecular orbital-lowest unoccupied molecular gap, accelerating electron transfer during electrocatalysis [23]. Structurally, TMPs mimic hydrogenases in which metal and phosphorus sites jointly serve as proton and hydride acceptors, enabling exceptional catalytic activity [24]. Notably, Ni2P is distinguished by its high charge density near the Fermi level, which enables rapid electron transfer during catalysis and provides opportunities for modulating its electronic structure [25]. For instance, Li et al. accomplished complete water splitting at a substantial current density of 1000 mA/cm2 with merely 1.93 V by adjusting the structure and electronic characteristics of the (Fe, Ni)2P@Ni2P heterostructure [26]. By leveraging the high work function of metal oxides to facilitate the electron transfer of metal phosphides, the kinetic limitations of the HER/OER process are effectively overcome, and the poor conductivity of transition metal oxides (TMOs) is mitigated [27]. Zhang et al. employed the work function disparity between MoO2 and Ni2P to promote electron transport from Ni2P to MoO2, thereby establishing a robust electronic connection. This enhancement not only refines the electronic structure but also increases the density of electronic states adjacent to the Fermi level [28]. Based on the above advantages, the construction of Ni2P heterogeneous interfaces with FeCo2O4, alongside the exploitation of their functional disparities to facilitate the directional migration of interfacial electrons, is anticipated to well-tune the charge distribution at active sites.
Despite the development of a heterogeneous structure that enhances conductivity and reaction kinetics, the inherent activity requires additional amplification. The heteroatom doping strategy is widely recognized to address the aforementioned issue [29,30]. Research demonstrates that Ru-P coordination can markedly alter the electronic environment of active centers, enabling the catalyst to achieve hydrogen adsorption characteristics akin to those of platinum [31]. For example, Jiang et al. found that the HER kinetics were significantly accelerated by the Ru-doped CoP system, which was accomplished by optimizing the electronic environment [32]. The incorporation of Ru atoms facilitates charge transfer, while the redistribution of electron density promotes electron polarization, and robust electron coupling significantly increases catalytic activity [33]. As an illustration, the introduction of Ru to Ni3Se2/FeSe2 heterojunctions results in charge redistribution at the interface, which lowers the decisive step energy barriers to −0.37 eV and 1.92 eV for HER and OER, respectively [34]. Consequently, a rational regulation of the interfacial electronic structure and active sites is anticipated to provide a promising pathway for enhancing the overall activity of water cracking electrocatalysts through the introduction of Ru doping. Simultaneously, simple and scalable synthetic routes are needed to make the jump from lab-scale finding to industrial application [35,36].
Herein, this thesis utilizes dual-strategy modification engineering, establishing oriented charge transfer pathways and adjusting the charge environment of active centers to develop a HER/OER bifunctional electrocatalytic system, Ru-Ni2P/FCO, which markedly improves overall electrocatalytic performance by decreasing overpotential and promoting intermediate release. Experimental findings and theoretical analyses demonstrated that the accelerated charge transfer at the Ni2P/FCO interface triggered interfacial charge redistribution in turn. And the resulting charge redistribution enhanced electronic coupling and optimized the active center’s electronic configuration. Consequently, Ru-Ni2P/FCO exhibits remarkable catalytic activity for HER (16 mV@10 mA/cm2) and OER (221 mV@10 mA/cm2) in a 1 mol/L KOH environment, and the practical applicability potential of this catalytic system is confirmed by both simulated and real seawater experiments. This study offers innovative insights for the development of advanced high-performance catalysts.
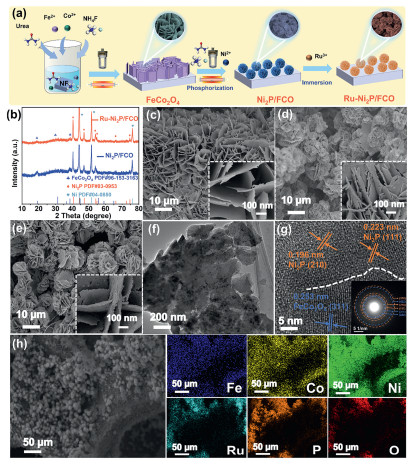
Fig. 1a depicts the preparation details of Ru-Ni2P/FCO. The crystalline structures of the resultant samples were characterized by X-ray diffraction (XRD). Fig. S1 (Supporting information) illustrates that the distinct peaks at 19.0°, 31.2°, 36.6°, 38.5°, 58.9°, and 64.8° correspond to the (111), (220), (311), (222), (511), and (440) crystallographic facets of the spinel phase FeCo2O4 (PDF #96–153–3163), respectively. The peaks at 44.3°, 51.6°, and 76.2° are ascribed to the Ni substrate. In the XRD spectrum of Ni2P/FCO seen in Fig. 1b, beside the diffraction peaks of FeCo2O4, (111), (210), (300), (211), (310), and (410) crystal planes of Ni2P (PDF #03–0953) are detected at separate angles of 40.8°, 47.3°, 54.2°, 54.9°, 66.2°, and 74.6° are also visible, respectively. There are no additional diffraction peaks of Ru-Ni2P/FCO and Ni2P/FCO. This may be ascribed to the insufficient Ru content, which is below the detection threshold of XRD [37]. The morphology of the Ru-Ni2P/FCO products at various production phases was examined utilizing scanning electron microscopy (SEM). Fig. 1c illustrates that FeCo2O4 nanosheets grow uniformly on the NF substrate, exhibiting a smooth surface. In Fig. 1d, Ni2P/FCO exhibits a rough nanoflower-like shape. This morphological transition from smooth sheets to rough structures enhances the geometric surface area, presumably resulting from the curling of nanosheets. The Ru-Ni2P/FCO samples shown in Fig. 1e display a more prominent nanoflower, which distinctly illustrates a significantly rougher and more porous nano-petal surface, confirming the successful anchoring of Ru species.
Figure 1
Figure 1.
(a) Schematic diagram of synthesis Ru-Ni2P/FCO. (b) X-ray diffraction (XRD) pattern of Ni2P/FCO and Ru-Ni2P/FCO. SEM images of (c) FeCo2O4, (d) Ni2P/FCO, and (e) Ru-Ni2P/FCO. (f) TEM images of Ru-Ni2P/FCO. (g) HRTEM images of Ru-Ni2P/FCO. (h) The corresponding elemental mapping images of Ru-Ni2P/FCO.
Transmission electron microscopy (TEM) was conducted to analyze the microstructure of Ru-Ni2P/FCO. The 3D framework of Ru-Ni2P/FCO is further confirmed in Fig. 1f. This hierarchical 3D porous architecture is architecturally beneficial for electrocatalysis, since it prevents the agglomeration of active materials and facilitates ample open pathways for electrolyte infiltration. Fig. 1g exhibits the lattice spacing of 0.253 nm, representing the (311) crystalline plane of FeCo2O4. The determined crystal spacings were 0.196 and 0.223 nm, which correspond to the (210) and (111) crystal planes of Ni2P, respectively. Additionally, the inset of Fig. 1g displays the selected area electron diffraction (SAED) pattern, which reveals distinct diffraction rings, confirming the polycrystalline nature of Ru-Ni2P/FCO and validating the presence of both FeCo2O4 and Ni2P phases. Fig. 1h illustrates that energy-dispersive spectroscopy (EDS) images reveal a uniform distribution of Fe, Co, Ni, Ru, P, and O within the Ru-Ni2P/FCO sample. Notably, the highly similar distributions of Ru and P suggest that Ru atoms may have been successfully doped into the Ni2P structure. These results confirm the successful preparation of Ru-Ni2P/FCO heterostructures. Additionally, Fig. S2 (Supporting information) shows that the FeCo2O4, Ni2P/FCO, and Ru-Ni2P/FCO materials all exhibit type Ⅳ adsorption-desorption isotherms with H3 hysteresis loops, indicating the presence of mesoporous structures. This is consistent with their pore size distribution curves [38]. Ru-Ni2P/FCO achieves the largest specific surface area (SBET) of 9.4 m2/g (Table S1 in Supporting information) compared to FeCo2O4 (7.1 m2/g) and Ni2P/FCO (7.7 m2/g). The enhanced surface roughness and specific surface area of Ru-Ni2P/FCO optimize the accessibility of active areas. Simultaneously, the mesoporous nanoflower architecture promotes the rapid diffusion of ions and the liberation of gas bubbles, thus surmounting mass transfer constraints during the HER and OER processes.
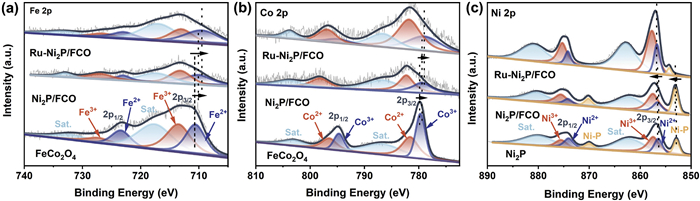
X-ray photoelectron spectroscopy (XPS) was employed to investigate the strong electron interactions in Ru-Ni2P/FCO catalysts. Fig. S3 (Supporting information) identifies the coexistence of the elements Fe, Co, O, Ni, P, and Ru. Fig. 2a illustrates the high-resolution Fe 2p XPS spectra. The primary peaks of Fe2+ and Fe3+ are situated at approximately 710.6 eV (Fe 2p3/2), 723.4 eV (Fe 2p1/2), 713.5 eV (Fe 2p3/2), and 727.3 eV (Fe 2p1/2), with satellite peaks observed at 717.6 and 731.9 eV [17,39]. The compositing of FeCo2O4 with Ni2P resulted in a slight blue shift of the Fe 2p peak. Following the incorporation of Ru into the Ni2P/FCO composite, the distinctive peaks of Fe2+ exhibited a shift towards a lower binding energy. This decrease in binding energy suggests that the introduction of Ru may have increased the electron density of Fe, thus changing its electronic structure. Fig. 2b demonstrates that the Co 2p XPS spectra of FeCo2O4 display distinctive peaks at 779.4 eV (2p3/2) and 794.9 eV (2p1/2), indicative of Co3+, whereas peaks at 781.1 eV (2p3/2) and 797.4 eV (2p1/2) are ascribed to Co2+ [40]. In contrast to FeCo2O4, Co predominantly exists in Ni2P/FCO as Co2+, with a portion of Co3+ being converted to Co2+. This suggests that FeCo2O4 functions as an electron acceptor, promoting electron transfer. The lower oxidation state of Co in Ni2P/FCO results in higher reactivity [41,42]. The modification of the internal electronic structure of the catalyst is advantageous for enhancing its overall catalytic activity [43]. The electronic structure of Co remained unchanged when Ru was included in Ni2P/FCO. The distinctive peaks of Co3+ in Ni2P/FCO and Ru-Ni2P/FCO are displaced towards lower binding energies, indicating an enhancement in the electron density of Co following the generation of heterojunctions as well as the incorporation of Ru. The high-resolution XPS spectra of Ni 2p for Ni2P (Fig. 2c) exhibit four pairs of peaks at 856.2 eV/874.2 eV, 857.2 eV/875.1 eV, 862.0 eV/880.5 eV, and 852.9 eV/870.0 eV, corresponding to Ni2+, Ni3+, shake-up satellites (Sat.), and Ni-P bond [44]. In Ni2P/FCO, the Ni 2p binding energy exceeds that of Ni2P alone, signifying a reduced Ni electron density in Ni2P/FCO. In the Ru-Ni2P/FCO catalyst, the Ni 2p peak exhibits a red shift relative to that of the Ni2P/FCO catalyst. This behavior can be ascribed to the disparity in electronegativity between Ru and Ni. This disparity induces electronic interactions between Ni2P and Ru, thus modifying the electronic configuration of the metal centers within the catalyst [37]. While the construction of the heterostructure and Ru doping lead to an increase in the Ni-P binding energy, which enhances the electron transfer and promotes the adsorption of O intermediates during the OER process [45]. The construction of the Ru-Ni2P/FCO heterojunction and subsequent Ru doping significantly increased the Ni3+/Ni2+ peak area ratio, as observed in the XPS spectra.
Figure 2
Figure 2.
High-resolution XPS spectra of (a) Fe 2p, (b) Co 2p, (c) Ni 2p.
Fig. S4a (Supporting information) illustrates that the Ru 3d XPS spectra exhibit two peaks at 280.5 and 284.5 eV, signifying the presence of metallic Ru0 species. The peaks at 281.7 and 286.0 eV correspond to partially oxidized Ru3+ species [46,47]. In Fig. S4b (Supporting information), the P 2p XPS spectrum displays two principal peaks: 129.8 eV, associated with phosphorus in metal-phosphorus, and a prominent peak at 134.9 eV, indicative of oxidized phosphorus (P-O), presumably resulting from oxidation during preparation or atmospheric exposure [2,48]. Moreover, the peaks belonging to the P-M bonds in Ru-Ni2P/FCO exhibit a negative shift in comparison to those in the Ni2P/FCO electrode, implying that Ni in Ru-Ni2P/FCO carried more positive charges and P carried more electrons, which indicated an enhancement in the binding energy of P to Ni [49]. The results confirm that Ru doping significantly optimizes the electronic configurations of the Ni2P/FCO. The O 1s XPS spectra seen in Fig. S4c (Supporting information), can be analyzed into three distinct peaks at 530.2, 531.5, and 532.6 eV. The signal at 530.2 eV primarily signifies metal-oxygen bonding (M-O), the signal at 531.5 eV corresponds to hydroxyl (-OH), and the signal at 532.6 eV is associated with physically adsorbed water molecules [50,51]. The XPS analysis results indicate a complex electronic interaction within the Ru-Ni2P/FCO heterostructure. The reduction in Fe and Co binding energies, together with the red shift of Ni 2p, where Ni functions as an electron donor to the FeCo2O4 substrate and Ru species. From a catalytic standpoint, the abundance of Ni3+ species is highly advantageous for OER, as it enhances the adsorption affinity of oxygenated intermediates [52]. Concurrently, the altered electron density surrounding the Ru and Fe centers adjusts the d-band center, thereby enhancing the proton reduction kinetics for HER. Consequently, the enhanced bifunctional activity directly results from this synergistic electronic modulation, which reduces the overall thermodynamic barriers for both water splitting half-reactions.
HER performance tests were conducted in 1 mol/L KOH electrolyte solution. As depicted in Fig. S5 (Supporting information), samples were prepared using RuCl3·3H2O solutions of varying concentrations, specifically 0.5, 0.8, 1, and 1.2 mg/mL. Among these, the Ru-Ni2P/FCO sample synthesized with a 1 mg/mL RuCl3·3H2O solution exhibited the most superior HER activity. Consequently, this sample was chosen for subsequent investigations, which are detailed below.
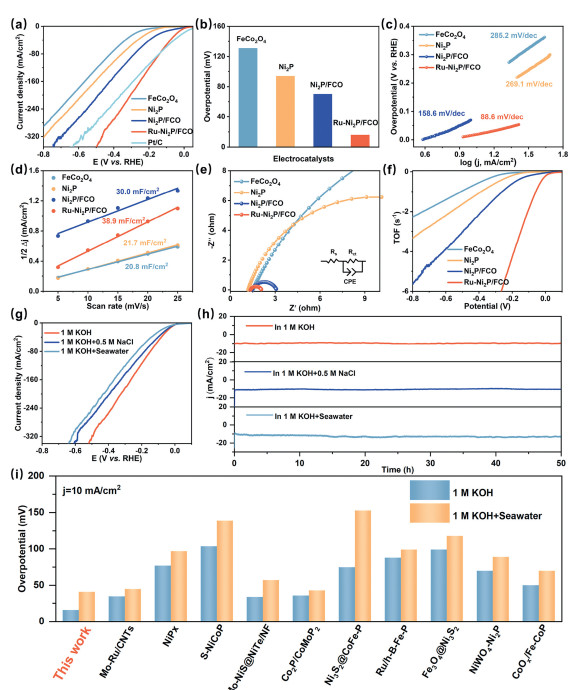
To guarantee the dependability of the results, the primary sample Ru-Ni2P/FCO was synthesized in different batches. A statistical analysis and error bar evaluation were conducted on the gathered data to verify the reproducibility (Fig. S6 Supporting information). Fig. 3a displays the LSV curves of Ru-Ni2P/FCO, Ni2P/FCO, FeCo2O4, Ni2P, and commercial Pt/C, among which the Ru-Ni2P/FCO demonstrates the superior HER electrocatalytic activity (Fig. 3b, ultralow overpotential of 16 mV@10 mA/cm2), with commercial Pt/C used for a reference. By comparison, representing a significant improvement over Ni2P/FCO (70 mV), FeCo2O4 (131 mV), and Ni2P (97 mV). The improved catalytic activity results from the robust electronic synergistic effect at the Ni2P/FeCo2O4 heterojunction interface. The inclusion of Ru significantly enhances HER activity by acting as an active site for hydrogen adsorption and desorption, facilitating hydrogen spillover, and modifying the electronic structure to lower the activation energy [53], thereby further strengthening the interfacial interaction. Fig. 3c demonstrates that Ru-Ni2P/FCO has the lowest Tafel slope of 88.6 mV/dec, which is smaller than that of Ni2P/FCO (158.6 mV/dec), FeCo2O4 (285.2 mV/dec) and Ni2P (269.1 mV/dec). This indicates that Ru-Ni2P/FCO exhibits the most rapid HER kinetics, suggesting that the Volmer-Heyrovsky pathway is likely involved, with the alkaline Volmer step as the rate-limiting factor [54]. The electrochemical double-layer capacitance (Cdl) and the associated electrochemically active surface area (ECSA) of various catalysts were further evaluated by cyclic voltammetry testing (Fig. S7 in Supporting information) [55]. As illustrated in Fig. 3d that Ru-Ni2P/FCO possesses the highest Cdl of 38.9 mF/cm2, significantly surpassing Ni2P/FCO (30.0 mF/cm2), Ni2P (21.7 mF/cm2), and FeCo2O4 (20.8 mF/cm2). The maximum capacitance value is likely due to Ru doping and the numerous heterogeneous interfaces between the Ni2P and FeCo2O4 components. Notably, the LSV curves normalized according to the ECSA (Fig. S8 in Supporting information) indicate that Ru-Ni2P/FCO has the lowest overpotential, confirming a significant boost in intrinsic activity per active site. The electrochemical impedance spectroscopy (EIS) fitting results depicted in Fig. 3e, where Ru-Ni2P/FCO has the smallest Nyquist semicircular radius, indicating Ru-Ni2P/FCO has the strongest charge transfer capability. The turnover frequency (TOF) analysis (Fig. 3f and Fig. S9 in Supporting information) reveals that Ru-Ni2P/FCO possesses the highest TOF value, hence affirming its exceptional intrinsic catalytic performance for HER from a kinetic standpoint.
Figure 3
Figure 3.
(a) LSV curves, (b) overpotentials, (c) Tafel plots, (d) double-layer capacitances, (e) Nyquist plots, and (f) TOF values of Ru-Ni2P/FCO and other catalysts in 1.0 mol/L KOH for HER. (g) Polarization curves, and (h) chronoamperometry i-t-test at constant potential for 50 h of Ru-Ni2P/FCO in 1.0 mol/L KOH, 1.0 mol/L KOH + 0.5 mol/L NaCl and 1.0 mol/L KOH + seawater, respectively. (i) Comparison of the overpotential with other recently reported analogous catalysts. M = mol/L.
The HER performance in simulated seawater (1 mol/L KOH + 0.5 mol/L NaCl) and genuine seawater (1 mol/L KOH + seawater) is further examined to assess the practical application potential of Ru-Ni2P/FCO. As displayed in Fig. 3g, in simulated seawater, Ru-Ni2P/FCO necessitates an overpotential of merely 23 mV to attain a current density of 10 mA/cm2. In the genuine seawater environment, a requisite overpotential of 41 mV is necessary to achieve the equivalent current density. This could be related to the possible poisoning of active sites by impurities in seawater, such as microbes and suspended particles. Nonetheless, it surpasses most non-noble metal catalysts that have been documented (as demonstrated in Fig. 3i and Table S2 in Supporting information).
The stability of a catalyst is a crucial determinant in assessing the practicality of HER catalysts in real-world applications. Chronoamperometry analyses (Fig. 3h) reveal that Ru-Ni2P/FCO can consistently function for > 50 h at a constant potential in 1.0 mol/L KOH, 1.0 mol/L KOH + 0.5 mol/L NaCl and 1.0 mol/L KOH + seawater, demonstrating negligible fluctuations in current density. Following the stability test, XRD and SEM were employed again to further confirm the chemical stability of the Ru-Ni2P/FCO catalyst. As illustrated in Fig. S10 (Supporting information), the crystal structure remains fundamentally unaltered, preserving the original characteristic peaks. Simultaneously, as shown in Fig. S11 (Supporting information), the surface morphology exhibits no substantial deformation. The elemental composition and chemical states, as determined by XPS measurements after HER (Fig. S12 in Supporting information), are fundamentally consistent with the pristine catalyst. After 24 h of HER in genuine seawater, SEM analysis (Fig. S13 in Supporting information) revealed no significant structural corrosion, further affirming its exceptional corrosion resistance and structural integrity. EDS examination (Fig. S14 in Supporting information) reveals only minimal quantities of Cl, Ca, and Na, thereby substantiating significant resistance to ion-induced contamination and corrosion.
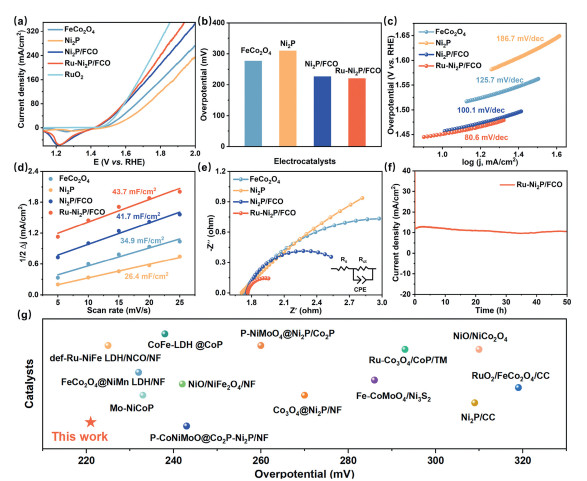
The electrocatalytic activity for the OER of the different samples was determined using a 1.0 mol/L KOH solution as the electrolyte. To verify the reliability of the OER performance assessment, the reproducibility of the electrochemical data was validated through statistical analysis, with error bars displayed in Fig. S15 (Supporting information). The LSV curve depicted in Fig. 4a indicates that Ru-Ni2P/FCO exhibits remarkable OER catalytic activity. The evident reduction peak observed in the LSV curves in the lower potential range is likely due to the reduction of Ni3+ to Ni2+ [56]. A quantitative study (Fig. 4b) illustrates that the overpotential of Ru-Ni2P/FCO was only 221 mV at 10 mA/cm2, less than Ni2P/FCO (227 mV), FeCo2O4 (277 mV), and Ni2P (310 mV). The construction of a heterojunction significantly enhances performance. The introduction of Ru further boosts the OER activity by increasing the oxidation state of the catalyst, modulating the electronic structure, and stabilizing reaction intermediates [57]. The specific activity of Ru-Ni2P/FCO and the reference electrocatalysts was examined to elucidate their inherent catalytic activity. The ECSA-normalized LSV curves are displayed (Fig. S16 in Supporting information), indicating that Ru-Ni2P/FCO exhibits exceptional catalytic efficacy per active site compared to the reference samples. The Tafel slope of Ru-Ni2P/FCO (Fig. 4c) is 80.6 mV/dec, which is lower than FeCo2O4 (125.7 mV/dec), Ni2P (186.7 mV/dec), and Ni2P/FCO (100.1 mV/dec), suggesting that Ru-Ni2P/FCO exhibits enhanced reaction kinetics throughout the OER process.
Figure 4
Figure 4.
OER performance in 1 mol/L KOH. (a) Polarization curves, (b) overpotentials, (c) Tafel slopes, (d) double-layer capacitances, (e) Nyquist plots, and (f) chronoamperometry i-t-test at potential of 1.45 V (vs. RHE) for 50 h for Ru-Ni2P/FCO. (g) Comparison of Ru-Ni2P/FCO with reported OER electrocatalysts.
The Cdl was determined via CV at different scan rates to assess the ECSA of the catalysts, as seen in Fig. S17 (Supporting information). Research has demonstrated a positive correlation between Cdl and ECSA values [58]. The calculated Cdl of Ru-Ni2P/FCO (43.7 mF/cm2) exceeds Ni2P/FCO (41.7 mF/cm2), FeCo2O4 (34.9 mF/cm2), and Ni2P (26.4 mF/cm2) (Fig. 4d). This indicates that Ru-Ni2P/FCO exhibits increased surface roughness and reveals a larger quantity of OER reactive centers. As can be observed in Fig. 4e, the charge transfer resistance (Rct) value for Ru-Ni2P/FCO is much lower than those of Ni2P/FCO, FeCo2O4, and Ni2P, indicating that the obstacles to charge transport during OER are substantially reduced by the formation of the Ru-Ni2P/FCO heterostructure. Furthermore, the stability test for as long as 50 h at a steady current density of 10 mA/cm2 was conducted, exhibiting almost no performance deterioration, which demonstrates substantial endurance (Fig. 4f).
To further assess the chemical stability of Ru-Ni2P/FCO, ICP-OES analysis was utilized to monitor metal dissolution following the OER test (Table S3 in Supporting information). The observed decline in Ru, Co, and Fe concentrations indicates an active surface evolution. This process generally involves the dissolution of surface atoms and the concurrent in-situ development of a more reactive, amorphous oxyhydroxide layer, which functions as the active catalytic phase. The crystallinity and microstructure of Ru-Ni2P/FCO after long-term stability testing was characterized using XRD and SEM techniques. Fig. S18 (Supporting information) illustrates the crystal structure of FeCo2O4 in Ru-Ni2P/FCO after stability test, which resembles its pre-test shape; nevertheless, the crystallinity of Ni2P has significantly reduced. This arises from oxygen passivation that generates surface metal oxyhydroxides during operation. These in situ-generated oxyhydroxides have been certified to be the true active species for OER [59]. As shown in the SEM image (Fig. S19 in Supporting information), the morphology of Ru-Ni2P/FCO retains its nanosheet structure after the OER test. Fig. S20 (Supporting information) presents high-resolution XPS spectra of Ru-Ni2P/FCO catalysts before and after OER testing. As shown, the reconstructed electrocatalyst exhibits a heightened Ni3+/Ni2+ peak intensity ratio relative to the pristine, indicating that Ni may be oxidized to a higher valence state. The nickel phosphide transforms into Ni(OH)2 or NiOOH, alongside complete oxidation of phosphorus to PO43-. The similar Fe 2p and Co 2p spectra for Ru-Ni2P/FCO, both before and after stability test, indicates that the FeCo2O4 composition remains stable during the DSS process. Additionally, in comparison to recently reported studies, Ru-Ni2P/FCO shows comparable OER activity (Fig. 4g and Table S4 in Supporting information).
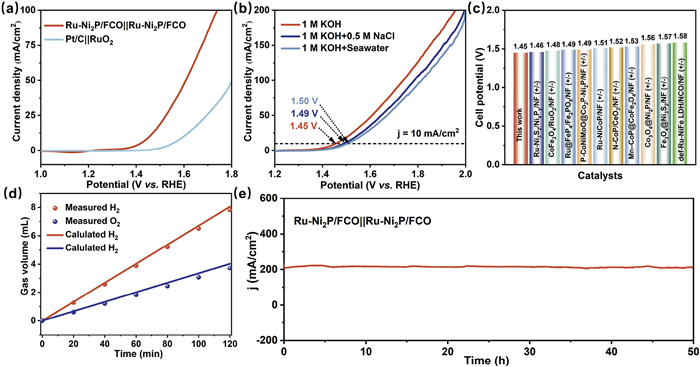
To comprehensively study the practical application of Ru-Ni2P/FCO, the electrocatalytic performance in overall water splitting was also extensively assessed. Figs. 5a and b illustrate that the Ru-Ni2P/FCO||Ru-Ni2P/FCO electrolysis system necessitates merely 1.45 V to achieve a current density of 10 mA/cm2 and 1.74 V to reach a current density of 100 mA/cm2 in a 1 mol/L KOH electrolyte, respectively. In comparison to other self-supported materials, Ru-Ni2P/FCO||Ru-Ni2P/FCO exhibits its superiority, underscoring its status as an exceptional bifunctional catalyst for H2 and O2 generation (Fig. 5c and Table S5 in Supporting information). According to the reports, the thermoneutral voltage for water electrolysis is 1.48 V [60]. An energy efficiency of approximately 102% (Table S6 in Supporting information) at 10 mA/cm2 is also provided for the Ru-Ni2P/FCO catalyst. This value exceeding 100% is likely due to the system absorbing heat from the surrounding environment under endothermic operation [61]. At a current density of 100 mA/cm2, the efficiency reaches 85%. These findings demonstrate that Ru-Ni2P/FCO shows advantageous electrocatalytic energy efficiency for water electrolysis at ambient temperature. The theoretical values are in excellent agreement with the gas production, as demonstrated in Fig. 5d. The HER Faraday efficiency is 96.7%, and the OER is 91.4% (Fig. S21 in Supporting information). Furthermore, the Ru-Ni2P/FCO electrode maintains satisfactory overall stability at 200 mA/cm2, despite a little reduction in current density (refer to Fig. 5e) following a 50 h stability test.
Figure 5
Figure 5.
(a) The polarization plots for Ru-Ni2P/FCO||Ru-Ni2P/FCO in 1.0 mol/L KOH. (b) The polarization plots of Ru-Ni2P/FCO||Ru-Ni2P/FCO in different electrolytes. M = mol/L. (c) Comparison of the cell voltage of Ru-Ni2P/FCO and previous bifunctional electrocatalysts at 10 mA/cm2 in 1 mol/L KOH. (d) Theoretical and measured gas production at different times. (e) Chronoamperometry i-t-test at potential of 2.0 V (vs. RHE) for 50 h for Ru-Ni2P/FCO.
Density-functional theory (DFT) calculations were employed to elucidate the mechanism responsible for the improvement in HER and OER performance caused by the heterogeneous interface (Ni2P/FCO) and Ru doping. The (111) plane of FeCo2O4 and the (001) plane of Ni2P were selected to construct a heterostructure. The Ru-Ni2P/FCO structure was established by replacing Ni atoms in Ni2P with Ru ones. Following structural optimization, DFT formation-energy calculations reveal that Ru substitution at the Ni1 site results in the most negative value (−1.74 eV), signifying the greatest thermodynamic stability, succeeded by Ni2 (−1.04 eV) and Ni3 (−0.63 eV). Conversely, the substitution of the Ni4 site is unfavorable, exhibiting positive formation energies of +0.30 eV (Figs. S22 and S23 in Supporting information). The Ru-substituted Ni1 site was employed for all subsequent calculations.
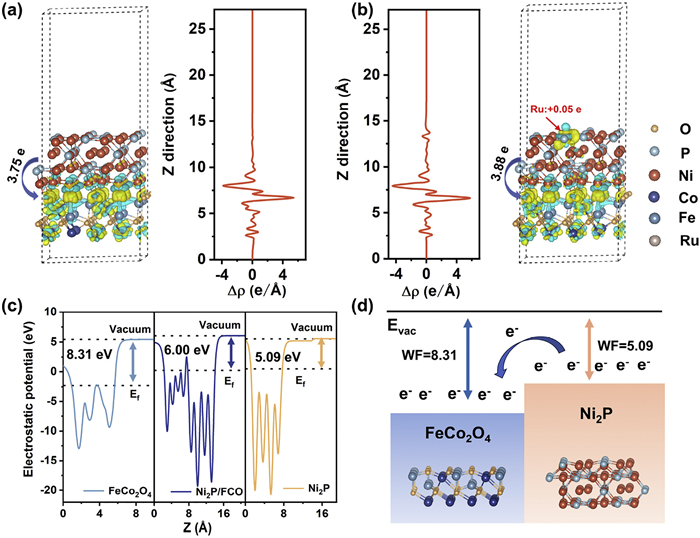
Figs. 6a and b show the charge density differences at Ni2P/FCO and Ru-Ni2P/FCO. Yellow means charge accumulation, and cyan means charge depletion. The Ni2P/FCO interface exhibits a significant increase in local charge density, indicating robust electronic interaction. According to the Bader charge analysis, the electron was transferred from Ni2P to FeCo2O4, with Ni2P and Ru-Ni2P transferring electrons at 3.8 e and 3.9 e, respectively. This indicates that the introduction of Ru promotes a shift in the electron from Ni2P to FeCo2O4. The electron was also enriched by Ru (obtained 0.05 e), resulting in an increased electron density at the Ru location. The formation of the heterojunction enables directional electron transfer from Ni2P to FeCo2O4 (the "push" effect), while Ru’s electron-withdrawing nature enhances electron density at the Ru site (the "pull" effect). According to the literature, this would produce a positive function for enhancing hydrogen adsorption strength [62]. The above results further demonstrate that the significant redistribution of charge is triggered by the doping of Ru atoms, which is consistent with the XPS results illustrated in Fig. 2. The electron escape ability and the mechanisms of electron migration are investigated through the measurement of the work function (WF) [63]. As illustrated in Fig. 6c, the WF of FeCo2O4, Ni2P, and Ni2P/FCO are 8.3, 5.1, and 6.0 eV, respectively. The lower work function of Ni2P indicates a higher Fermi energy level. This signifies that the electron can migrate from Ni2P to FeCo2O4, aiding in the formation of a stable built-in electric field to regulate the higher electronic states of the metal sites in Ni2P (Fig. 6d) [64], which is in accordance with the results of XPS and charge density difference.
Figure 6
Figure 6.
Charge density difference of (a) Ni2P/FCO, and (b) Ru-Ni2P/FCO. The yellow and blue zones contour the electron-rich and electron-deficient region, respectively. (c) Work function values of FeCo2O4, Ni2P and Ni2P/FCO. (d) The proposed charge transfer process in Ni2P/FCO.
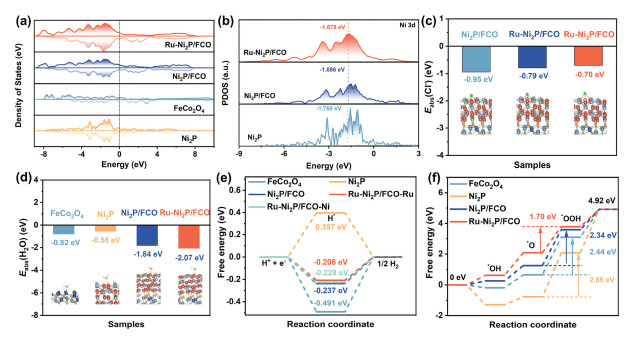
The density of states (DOS) for FeCo2O4, Ni2P, Ni2P/FCO, and Ru-Ni2P/FCO were computed to investigate the electronic structure of the catalysts (Fig. 7a). FeCo2O4 exhibits semi-metallic characteristics, while the structure becomes metallic when Ni2P is added to FeCo2O4, resulting in a larger DOS near the Fermi level. The greater carrier density of Ru-Ni2P/FCO near the Fermi level implies enhanced electron transport. This improvement is consistent with the Tafel slope and EIS assessments. Fig. S24 (Supporting information) illustrates that the density of states (DOS) at the Fermi level (Ef) predominantly originates from the 3d orbitals of Ni, suggesting that Ni is likely the primary active site. In Fig. 7b, the d-band center of Ni in Ni2P/FCO increases from −1.765 eV to −1.686 eV, which could facilitate the adsorption of oxygen intermediates [65]. Ruthenium doping further elevates the d-band center to −1.678 eV. These findings suggest that heterojunction development and Ru doping all play major roles in enhancing both HER and OER performance, which aligns with experimental results.
Figure 7
Figure 7.
(a) TDOS, (b) PDOS of Ni 3d. (c) The water adsorption free energies on catalysts. (d) The Cl- adsorption free energies on catalysts. (e) Gibbs free energy diagrams of HER. (f) Gibbs free energy diagrams of OER.
The Cl* adsorption capacity of the model was investigated before and after Ru doping. As shown in Fig. 7c, the Ni and Ru sites of Ru-Ni2P/FCO has higher ΔGCl* in comparison with that of Ni2P/FCO, indicating a diminished capacity for Cl- adsorption. The water adsorption free energy (ΔEH2O*) is a vital indicator of catalytic performance. Fig. 7d illustrates that Ru-Ni2P/FCO exhibits a much lower ΔEH2O* compared to Ni2P/FCO, Ni2P, and FeCo2O4. Ru-Ni2P/FCO exhibits the highest H2O adsorption capacity, thereby enhancing catalytic efficiency in both HER and OER. The adsorption and desorption processes reach an optimal equilibrium when the Gibbs free energy of H adsorption (ΔGH*) is zero [66]. The HER active sites were evaluated by calculating ΔGH* for different models, with the adsorption model shown in Fig. S25 (Supporting information). At the Ru and Ni sites of Ru-Ni2P/FCO, the ΔGH* values are −0.21 eV and −0.23 eV, respectively, which both are closer to zero than those of Ni2P/FCO (−0.24 eV), Ni2P (0.40 eV), and FeCo2O4 (−0.49 eV). This indicates that Ru-Ni2P/FCO has higher kinetic efficiency for HER (Fig. 7e). As a result, the adsorption efficacy of H*and the inherent activity of HER can be enhanced through the development of Ni2P/FCO heterostructures and Ru doping. The OER comprises four electron transfer phases, with the adsorption and transformation of intermediates (*OH, *O, and *OOH) at active sites being crucial. Fig. S26 (Supporting information) shows the structures optimized of *OH, *O and *OOH intermediates. Fig. 7f indicates that the heterojunction and doping did not alter the rate-limiting step, with the formation of *OOH continuing to be the pivotal rate-limiting phase of the OER. The energy barrier for *OOH generation in Ru-Ni2P/FCO is 1.70 eV, significantly lower than that of Ni2P/FCO (2.34 eV), FeCo2O4 (2.44 eV), and Ni2P (2.85 eV). This signifies that the heterostructure, in conjunction with Ru doping, optimizes the Gibbs free energy of intermediates, hence markedly improving OER activity.
In summary, a novel bifunctional electrocatalyst Ru-Ni2P/FCO/NF, exhibiting exceptional HER and OER performance, was rationally engineered by a dual-strategy approach that encompasses directed charge transfer and the modulation of the charge environment at the active sites. Experimental findings revealed that the Ru-Ni2P/FCO/NF electrode possessed low overpotentials of 16 and 41 mV for HER at a current density of 10 mA/cm2 in 1 mol/L KOH and alkaline seawater solution, which has exceeded numerous previously documented Ni-based catalysts. Meanwhile, an OER overpotential of 221 mV at 10 mA/cm2 in 1 mol/L KOH was demonstrated. A Ru-Ni2P/FCO/NF(-)||Ru-Ni2P/FCO/NF(+) full cell demonstrated remarkable stability for 50 h at 200 mA/cm2, with cell voltages required to maintain current densities of 10 and 100 mA/cm2 being 1.45 V and 1.74 V, respectively. The directed electron transfer from Ni2P to FeCo2O4, resulting from the formation of the heterojunction, along with the electron-withdrawing effect of Ru, alters the charge environment at the reactive sites. This strategy is referred to as a push-pull electron dual strategy. DFT calculations confirmed the improved kinetic efficiency for HER and the reduced Gibbs free energy of the rate-limiting step for OER. Improving electrocatalytic activity through multidimensional structural manipulation and electron transport techniques in this paper would provide valuable insights for relevant research.
The authors declare that they have no known competing financial interests or personal relationships that could have appeared to influence the work reported in this paper.
Acknowledgments
This work was supported by the National Natural Science Foundation of China (Nos. 22466011, 22165004), the Innovative Research Team for Science and Technology of Shanxi Province (No. 2022TD-04).
Supplementary materials
Supplementary material associated with this article can be found, in the online version, at doi:10.1016/j.cclet.2026.112703.
[1]
Y. Li, S. Zhang, B. Li, Y. Su, J. Kong, J. Li, ACS Nano 19 (2025) 7401–7416. doi: 10.1021/acsnano.5c00318
Figure 1
(a) Schematic diagram of synthesis Ru-Ni2P/FCO. (b) X-ray diffraction (XRD) pattern of Ni2P/FCO and Ru-Ni2P/FCO. SEM images of (c) FeCo2O4, (d) Ni2P/FCO, and (e) Ru-Ni2P/FCO. (f) TEM images of Ru-Ni2P/FCO. (g) HRTEM images of Ru-Ni2P/FCO. (h) The corresponding elemental mapping images of Ru-Ni2P/FCO.
Figure 3
(a) LSV curves, (b) overpotentials, (c) Tafel plots, (d) double-layer capacitances, (e) Nyquist plots, and (f) TOF values of Ru-Ni2P/FCO and other catalysts in 1.0 mol/L KOH for HER. (g) Polarization curves, and (h) chronoamperometry i-t-test at constant potential for 50 h of Ru-Ni2P/FCO in 1.0 mol/L KOH, 1.0 mol/L KOH + 0.5 mol/L NaCl and 1.0 mol/L KOH + seawater, respectively. (i) Comparison of the overpotential with other recently reported analogous catalysts. M = mol/L.
Figure 4
OER performance in 1 mol/L KOH. (a) Polarization curves, (b) overpotentials, (c) Tafel slopes, (d) double-layer capacitances, (e) Nyquist plots, and (f) chronoamperometry i-t-test at potential of 1.45 V (vs. RHE) for 50 h for Ru-Ni2P/FCO. (g) Comparison of Ru-Ni2P/FCO with reported OER electrocatalysts.
Figure 5
(a) The polarization plots for Ru-Ni2P/FCO||Ru-Ni2P/FCO in 1.0 mol/L KOH. (b) The polarization plots of Ru-Ni2P/FCO||Ru-Ni2P/FCO in different electrolytes. M = mol/L. (c) Comparison of the cell voltage of Ru-Ni2P/FCO and previous bifunctional electrocatalysts at 10 mA/cm2 in 1 mol/L KOH. (d) Theoretical and measured gas production at different times. (e) Chronoamperometry i-t-test at potential of 2.0 V (vs. RHE) for 50 h for Ru-Ni2P/FCO.
Figure 6
Charge density difference of (a) Ni2P/FCO, and (b) Ru-Ni2P/FCO. The yellow and blue zones contour the electron-rich and electron-deficient region, respectively. (c) Work function values of FeCo2O4, Ni2P and Ni2P/FCO. (d) The proposed charge transfer process in Ni2P/FCO.
Figure 7
(a) TDOS, (b) PDOS of Ni 3d. (c) The water adsorption free energies on catalysts. (d) The Cl- adsorption free energies on catalysts. (e) Gibbs free energy diagrams of HER. (f) Gibbs free energy diagrams of OER.


 DownLoad:

 下载:


 下载:

