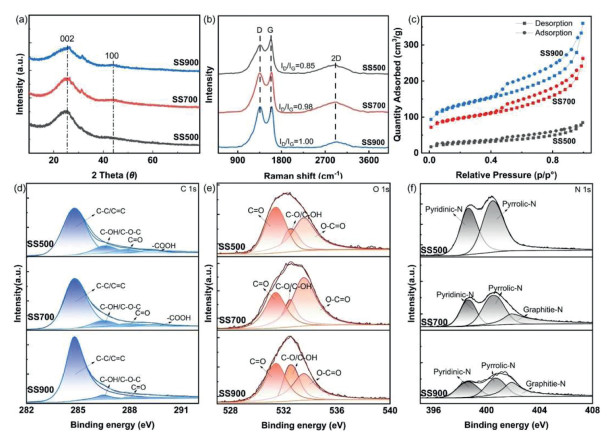
Figure 1.
Characterization of biochar. (a) XRD, (b) Raman spectra, (c) N2 adsorption-desorption curve, (d) C 1s, (e) O 1s, and (f) N 1s spectra of SS500, SS700, and SS900, respectively.

Regulating competitive co-adsorption on biochar to expedite peroxydisulfate activation and electron transfer oxidation of organic pollutants
Hongqing Zhu , Hui Ma , Ruixing Tang , Lanxin Xu , Zhiliang Zhao , Dong Yu , Joïce Rold Yannice Ibarhat Okobo , Shengyan Pu


With the rapid development of industry and agriculture, soil and groundwater organic contamination has become increasingly severe [1–4]. Especially, quantities of residual pesticides have entered soil and groundwater systems through rainwater runoff, infiltration, and agricultural irrigation [5,6]. Among these contaminants, atrazine (ATZ), as a widely used herbicide, has high ecotoxicity, environmental persistence, and bioaccumulation potential, which easily forms long-term contamination sources that pose significant risks to human health and ecological security [7]. Developing high-performance and eco-friendly remediation technologies for pesticide-polluted soil and groundwater is a critical priority [8].
Globally, biomass burning is second only to fossil fuel consumption in CO2 emissions. Incomplete combustion during these processes generates significant amounts of biochar, a solid carbonaceous byproduct [9]. The current research has shown that both intentionally produced and incidentally formed biochar migrate into contaminated groundwater. The existing reservoir of biochar presents a unique opportunity for in situ chemical oxidation compared to other artificial synthetic materials, such as carbon nanotubes and graphene oxide [10–12]. Its high specific surface area and abundant redox-active sites provide abundant functionality in organic pollutant removal by the adsorption process or catalytic activation of oxidants [13–15]. Previous studies have demonstrated that biochar effectively immobilizes ATZ in soil-groundwater systems through physical (e.g., pore filling, π-π interactions) and chemical adsorption (e.g., hydrogen bonding, electrostatic attraction) [16]. Additionally, biochar enhanced the ATZ degradation via activating persulfate (e.g., PDS) based in situ chemical oxidation processes [17]. The activation mechanism in the biochar/PDS system is usually a radical or nonradical oxidant process [18–20]. For example, catalytic generation of radicals such as SO4•-, •OH, and O2•- through surface-active sites, including persistent free radicals (PFRs) [21] or oxygen-containing functional groups (e.g., C=O, -OH, -COOH). Alternatively, biochar can act as an electron mediator, facilitating electron transfer between PDS and pollutants by its surface C=O and -OH groups and internal graphitic carbon structures, promoting PDS activation and pollutant oxidation [22,23].
In the actual reaction process, the adsorption and oxidation processes of pollutants in biochar-activated PDS systems commonly occur on surfaces [24,25]. Clarifying the fundamental mechanisms governing adsorption and degradation processes has consistently been recognized as important for improving remediation efficacy [12]. Current research has identified that the enrichment of pollutants or PDS is equally important for enhancing remediation efficiency in heterogeneous reaction systems. Zeng et al. [26] identified that the pollutant adsorption on biochar was required to accelerate the subsequent degradation. Liu et al. [27] found that PDS adsorption on biochar could increase the activation efficiency. Moreover, the electron transfer oxidation usually occurs only when both PDS and pollutants are simultaneously adsorbed on the biochar interface [28]. However, most studies seldom consider the competitive role between PDS and pollutants on biochar. Competitive adsorption might both enhance the overall catalytic degradation efficiency and induce a redistribution of pollutants at the biochar interface. This uncertainty could result in the underestimation of how PDS might simultaneously regulate pollutant adsorption behavior or the contribution of the oxidation pathway. Therefore, accurately quantifying the impact of adsorption on degradation processes is a key challenge for reliably evaluating the remediation performance of biochar/PDS-based in situ chemical oxidation technologies.
Pyrolysis temperature and biomass are critical factors regulating the adsorption and catalysis activity of biochar [29,30]. Shrimp shells (SS) with abundance and high nitrogen content promote favorable porosity for adsorption and electron-transfer oxidation [30]. Thus, this study aims to utilize shrimp shell (SS) waste as biomass to prepare and optimize the properties of biochar under varying pyrolysis temperatures: (ⅰ) To clarify the adsorption and catalytic properties of biochar tuned by pyrolysis temperature, (ⅱ) to quantitatively analyze the competitive adsorption and degradation processes in the biochar/PDS system, and (ⅲ) to reveal the interfacial electron transfer oxidation mechanism driven by the co-adsorption of PDS and the pollutant.
Details of the chemicals, biochar preparation method, and associated characterization techniques are provided in Supporting information.
The comprehensive characterization techniques were employed to analyze the physicochemical properties of biochar. X-ray diffraction analysis (XRD) results (Fig. 1a) revealed two broad diffraction peaks in biochar pyrolyzed at different temperatures [31]. The peaks at 2θ = 25.48° and 43.98° correspond to the (002) and (100) planes of graphitic carbon formed during organic component carbonization. With increasing pyrolysis temperature, the (002) peak of SS900 exhibited broadening and reduced intensity, indicating decreased long-range order in the carbon layer stacking. Additionally, a minor peak at 2θ = 31.52° suggested the potential presence of trace silica crystals in the biochar. Raman spectra (Fig. 1b) displayed characteristic D-band (~1350 cm-1), G-band (~1620 cm-1), and 2D-band (2640 cm-1) signals [32], corresponding to structural defects and graphitization degree, respectively. The ID/IG intensity ratio of the different biochars was 0.85 (SS500), 0.98 (SS700), and 1.00 (SS900), respectively, which implied enhanced structural defects. Concurrently, the 2D peak at 2640 cm-1 in SS900 became narrower than SS700 and SS500, which implied an enhancement in the graphitic character of the carbon matrix at higher pyrolysis temperatures. Furthermore, the FTIR analysis (Fig. S1 in Supporting information) corroborated the structural evolution, showing a gradual attenuation of oxygen-containing functional group signals (e.g., C–OH, C=O) with increasing pyrolysis temperature, consistent with the carbonization and structural evolution indicated by XRD and Raman results.
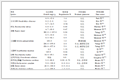
Scanning electron microscope (SEM) images showed biochar pyrolyzed at 900 ℃ had more obvious pore structure characteristics than 500 ℃ and 700 ℃, respectively (Fig. S2 in Supporting information). Moreover, the specific surface area estimation using the Brunauer-Emmett-Teller (SBET) of SS900 (467.30 m2/g) was significantly increased compared to SS500 (94.92 m2/g) and SS700 (343.94 m2/g) (Fig. 1c). This enhancement could be attributed to the intensified devolatilization during high-temperature pyrolysis, which facilitated the development of porous structures and the expansion of specific surface area [10]. Notably, as shrimp shells are rich in nitrogen (N) elements [33], the N-containing components in biomass were easily thermally decomposed to volatile gases at high temperatures [30]. X-ray photoelectron spectroscopy (XPS) analysis revealed an obvious decrease in N element content within the carbon matrix with increasing pyrolysis temperatures, with N contents of 20.28% in SS500, 12.64% in SS700, and 4.92% in SS900 (Table 1). The significant loss of nitrogen suggested that the thermal decomposition of nitrogen-containing compounds actively contributes to pore formation, resulting in the higher SBET in SS900. XPS analysis was further employed to characterize the surface elemental composition and chemical states of the biochar. As illustrated in Fig. 1d, the C 1s spectrum of SS500 could be deconvoluted into four peaks at 284.80, 286.58, 287.81, and 289.28 eV, corresponding to C–C/C=C, C–OH/C–O-C, C=O/O—C-O, and -COOH functional groups, respectively [34]. Compared with SS500 (78.37%) and SS700 (77.85%), SS900 exhibited higher C–C/C=C ratios, indicating enhanced aromaticity and graphitization with increasing pyrolysis temperatures, which was conducive to improved electrical conductivity. The O 1s spectrum (Fig. 1e) included the peaks of C=O (531.40 eV), O—C=O (532.48 eV), and C–OH (533.50 eV). The proportion of C=O groups increased from 5.92% (SS500) to 8.39% (SS900). Deconvolution of the N 1s spectra revealed peaks at 398.3, 399.9, and 400.7 eV, assigned to pyridinic N, pyrrolic N, and graphitic N, respectively (Fig. 1f) [35]. As the pyrolysis temperature increased from 500 ℃ to 900 ℃, the contents of graphitic N and pyridinic N increased significantly, while pyrrolic N signals diminished. Pyridinic and graphitic N species are recognized as critical active sites for mediating electron transfer and facilitating non-radical activation of PDS. Mediated electrochemical characterization quantified the electron-accepting capacity (EAC) and electron-donating capacity (EDC) as 1.32/0.50, 1.48/0.24, and 1.61/0.12 mmol e- (g char) −1 for SS500, SS700, and SS900, respectively (Fig. S3 in Supporting information). The progressive increase in EAC and decrease in EDC with pyrolysis temperature suggested a rise in oxidized functional groups and a decline in reduced moieties, which are consistent with XPS observations. These findings demonstrated that the specific surface areas, graphitization degree, and electron transfer mediation capability were strategically modulated by changing the pyrolysis temperature of biochar.
 DownLoad:
CSV
| Biochar | SS500 | SS700 | SS900 | |
| SBET(m2/g) | 94.92 | 343.94 | 467.30 | |
| ID/IG | 0.85 | 0.98 | 1.00 | |
| C 1s | at% | 74.42 | 81.25 | 87.11 |
| C-C/C=C | 78.37 | 77.85 | 84.96 | |
| C–OH/C–O-C | 11.33 | 9.14 | 5.01 | |
| C=O/O–C-O | 5.92 | 8.7 | 8.39 | |
| -COOH | 4.38 | 4.31 | 1.64 | |
| O 1s | at% | 5.3 | 6.1 | 7.98 |
| C=O | 42.42 | 29.22 | 36.85 | |
| C-OH/C-O | 41.94 | 50.9 | 37.36 | |
| O-C=O | 15.64 | 19.11 | 25.79 | |
| N 1s | at% | 20.28 | 12.64 | 4.92 |
| Pyridinic N | 53.69 | 29.32 | 29.8 | |
| Pyrrolic N | 46.31 | 43.93 | 33.44 | |
| Graphitic N | / | 26.75 | 36.77 | |
The adsorption behavior of ATZ on biochar samples (SS500, SS700, and SS900) was systematically evaluated via adsorption isotherm and kinetic fitting (Fig. 2). The experimental data of the adsorption isotherm were fitted using the Langmuir and the Freundlich isotherm models (Fig. 2a) [36], with fitting parameters shown in Table S1 (Supporting information). The adsorption capacity of biochar for ATZ was significantly enhanced with increasing pyrolysis temperatures, and the maximum adsorption capacities (Qm) of 17.48, 28.97, and 86.93 mg/g for SS500, SS700, and SS900, respectively. Based on the above characterization results, the superior adsorption performance of SS900 for ATZ mainly originated from its high specific surface area and graphitic structure [12]. The Langmuir and Freundlich models exhibited high fitting accuracy (R2 > 0.98) for ATZ adsorption on different biochar samples. However, the Langmuir-derived Qm demonstrated closer agreement with experimental data (Qexp, 14.68, 27.45, 66.99 mg/g) than the Freundlich model, suggesting monolayer adsorption dominates the ATZ adsorption process on biochar surfaces.
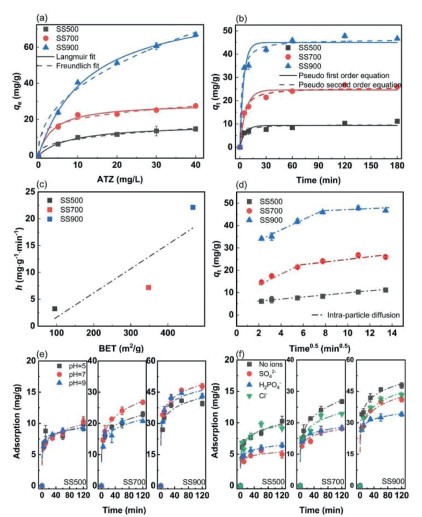
In the adsorption kinetic experiments (Fig. 2b), the adsorption capacity of biochar samples for ATZ increased rapidly within 60 min and gradually reached equilibrium. After 120 min of reaction under an initial ATZ concentration of 10 mg/L, the adsorption removal efficiency of ATZ by SS900 reached 97.19%, which was 2.0-fold and 3.69-fold higher than those of SS700 and SS500, respectively. Moreover, the adsorption rates of ATZ on SS900 (22.12 mg g-1 min-1) were faster than SS700 (7.19 mg g-1 min-1) and SS500 (3.23 mg g-1 min-1), respectively, which further demonstrated that SS900 exhibits the optimal adsorption performance towards ATZ (Fig. 2c and Table S2 in Supporting information). As shown in Table S2, the adsorption process for ATZ on SS500 aligned more closely with the pseudo-second-order model (R2 > 0.983), suggesting a chemisorption-dominated interaction between ATZ and SS500. For SS700 and SS900, the pseudo-first-order and the pseudo-second-order models exhibited high fitting accuracy (R2 > 0.93). However, the pseudo-second-order-derived calculated equilibrium adsorption capacity (Qe, cal) showed better agreement with experimental values (Qe, exp). To further investigate the adsorption mechanism, anhydrous ethanol was used as an eluent to desorb ATZ from the biochar surface. The results showed that ATZ adsorbed on biochar could be almost completely recovered, indicating that the adsorption process is highly reversible and dominated by weak interactions, such as π-π interactions, van der Waals forces, or hydrogen bonding [37]. Furthermore, intra-particle diffusion modeling (Fig. 2d) was employed to identify the rate-controlling step [37]. The bilinear fitting for SS700 and SS900 suggested a multi-step adsorption process. An initial rapid adsorption phase within larger internal voids (first fitted line), followed by a slower diffusion-controlled stage as pore channels narrowed, ultimately approaching equilibrium (second fitted line) [38]. This observation correlated well with SEM characterization, where SS700 and SS900 displayed abundant porous structures, whereas SS500 exhibited a smoother surface with limited internal porosity, without a secondary rate-limiting step. The above results identified the critical role of pyrolysis temperature in optimizing biochar for environmental remediation, where enhanced adsorption capacity and rapid pollutant removal are essential for practical applications.
To further investigate the adsorption stability of ATZ on biochar, the removal efficacy of ATZ by SS500, SS700, and SS900 was examined in different initial pH conditions. As shown in Fig. 2e, all biochar samples exhibited optimal adsorption performance at neutral pH 7.0. When pH decreased from 7 to 5, the adsorption capacities of SS700 and SS900 declined from 26.76 mg/g and 47.80 mg/g (pH 7) to 22.95 mg/g and 39.53 mg/g (pH 5), respectively. Although the zeta potential of SS700 and SS900 was positive at pH 5 (Fig. S4 in Supporting information) and theoretically could enhance electrostatic attraction with ATZ (pKa = 1.7), the observed adsorption capacity was decreased, which may be attributed to competitive adsorption of H+ and diminished activity of surface functional groups under acidic conditions [39]. Additionally, the adsorption capacity of ATZ on biochar surfaces decreased when the solution contained anions such as SO42-, H2PO4-, and Cl- (Fig. 2f), with H2PO4- exhibiting more pronounced inhibitory effects. This finding suggested that complex environmental matrices may competitively occupy electrostatic adsorption sites on biochar surfaces [40]. Notably, these competitive adsorption effects were equally relevant in PDS-based ISCO systems. PDS, as an ionic oxidant, may exhibit competitive adsorption similar to common anions. Its influence on ATZ adsorption and degradation will be discussed in the following section.
Previous studies have demonstrated that persistent free radicals (PFRs) can directly oxidize and degrade organic pollutants [21]. As shown in Fig. S5 (Supporting information), the intensity of PFRs on biochar surfaces progressively decreased with increasing pyrolysis temperatures. Although defect-related vacancies can also give EPR signals, the observed g ≈ 2.003 single peak was consistent with carbon-centered PFRs [21,41]. Adsorption-desorption experiments revealed negligible ATZ degradation in biochar/pollutant systems without PDS, regardless of pyrolysis temperature (Fig. 3a). To enhance the degradation of ATZ, PDS was introduced into the system, the results showed the total ATZ degradation rates in SS500/PDS, SS700/PDS, and SS900/PDS systems reached 11.09%, 39.56%, and 76.42%, respectively, with degradation contributing 35.45%, 73.31%, and 83.21% to the total removal after reaction 7 h. PDS decomposition efficiency (21.2%) in the SS900 system was higher than that in the SS500 (6.7%) and SS700 (9.8%) systems, respectively. ATZ degradation kinetics (Fig. S6 in Supporting information) adhered to pseudo-first-order behavior, with SS900 exhibiting a rate constant (kobs) of 0.1998 h-1, which was 21.81-fold higher than SS500 (0.00916 h-1). Based on the total organic carbon (TOC) analysis results, only the SS900/PDS system achieved marked ATZ mineralization after reaction for 7 h compared to the SS500/PDS and SS700/PDS systems (Fig. 3b). Correlation analysis between specific surface area and ln kobs (Fig. S7 in Supporting information) revealed a strong linear relationship (R2 = 0.9878), identifying the pivotal role of adsorption capacity in PDS activation and ATZ degradation. These results showed that the higher adsorption capacity of biochar is particularly effective for the synergistic mineralization of organic pollutants when coupled with PDS.
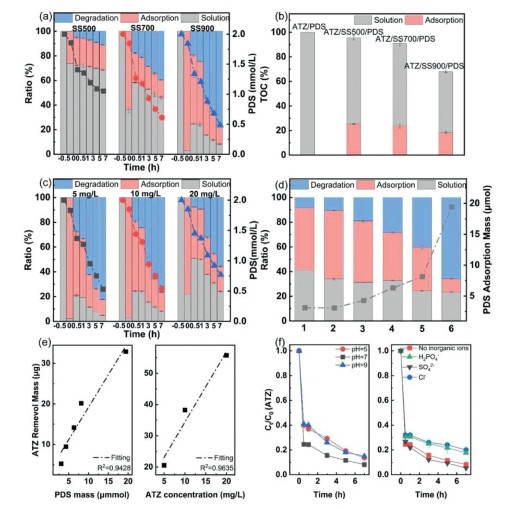
To reveal the critical role of adsorption in SS900/PDS systems for ATZ degradation, the impacts of varying ATZ and PDS adsorption mass on ATZ degradation efficiency were examined. When the initial ATZ concentration increased from 5 mg/L to 20 mg/L (Figs. 3c and e), the degradation amounts reached 20.56, 38.21, and 55.73 μg, respectively, and they exhibited a positive correlation with the initial concentration (R2 = 0.9635). Furthermore, as PDS adsorption mass on SS900 increased, the ATZ removal efficacy also increased (Figs. 3d and e). A strong correlation (R2 = 0.9428) was observed between PDS adsorption and ATZ removal, indicating that higher PDS adsorption on biochar surfaces enhances ATZ degradation efficiency.
Furthermore, adsorption-desorption experiments revealed that the concentration of ATZ in solution increased from 2.81% to 24.5% after introducing PDS to the SS900/biochar system following adsorption equilibrium (Fig. 3a). This phenomenon might originate from competitive electrostatic adsorption between PDS and ATZ for active sites on the biochar surface, leading to partial desorption of ATZ into the solution. Importantly, the competitive effect can be effectively mitigated with the simultaneous addition of ATZ and PDS. Coexist PDS and ATZ could rapidly establish a dynamic co-adsorption equilibrium, enabling more direct interfacial degradation (Fig. S8 in Supporting information). Subsequently, the critical impact of competitive adsorption was further corroborated by modulating pH or inorganic ions (e.g., H2PO4-, Cl-) (Fig. 3f, Figs. S9a and b in Supporting information). The highest ATZ degradation efficiency was observed at pH 7, likely correlating with the maximum ATZ adsorption capacity on SS900 at pH 7. Conversely, degradation efficiencies declined to 56.38% and 59.36% in the presence of H2PO4- and Cl-, respectively, which was attributable to significant inhibition of PDS adsorption on SS900 (Figs. S9c and d in Supporting information). These results demonstrated that the co-adsorption of ATZ and PDS on biochar is a critical determinant of improving degradation efficacy.
To further assess the applicability of the SS900/biochar system, recycling tests under adsorption-only and catalytic PDS activation conditions were conducted. SS900 exhibited stable reusability in adsorption with consistent ATZ removal, while catalytic performance declined noticeably, likely due to consumption and alteration of active sites during PDS activation (Fig. S10 in Supporting information). The system also efficiently degraded other triazine herbicides (e.g., ametryn and simazine), the degradation efficiency is correlated to molecular structure (Fig. S11 in Supporting information). These results affirmed the potential of the biochar/PDS system for triazine herbicide degradation, though long-term catalytic stability requires further enhancement.
To identify the main active species in the SS900/PDS system, methanol (MeOH) and furfuryl alcohol (FFA) were selected as quenching agents for SO4•-/•OH and 1O2 [20,42,43], respectively. The results showed (Fig. 4a) that no significant changes in ATZ degradation efficiency were observed after adding MeOH, suggesting minimal contributions from SO4•-/•OH. FFA introduction reduced ATZ degradation efficiency from 76.42% to 59.06%. However, the desorption experiment results revealed that FFA decreased ATZ adsorption on SS900, implying that the observed reduction originated from competitive adsorption of FFA rather than 1O2 quenching.
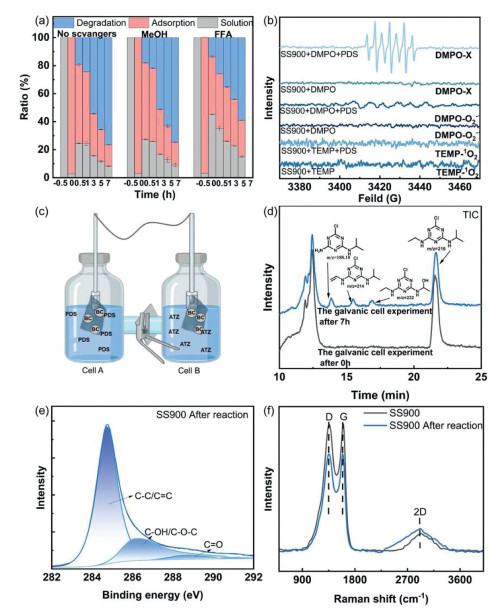
EPR analysis (Fig. 4b) detected distinct DMPO-X adducts and weak O2•- signals. CCl4 employed as an O2•- probe showed its concentration was not decreased, indicating negligible O2•- involvement in degradation (Fig. S12 in Supporting information). Previous studies have shown that DMPO-X was generated, and nonradical oxidation occurred between the activated PDS and adsorbed organics via electron transfer on the biochar [17]. Subsequently, a galvanic cell experiment was conducted using SS900-coated carbon paper as the electrode (Figs. 4c and d). After reaction for 7 h, HPLC-MS analysis identified the generated ATZ (m/z = 216) degraded intermediates (m/z = 188, 214, and 232) by deethylated and dehydrogenated processes in cell B (Fig. S13 in Supporting information) [44]. The above results confirmed that ATZ removal predominantly occurred via direct electron transfer among SS900, PDS, and ATZ.
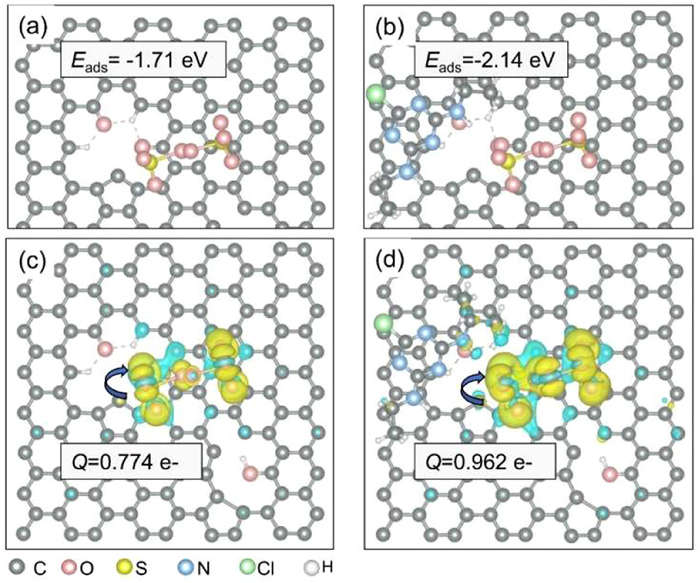
To investigate the mechanism of ATZ removal in the SS900/PDS system, XPS and Raman analysis results were performed on SS900 after the reaction. XPS results (Fig. 4e) indicated a significant conversion of C=O groups to C–OH, with the C–OH content increasing to 24.17% on biochar after activating PDS. Raman spectroscopy (Fig. 4f) revealed an elevated ID/IG ratio (1.05) and broadening of the 2D band in post-reaction SS900, likely originating from increased C–OH content in the carbon structure, consistent with XPS observations. Moreover, density functional theory (DFT) calculations revealed that ATZ exhibited a pronounced preference for adsorption onto the C=O groups of the biochar surface (Eads = −0.66 eV), compared to the C–OH groups (Eads = −0.52 eV) (Fig. S14 in Supporting information). The adsorption of ATZ on biochar increased the adsorption energy of PDS on biochar from −1.71 eV to −2.14 eV (Figs. 5a and b). Electron density difference analysis identified the interfacial electron transfer from biochar to PDS, with the ATZ/biochar/PDS complex demonstrating significantly higher electron transfer numbers (0.962 e-) compared to its ATZ-free counterpart (0.774 e-) (Figs. 5c and d). These results indicated that the co-adsorption of ATZ and PDS on biochar was more conducive to the electron-transfer oxidation of ATZ, which primarily depends on the C=O groups and graphitic structures of the biochar surface.
Based on these findings, the competitive co-adsorption between PDS and ATZ fundamentally regulated their interfacial distribution and electron transfer on biochar. The induced ATZ degradation mechanism in the SS900/PDS system is proposed to involve two synergistic processes (Scheme 1). One is the functional groups-mediated electron transfer oxidation process. ATZ first concentrated on the C=O sites of the biochar surface by physical/chemical adsorption. These C=O groups then act as the primary redox-active centers, extracting electrons from ATZ to PDS, thereby mediating ATZ oxidative degradation. Another is the direct electron transfer oxidation, which relies on the highly graphitized and conductive carbon matrix of the biochar. In this pathway, biochar serves as an electron-conducting matrix, facilitating direct electron transfer from ATZ to PDS.
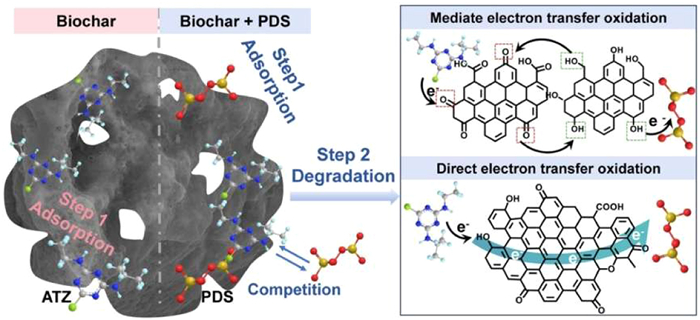
This study systematically elucidated the adsorption-degradation process in biochar/PDS systems for efficient ATZ removal, advancing the mechanistic understanding of competitive co-adsorption-driven interfacial oxidation pathways. SS900 exhibited the highest ATZ adsorption capacity (86.93 mg/g) and rapid adsorption kinetics (22.12 mg g-1 min-1). Pore structure and surface functional groups were identified as key drivers for adsorbing ATZ. In the presence of PDS, competition adsorption by PDS first redistributes ATZ at the biochar interface and further triggers a shift from an adsorption-dominated pathway to an ETO-dominated pathway. Adsorption-desorption experiments demonstrated that PDS adsorption mass and ATZ initial concentration directly influenced degradation efficiency. A sufficient PDS dosage is essential to ensure a transition from adsorption-dominated to degradation-dominated removal of ATZ. Characterization results revealed C=O groups and a high graphitic degree facilitated electron transfer from ATZ to PDS, as quantitatively confirmed by DFT calculations. EPR, quenching experiments, galvanic cell experiments, and LC-MS methods excluded SO4•-, •OH, and 1O2 contributions, confirming that electron transfer oxidation is the dominant degradation pathway for ATZ. These findings advance the mechanistic understanding of biochar-mediated pollutant removal and provide actionable strategies for reliably evaluating the remediation performance of biochar/PDS-based in situ chemical oxidation technologies.
Hongqing Zhu: Writing – original draft, Visualization, Validation, Methodology, Investigation, Formal analysis, Conceptualization. Hui Ma: Supervision, Conceptualization. Ruixing Tang: Methodology, Investigation. Lanxin Xu: Visualization, Methodology. Zhiliang Zhao: Software, Data curation. Dong Yu: Writing – original draft. Joïce Rold Yannice Ibarhat Okobo: Methodology. Shengyan Pu: Writing – review & editing, Supervision, Funding acquisition, Conceptualization.
The authors declare that they have no known competing financial interests or personal relationships that could have appeared to influence the work reported in this paper.
This research was supported by the National Natural Science Foundation of China (Nos. 42625705, U22A20591, 42077185), the National Key Research and Development Program of China (No. 2024YFC3712700), and the Research Fund of State Key Laboratory of Geohazard Prevention and Geoenvironment Protection (No. SKLGP2020Z002).
Supplementary material associated with this article can be found, in the online version, at doi:
X. Kuang, J. Liu, B.R. Scanlon, et al., Science 383 (2024) eadf0630. doi: 10.1126/science.adf0630
J. Qiu, Nature 466 (2010) 308. doi: 10.1038/466308a
S. Pu, S. Xue, Z. Yang, et al., Environ. Sci. Pollut. R. 25 (2018) 17310–17320. doi: 10.1007/s11356-018-1872-y
G. Hou, X. Zhao, T. Zhao, et al., Chem. Eng. J. 473 (2023) 145157. doi: 10.1016/j.cej.2023.145157
N.K. Singh, G. Sanghvi, M. Yadav, et al., Environ. Res. 237 (2023) 117100. doi: 10.1016/j.envres.2023.117100
P.K. Ghosh, L. Philip, Water Res. 38 (2004) 2277–2284. doi: 10.1016/j.watres.2003.10.059
J. Riedo, D. Wächter, A. Gubler, et al., Environ. Pollut. 331 (2023) 121892. doi: 10.1016/j.envpol.2023.121892
A. Sarker, W.S. Shin, M.A. Masud, et al., Environ. Pollut. 341 (2024) 122940. doi: 10.1016/j.envpol.2023.122940
Z. Chang, G. Shen, K. Jiang, et al., Carbon Res. 3 (2024) 1–23. doi: 10.3390/s25010001
P. Zhang, W. Duan, H. Peng, et al., ACS Environ. Au 2 (2022) 115–127. doi: 10.1021/acsenvironau.1c00032
Y. Zhao, H. Wang, Langmuir 37 (2021) 13969–13975. doi: 10.1021/acs.langmuir.1c02755
Z. Jin, S. Xiao, H. Dong, et al., J. Hazard. Mater. 422 (2022) 126928. doi: 10.1016/j.jhazmat.2021.126928
S. Haghighi Mood, M.R. Pelaez Samaniego, et al., Energy Fuels 36 (2022) 7940–7986. doi: 10.1021/acs.energyfuels.2c01201
M.M. Bello, A.A. Abdul Raman, Environ. Chem. Lett. 17 (2019) 1125–1142. doi: 10.1007/s10311-018-00842-0
Y. Huang, L. Yu, K. Chen, et al., Chin. Chem. Lett. 35 (2024) 109437. doi: 10.1016/j.cclet.2023.109437
Y. Ma, R. Wang, C. Gao, et al., J. Colloid. Interface Sci. 640 (2023) 761–774. doi: 10.1016/j.jcis.2023.03.001
J. Dou, Y. Tang, Z. Lu, et al., Environ. Sci. Technol. 57 (2023) 5703–5713. doi: 10.1021/acs.est.3c00022
Y. Li, Z. Wu, X. Liu, et al., Chin. Chem. Lett. 37 (2026) 111627. doi: 10.1016/j.cclet.2025.111627
J. Liu, Q. Lu, L. Di, et al., Chin. Chem. Lett. 34 (2023) 108357. doi: 10.1016/j.cclet.2023.108357
X. Miao, X. Chen, W. Wu, et al., Biochar 5 (2023) 40. doi: 10.1007/s42773-023-00243-9
G. Fang, C. Liu, J. Gao, et al., Environ. Sci. Technol. 49 (2015) 5645–5653. doi: 10.1021/es5061512
T. Sun, D. Levin, J. Guzman, Nat. Commun. 8 (2017) 14873. doi: 10.1038/ncomms14873
P. Zhang, M. Sun, C. Zhou, et al., Environ. Sci. Technol. 58 (2024) 4781–4791. doi: 10.1021/acs.est.3c06252
S. Liu, D. Jassby, D. Mandler, et al., Nat. Commun. 15 (2024) 9524. doi: 10.1038/s41467-024-52730-7
B. Liu, W. Guo, H. Wang, et al., J. Hazard. Mater. 398 (2020) 122768. doi: 10.1016/j.jhazmat.2020.122768
L. Zeng, Q. Chen, N. Liang, et al., J. Hazard. Mater. 458 (2023) 131774. doi: 10.1016/j.jhazmat.2023.131774
B. Liu, W. Guo, H. Wang, et al., Chem. Eng. J. 396 (2020) 125119. doi: 10.1016/j.cej.2020.125119
W. Ren, C. Cheng, P. Shao, et al., Environ. Sci. Technol. 56 (2022) 78–97. doi: 10.1021/acs.est.1c05374
H. Zhu, H. Ma, Z. Zhao, et al., J. Hazard. Mater. 486 (2025) 136825. doi: 10.1016/j.jhazmat.2024.136825
S. Pei, Y. Zhao, W. LI, et al., Chem. Eng. J. 477 (2023) 147274. doi: 10.1016/j.cej.2023.147274
X. Zhou, Z. Zeng, G. Zeng, et al., Chem. Eng. J. 401 (2020) 126127. doi: 10.1016/j.cej.2020.126127
S. Zhu, C. Jin, X. Duan, et al., Chem. Eng. J. 393 (2020) 124725. doi: 10.1016/j.cej.2020.124725
J. Qu, S. Lv, X. Peng, et al., J. Alloy. Compd. 671 (2016) 17–23. doi: 10.1016/j.jallcom.2016.02.064
S. Wang, Y. Huang, S. Ma, et al., Biochar 5 (2023) 24. doi: 10.1007/s42773-023-00223-z
Z. Wan, Z. Xu, Y. Sun, et al., Environ. Sci. Technol. 55 (2021) 7004–7014. doi: 10.1021/acs.est.0c08531
C. Liu, N. Bolan, A. Upamali Rajapaksha, et al., Chin. Chem. Lett. 36 (2025) 109960. doi: 10.1016/j.cclet.2024.109960
Y. Cheng, B. Wang, J. Shen, J. Hazard. Mater. 432 (2022) 128757. doi: 10.1016/j.jhazmat.2022.128757
M. El Khaiary, G. Malash, Hydrometallurgy 105 (2011) 314–320. doi: 10.1016/j.hydromet.2010.11.005
Y. Cao, L. Wang, X. Kang, et al., Environ. Pollut. 317 (2023) 120832. doi: 10.1016/j.envpol.2022.120832
X. Tan, S. Zhu, R. Wang, et al., Chin. Chem. Lett. 32 (2021) 2939–2946. doi: 10.1016/j.cclet.2021.04.059
W. Wu, S. Zhu, X. Huang, et al., Environ. Sci. Technol. 55 (2021) 7690–7701. doi: 10.1021/acs.est.1c01882
L. Zhang, Y. Liu, G. Zeng, et al., Sep. Purif. Technol. 306 (2023) 122677. doi: 10.1016/j.seppur.2022.122677
L. Xie, P. Wang, Y. Li, et al., Nat. Commun. 13 (2022) 5560. doi: 10.1038/s41467-022-33149-4
Y. Feng, M. Wang, Q. Meng, et al., Colloid. Surface A 694 (2024) 134229. doi: 10.1016/j.colsurfa.2024.134229

Figure 1 Characterization of biochar. (a) XRD, (b) Raman spectra, (c) N2 adsorption-desorption curve, (d) C 1s, (e) O 1s, and (f) N 1s spectra of SS500, SS700, and SS900, respectively.

Figure 2 The adsorption behavior of ATZ on biochar samples (SS500, SS700, and SS900, respectively). (a) The adsorption isotherm and Langmuir and the Freundlich isotherm models fitted curves. (b) The adsorption kinetics, the pseudo-first-order, and the pseudo-second-order models fitted curves. (c) The adsorption rates of ATZ on different biochars. (d) Intra-particle diffusion model fitted bilinear. (e) The effect of pH, and (f) inorganic ions on the adsorption performance.

Figure 3 Synergistic performance of adsorption and degradation. (a, b) The adsorption and degradation efficacy of ATZ, the decomposition mass of PDS, and total organic carbon (TOC) decreased in biochar (SS500, SS700, and SS900)/PDS systems. The impacts of varying (c) ATZ initial concentrations and (d) PDS adsorption mass on ATZ degradation efficiency in the SS900/PDS system. (e) Correlation of ATZ removal mass to PDS adsorption mass or ATZ initial concentration. (f) The effect of pH and inorganic ions on degradation performance.

Figure 4 Active species and catalytic degradation mechanism. (a) The quenching experiments were performed using different quenchers in the SS900/PDS system. (b) The EPR spectra of the SS900/PDS or SS900 system. (c) Schematic diagram of a galvanic cell experiment, which includes two cells (cell A and cell B), partitioned by a proton-exchange membrane. Each cell housed an SS900-modified carbon paper electrode submerged in an electrolyte solution, with electrical continuity established via conductive wiring. Cell A was charged with 2 mmol/L PDS, whereas cell B contained 10 mg/L ATZ. (d) The total ion current (TIC) spectra of ATZ and its degradation products were analyzed after reaction for 7 h in a dual-chamber electrochemical system. (e) C 1s spectra and (f) Raman spectra of SS900 after reaction for 7 h, respectively.

Figure 5 DFT theoretical calculation results. The simulated adsorption energy of PDS on biochar and the electron transfer number between PDS and biochar (yellow and blue represent electron accumulation and loss, respectively) without (a, c)/with ATZ (b, d).
Table 1. SBET, ID/IG values, and the surface elemental and chemical states of biochar.
| Biochar | SS500 | SS700 | SS900 | |
| SBET(m2/g) | 94.92 | 343.94 | 467.30 | |
| ID/IG | 0.85 | 0.98 | 1.00 | |
| C 1s | at% | 74.42 | 81.25 | 87.11 |
| C-C/C=C | 78.37 | 77.85 | 84.96 | |
| C–OH/C–O-C | 11.33 | 9.14 | 5.01 | |
| C=O/O–C-O | 5.92 | 8.7 | 8.39 | |
| -COOH | 4.38 | 4.31 | 1.64 | |
| O 1s | at% | 5.3 | 6.1 | 7.98 |
| C=O | 42.42 | 29.22 | 36.85 | |
| C-OH/C-O | 41.94 | 50.9 | 37.36 | |
| O-C=O | 15.64 | 19.11 | 25.79 | |
| N 1s | at% | 20.28 | 12.64 | 4.92 |
| Pyridinic N | 53.69 | 29.32 | 29.8 | |
| Pyrrolic N | 46.31 | 43.93 | 33.44 | |
| Graphitic N | / | 26.75 | 36.77 | |
 下载: 导出CSV

 扫一扫看文章


扫一扫关注我们

 下载: