Figure 1.
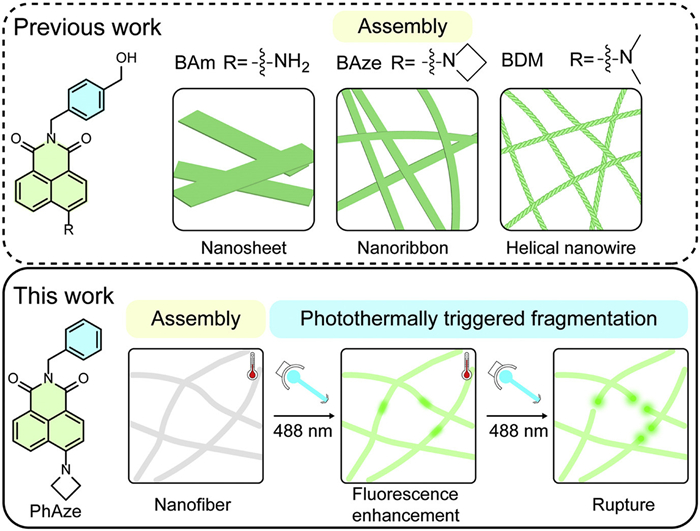
Previous work: Effect of amino substituents on the morphology of the assembly and a schematic diagram of the photothermal rupture of PhAze nanofibers in this work.
In situ real-time imaging of photothermal-induced rupture of self-assembled naphthalimide nanofibers
Yinchan Zhang , Wenting Yin , Guoli Han , Yiyan Ruan , Qinglong Qiao , Zhaochao Xu

Molecular assemblies are ordered structures formed via dynamic noncovalent interactions such as hydrogen bonding and π–π stacking [1,2], which enable their response to various stimuli, thereby exhibiting broad application prospects in fields such as sensing [3], actuation [4], and biomedicine [5–7]. Among these stimuli, light stands out for its remote controllability, noninvasiveness, and high spatiotemporal resolution, offering unique capabilities for precisely controlling the properties of molecules and assemblies [8,9]. Most photoresponsive supramolecular systems rely on the integration of specific photoswitchable units (e.g., azobenzene, diarylethene), which undergo photoisomerization or photochemical bond cleavage under irradiation [9,10]. These molecular-scale structural changes can subsequently trigger macroscopic responses, including assembly-disassembly transitions [11,12], morphological reconfiguration [13], or muscle-like actuation [14,15]. Essentially, this strategy relies primarily on molecular-scale photochemical transformations, which are hierarchically propagated to modulate the structure and function of supramolecular polymers.
By contrast, photothermal conversion provides a fundamentally different pathway. Instead of inducing chemical transformations, light energy is converted into localized heat, which can directly perturb the weak noncovalent interactions that stabilize supramolecular architectures [16]. This mechanism bypasses the requirement for molecular photoswitches and enables direct regulation of assembly stability. Despite extensive investigation of photothermal effects in nanomaterials and biomedical applications [16–18], their role in dynamically regulating supramolecular assemblies, particularly at the intermediate structural scale, remains insufficiently understood.
Notably, photoresponsive processes generally span multiple scales, encompassing molecular, supramolecular, and macroscopic material levels [19–21]. Among these, the dynamic structural evolution of the supramolecular assembly, as the key intermediate scale, directly determines the generation and regulation of macroscopic properties. Understanding the dynamic response of microscopic assemblies under light irradiation is essential for elucidating photoresponsive mechanisms, linking structure to function across scales, and guiding the rational design of smart photoresponsive materials.
Conventional characterization techniques, including scanning electron microscopy (SEM), transmission electron microscopy (TEM), and atomic force microscopy (AFM), typically provide only static morphological information before and after light irradiation. Although these methods resolve structural features with high spatial resolution, they cannot capture the real-time evolution of assemblies during photoresponsive processes [22–24]. More critically, they mainly reveal changes in overall morphology, but offer limited insight into the underlying molecular events.
In supramolecular systems, photoresponse originates from subtle perturbations of noncovalent interactions and molecular packing, and these internal molecular rearrangements often precede and govern macroscopic structural transitions [9]. Therefore, understanding the mechanism requires techniques that can monitor both structural evolution and molecular-level changes under irradiation, as enabled by real-time fluorescence imaging [25–28]. Because fluorescence signals are highly sensitive to molecular microenvironment and packing state, they enable in situ visualization of internal molecular changes alongside morphological dynamics under native conditions [27,29–33]. For example, the Feringa group employed fluorescence microscopy to monitor the light-induced disassembly of self-assembled nanotubes in real time and confirmed that the process was driven by molecular cyclization [12]. However, in situ dynamic studies of light-induced fiber fragmentation remain scarce and still challenging.
Fluorescent dyes have been widely used as photoresponsive molecules for sensing and bioimaging, owing to their environment-sensitive emission and light-controllable properties [34,35]. Naphthalimide derivatives with a rigid π-conjugated structure and unique photophysical properties have been extensively utilized in the construction of supramolecular architectures [36,37]. By modifying the aromatic core and N-imide site, these derivatives exhibit stimuli-responsive fluorescence and versatile applications in areas such as bio-imaging [38–41], sensing [42–45], and drug delivery [46]. Moreover, their inherent fluorescence offers an excellent platform for real-time monitoring of photoresponsive dynamics. In our previous study, we systematically examined the effect of various amino substituents on the morphology and assembly behavior of 1,8-naphthalimide derivatives [47,48]. We found that variations in the amino substituents resulted in distinct assembled morphologies for the three compounds, BAm, BAze, and BDM, which formed nanosheets, nanoribbons, and helical nanowires, respectively (Fig. 1). Employing super-resolution and CLSM, we further elucidated the heterogeneous dynamic growth behaviors of these assemblies.
Here, we report a photothermal-responsive supramolecular system based on 1,8-naphthalimide building blocks and in situ visualize its photoresponsive dynamics using CLSM. Distinct from our previous strategy of tuning supramolecular morphology through variation of amino substituents, we remove the hydroxyl group from the amide N-substituent 4-(hydroxymethyl)benzyl to afford a hydroxyl-free derivative, PhAze. This subtle structural modification enables PhAze assemblies to exhibit photoresponsive behavior markedly different from that of the hydroxyl-containing BAze assemblies. Upon laser irradiation, PhAze assemblies undergo nanofiber rupture accompanied by fluorescence enhancement (~40%), whereas BAze assemblies exhibit only a slight decrease in fluorescence and no observable morphological transformation. CLSM enables in situ monitoring of the PhAze photoresponse, revealing localized fluorescence enhancement along the fibers followed by the formation of molten-like microspheres that ultimately lead to nanofiber rupture. Thermal imaging further suggests that this behavior originates from a photothermal effect, in which localized heating weakens the noncovalent interactions within the assemblies. These findings provide direct in situ insight into photothermal-driven structural evolution in supramolecular assemblies and offer a new perspective for the design of photothermal-responsive supramolecular materials.
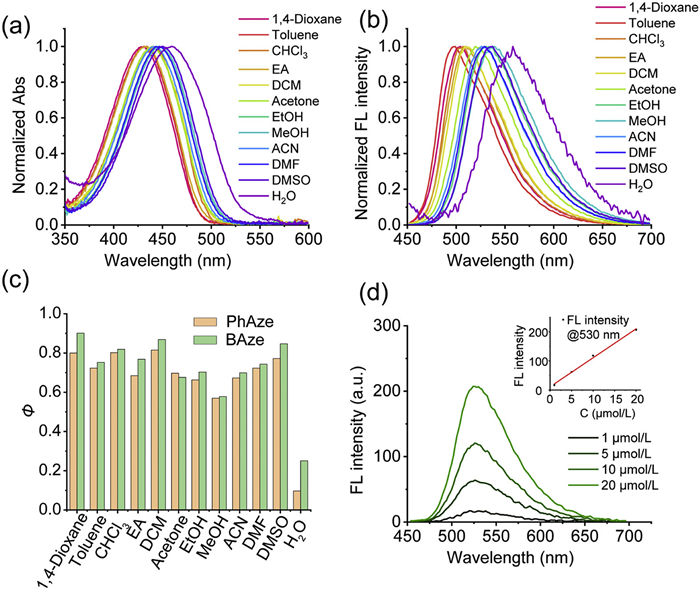
The photophysical properties of PhAze and BAze were first inspected in different solvents. The absorption and emission spectra of PhAze exhibited an overall tendency toward red shift in more polar solvents (Figs. 2a and b, Table S1 in Supporting information), displaying photophysical characteristics highly comparable to those of BAze (Fig. S1 and Table S2 in Supporting information). Notably, the fluorescence quantum yields of PhAze and BAze were not significantly different in most organic solvents. However, in water, the fluorescence quantum yield of PhAze was markedly lower than that of BAze, amounting to only 39% of that of BAze (Fig. 2c), which may be associated with the removal of the hydroxyl substituent. Furthermore, concentration-dependent ultraviolet-visible (UV–vis) absorption and fluorescence spectra showed an approximately linear increase in both absorbance and fluorescence intensity with increasing concentration (1–20 µmol/L) for BAze and PhAze (Fig. 2d, Figs. S2 and S3 in Supporting information). Moreover, the normalized absorption and fluorescence spectra overlapped well, indicating that both compounds predominantly exist as monomers in acetonitrile solution (Fig. S4 in Supporting information).
The assemblies formed by BAze in water were characterized in our previous study and exhibited a flat nanobelt morphology [47,48]. In contrast, PhAze assembled into nanofibers with non-uniform thickness in water (Fig. S5 in Supporting information). Unexpectedly, a pronounced fluorescence enhancement was observed in dried PhAze assemblies upon irradiation with a 488 nm laser. This phenomenon was first identified during confocal fluorescence imaging experiments. Following irradiation of the assemblies in a selected field of view with a 488 nm laser, the fluorescence intensity in the pre-irradiated region was found to be significantly higher than that in the adjacent non-irradiated area (Figs. 3a and b). Specifically, ROI-1 in the irradiated region exhibited an approximately 65% higher fluorescence intensity than ROI-2 in the non-irradiated region (Fig. 3c).
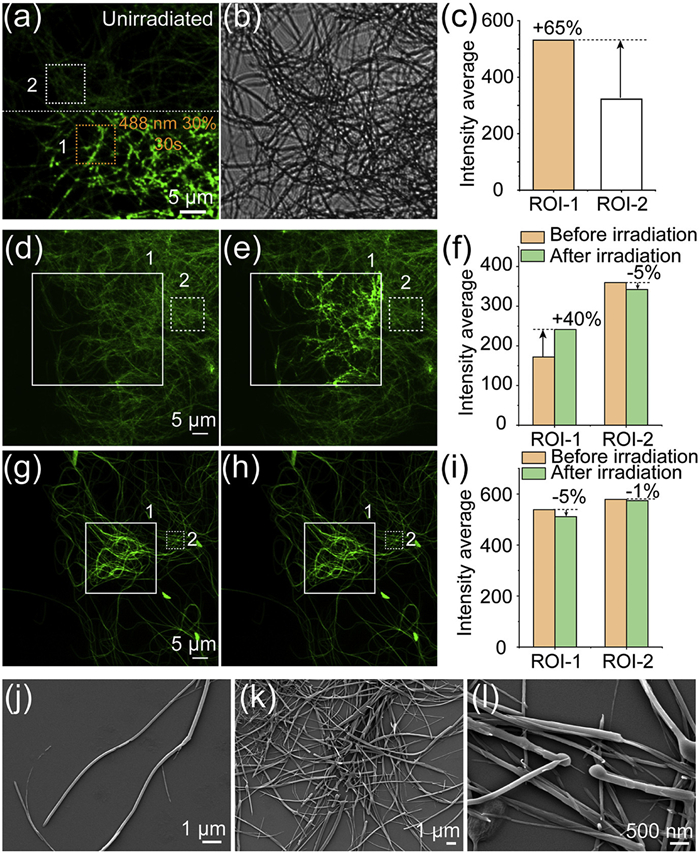
To further validate this phenomenon, part of the assemblies in the same field of view was designated as the experimental region (ROI-1), with the remaining area serving as the control. The experimental region was irradiated with a 488 nm laser at 30% power for 20 s, whereas the control region was not exposed to light. After irradiation, the ROI-1 exhibited a significant increase in average fluorescence intensity (~40%). However, the unirradiated region (ROI-2) showed only a slight decrease (~5%), likely due to photobleaching during routine imaging (Figs. 3d-f). These results indicated that PhAze assembies exhibit a light-induced fluorescence enhancement. However, BAze assemblies exhibited only a slight decrease (~5%) in fluorescence intensity after irradiation (Figs. 3g-i). These distinctly different photoresponsive behaviors likely originate from differences in molecular packing arrangements within the assemblies formed by the two compounds.
Moreover, upon light irradiation, PhAze assemblies fragmented and formed spherical structures, while BAze assemblies exhibited no significant morphological change (Figs. 3e and h). SEM images confirmed these changes of PhAze assemblies. Intact nanofibers were observed before irradiation (Fig. 3j), whereas extensive fragmentation appeared afterward (Fig. 3k). High-magnification images revealed spherical structures of 300–500 nm at the fracture sites (Fig. 3l and Fig. S6 in Supporting information). To inspect the photophysical properties of PhAze assemblies, in situ fluorescence spectra of the irradiated regions were acquired before and after irradiation (Fig. S7 in Supporting information). The fluorescence emission spectra showed little change before and after irradiation. Notably, the peak around 480 nm, likely corresponding to an H-aggregate, decreased in relative intensity after irradiation, which may result from the dissociation of H-aggregates induced by irradiation. However, further evidence is needed. Although excitation and emission spectra of the solid assemblies showed no significant differences before and after irradiation, fluorescence lifetime analysis revealed a measurable change (Fig. S8 in Supporting information). Specifically, the average fluorescence lifetime increased by 0.47 ns (~12%) after irradiation (Table S3 in Supporting information). The observed increase in fluorescence lifetime may indicate reduced non-radiative decay, potentially contributing to the enhanced fluorescence. Moreover, the PhAze assemblies exhibit good pH stability, as the fibrous morphology remains essentially unchanged over a wide pH range (pH 3.0, 5.0, 7.0, 9.0, and 11.0) (Fig. S9 in Supporting information).
Real-time visualization of photoresponsive dynamics is essential for understanding the photoresponsive behavior of PhAze assemblies. To achieve this, CLSM was used to simultaneously record 488 nm fluorescence and bright-field images (Movies S1 and S2 in Supporting information show the respective channels), enabling real-time monitoring of morphological and fluorescence changes of the assemblies during the photoresponse process. As shown in Fig. 4a, the overall fluorescence intensity was initially low at 0 s. At 236 s, a fluorescence-enhanced bright spot appeared at the position marked by the red arrow, while the bright-field image still showed a continuous linear structure. By 257 s, the fluorescence intensity further increased and the bright spot expanded. At 268 s, two small spherical structures became visible in both bright-field and fluorescence images. Subsequently, at 279 s, the two spheres separated, resulting in the distinct rupture of the linear assembly. For quantitative analysis, the fluorescence intensity profile along the direction marked by the white arrow was extracted over time (Fig. 4b). The results revealed that between 236 s and 268 s, the fluorescence intensity increased continuously, and at 268 s, two distinct fluorescence peaks emerged, corresponding to the formation of the two small spheres. Notably, during the separation of the two spheres, they retracted differentially, with the upper and lower spheres moving by approximately 0.26 µm and 0.13 µm, respectively, leading to rupture of the linear structure. In summary, this process followed a temporal sequence characterized by initial fluorescence enhancement, subsequent molten-like microspheres formation during the late enhancement stage, which ultimately leads to fiber rupture.
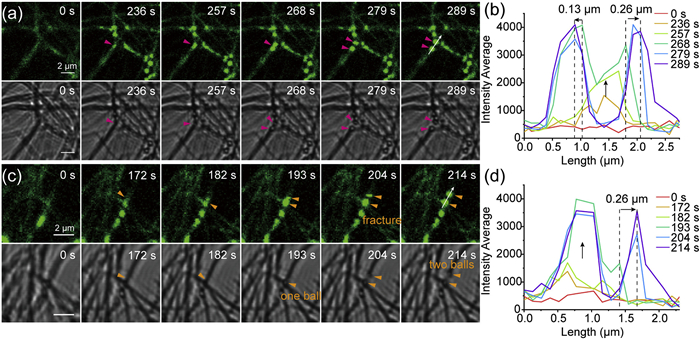
Unlike the rupture caused by the previously described “synchronous formation”, another mode characterized by “asynchronous formation” was also observed. As shown in Fig. 4c, a fluorescence-enhanced bright spot appeared at the orange arrow at 172 s, followed by a second enhanced region at 182 s, with no spherical structures yet visible in bright-field. By 193 s, a clearly distinguishable small sphere (visible in bright-field) formed at the orange arrow position, whereas fluorescence in the adjacent region, although further enhanced, had not yet evolved into an independent sphere. At 204 s, the second sphere appeared in both fluorescence and bright-field images, coinciding with rupture of the linear assembly. Quantitative analysis indicated a positional displacement of about 0.26 µm for the second sphere during formation (Fig. 4d). This process exhibited distinct spatiotemporal features compared with the synchronous mode, with a clear temporal lag between the two spheres. Therefore, two distinct rupture behaviors were observed during the light-induced fragmentation process, namely the synchronous formation and asynchronous formation modes. Statistical analysis of 28 light-induced rupture events showed that 13 cases (46%) followed the synchronous formation mode, while 15 cases (54%) followed the asynchronous formation mode (Fig. S10 in Supporting information), indicating that both pathways occur with comparable frequencies.
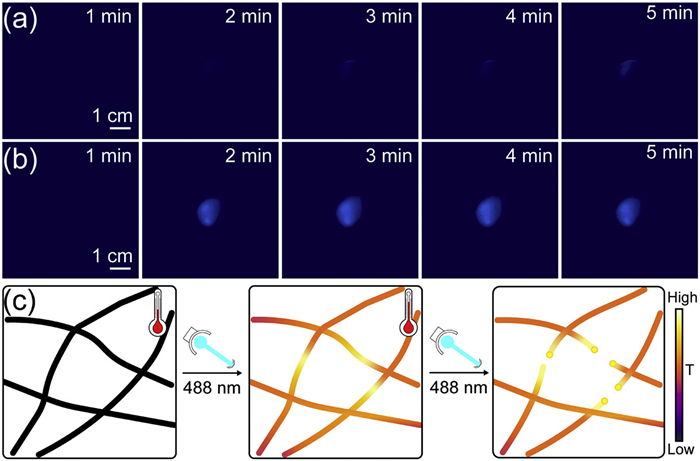
Considering that supramolecular fiber stability primarily depends on temperature-sensitive non-covalent interactions, we hypothesized that the observed light-induced rupture could involve a photothermal effect. The blank control showed negligible temperature change under 450 nm laser irradiation (Fig. 5a). In contrast, PhAze assemblies showed a clear photothermal response, with temperature rising from 23 ℃ to 28 ℃ within 5 min (Fig. 5b). Based on these results, we tentatively suggest that the rupture involves a photothermal effect and propose the mechanistic model shown in Fig. 5c. Upon light irradiation, PhAze assemblies can convert light energy into heat, which may account for their relatively low fluorescence intensity before irradiation. The local heat may disrupt non-covalent interactions, rendering the high-temperature regions preferential sites for rupture. Continued irradiation further weakens these non-covalent interactions, leading to partial fiber dissociation and local melting, eventually resulting in the formation of spherical structures at the pre-rupture sites and subsequent rupture. The localized fluorescence enhancement observed before rupture may arise from an increased local concentration of luminophores or changes in their molecular packing (Fig. S11 in Supporting information).
In conclusion, we developed a photothermal-responsive supramolecular system based on 1,8-naphthalimide building blocks and in situ revealed its dynamic photoresponse using CLSM. Removal of the hydroxyl group from the amide N-substituent of BAze afforded an OH-free derivative, PhAze, which converts environmentally insensitive assemblies into photoresponsive ones. Under 488 nm laser irradiation, the photoresponse begins with localized fluorescence enhancement along the nanofibers, followed by microsphere formation and ultimately fiber rupture. Moreover, we identified two distinct modes of microsphere formation during this process, synchronous and asynchronous. Thermal imaging further indicated that the response was driven by a photothermal effect, exhibiting a pronounced temperature rise compared with the control system. These findings provide direct in situ insights into photothermal-driven structural evolution in supramolecular assemblies and offer new guidance for the rational design of photothermal-responsive supramolecular materials. As a potential application, such assemblies could serve as photoresponsive microscale fuses, in which light-triggered fiber rupture could act as a protective or switching mechanism in microdevices. This system may inspire the design of smart materials capable of light-controlled mechanical actuation, self-healing, or controlled release. Nevertheless, the mechanisms underlying synchronous and asynchronous rupture, as well as the long-term stability and performance of the assemblies, require further investigation, which could be addressed through advanced spectroscopy and theoretical modeling.
The authors declare that they have no known competing financial interests or personal relationships that could have appeared to influence the work reported in this paper.
Yinchan Zhang: Writing – original draft, Investigation, Data curation. Wenting Yin: Funding acquisition, Conceptualization. Guoli Han: Data curation. Yiyan Ruan: Data curation. Qinglong Qiao: Writing – original draft, Supervision, Funding acquisition, Conceptualization. Zhaochao Xu: Writing – review & editing, Supervision, Funding acquisition, Conceptualization.
This work is supported by the National Natural Science Foundation of China (Nos. 22225806, 22522816, 22578443, 22378385, 22278394, 22507121, 22508383, 22541705, U25A20620); The Chinese Academy of Sciences Project for Young Scientists in Basic Research (No. YSBR-104); The Energy Revolution S&T Program of Yulin Innovation Institute of Clean Energy (No. E412050705); Liaoning Binhai Laboratory (No. LBLD-2024-07); Dalian Institute of Chemical Physics (Nos. DICP I202436, DICP I202522, DICP I202512, DICP&SIA UN202502, DMU-1&DICP UN202301, DMU-1&DICP UN202302, DMU-2&DICP UN202502); Natural Science Foundation of Liaoning (Nos. 2025-MS-061, 2025-BS-0147); Dalian Science and Technology Innovation Fund Program (No. 2022JJ11CG007).
Supplementary material associated with this article can be found, in the online version, at doi:
G.M. Whitesides, B. Grzybowski, Science 295 (2002) 2418–2421. doi: 10.1126/science.1070821
E. Mattia, S. Otto, Nat. Nanotechnol. 10 (2015) 111–119. doi: 10.1038/nnano.2014.337
T.L. Mako, J.M. Racicot, M. Levine, Chem. Rev. 119 (2019) 322–477. doi: 10.1021/acs.chemrev.8b00260
R. Piotrowska, T. Hesketh, H. Wang, et al., Nat. Mater. 20 (2021) 403–409. doi: 10.1038/s41563-020-0799-0
S.J.D. Lugger, S.J.A. Houben, Y. Foelen, et al., Chem. Rev. 122 (2022) 4946–4975. doi: 10.1021/acs.chemrev.1c00330
X. Yan, F. Wang, B. Zheng, et al., Chem. Soc. Rev. 41 (2012) 6042–6065. doi: 10.1039/c2cs35091b
Y. Zhao, S. Song, X. Ren, et al., Chem. Rev. 122 (2022) 5604–5640. doi: 10.1021/acs.chemrev.1c00815
S. Das, A. Ajayaghosh, Small 21 (2025) e07210. doi: 10.1002/smll.202507210
F. Xu, B.L. Feringa, Adv. Mater. 35 (2023) 2204413. doi: 10.1002/adma.202204413
X. Yao, T. Li, J. Wang, et al., Adv. Opt. Mater. 4 (2016) 1322–1349. doi: 10.1002/adom.201600281
J.W. Fredy, A. Méndez-Ardoy, S. Kwangmettatam, et al., Proc. Natl. Acad. Sci. U. S. A. 114 (2017) 11850–11855. doi: 10.1073/pnas.1711184114
A.C. Coleman, J.M. Beierle, M.C.A. Stuart, et al., Nat. Nanotechnol. 6 (2011) 547–552. doi: 10.1038/nnano.2011.120
L. Li, H. Jiang, B.W. Messmore, et al., Angew. Chem. Int. Ed. 46 (2007) 5873–5876. doi: 10.1002/anie.200701328
J. Chen, F.K.C. Leung, M.C.A. Stuart, et al., Nat. Chem. 10 (2018) 132–138. doi: 10.1038/nchem.2887
K. Iwaso, Y. Takashima, A. Harada, Nat. Chem. 8 (2016) 625–632. doi: 10.1038/nchem.2513
L. Zhao, Y. Liu, R. Chang, et al., Adv. Funct. Mater. 29 (2019) 1806877. doi: 10.1002/adfm.201806877
P. Huang, Y. Gao, J. Lin, et al., ACS Nano 9 (2015) 9517–9527. doi: 10.1021/acsnano.5b03874
R. Chang, Q. Zou, L. Zhao, et al., Adv. Mater. 34 (2022) 2200139. doi: 10.1002/adma.202200139
Y. Deng, G. Long, Y. Zhang, et al., Light: Sci. Appl. 13 (2024) 63. doi: 10.1038/s41377-024-01391-8
Q. Zhang, D.H. Qu, H. Tian, et al., Matter 3 (2020) 355–370. doi: 10.2112/si103-073.1
Y. Deng, Q. Zhang, T. Nie, et al., Adv. Opt. Mater. 10 (2022) 2101267. doi: 10.1002/adom.202101267
R. Kubota, W. Tanaka, I. Hamachi, Chem. Rev. 121 (2021) 14281–14347. doi: 10.1021/acs.chemrev.0c01334
X. Fang, Q. Qiao, F. Deng, et al., Chin. Chem. Lett. 36 (2025) 110980. doi: 10.1016/j.cclet.2025.110980
A. Song, Q. Qiao, N. Xu, et al., Chin. Chem. Lett. 36 (2025) 110643. doi: 10.1016/j.cclet.2024.110643
X. Teng, F. Li, C. Lu, Chem. Soc. Rev. 49 (2020) 2408–2425. doi: 10.1039/c8cs00061a
K. An, Q. Qiao, Lovelesh, et al., Chin. Chem. Lett. 36 (2025) 109786. doi: 10.1016/j.cclet.2024.109786
S. Pujals, N. Feiner-Gracia, P. Delcanale, et al., Nat. Rev. Chem. 3 (2019) 68–84. doi: 10.1038/s41570-018-0070-2
G. Wang, Q. Qiao, W. Jia, et al., Chin. Chem. Lett. 36 (2025) 110130. doi: 10.1016/j.cclet.2024.110130
A. Aloi, I.K. Voets, Curr. Opin. Colloid Interface Sci. 34 (2018) 59–73. doi: 10.1016/j.cocis.2018.03.001
X. Zhou, L. Miao, W. Zhou, et al., Chin. Chem. Lett. 36 (2025) 110984. doi: 10.1016/j.cclet.2025.110984
S. Onogi, H. Shigemitsu, T. Yoshii, et al., Nat. Chem. 8 (2016) 743–752. doi: 10.1038/nchem.2526
R.M.P. da Silva, D. van der Zwaag, L. Albertazzi, et al., Nat. Commun. 7 (2016) 11561. doi: 10.1038/ncomms11561
A. Aliprandi, M. Mauro, L. De Cola, Nat. Chem. 8 (2016) 10–15. doi: 10.1038/nchem.2383
C. Yan, Q. Qiao, W. Zhou, et al., Chin. Chem. Lett. 36 (2025) 110258. doi: 10.1016/j.cclet.2024.110258
Z. Li, Q. Qiao, N. Xu, et al., Chin. Chem. Lett. 35 (2024) 108824. doi: 10.1016/j.cclet.2023.108824
P. Gopikrishna, N. Meher, P.K. Iyer, ACS Appl. Mater. Interfaces 10 (2018) 12081–12111. doi: 10.1021/acsami.7b14473
A.K. Rachamalla, P.K. Jana, S. Nagarajan, Chem. Eur. J. 31 (2025) e202500001. doi: 10.1002/chem.202500001
N. Xu, Q. Qiao, X. Fang, et al., Anal. Chem. 96 (2024) 4709–4715. doi: 10.1021/acs.analchem.4c00292
W. Jiang, Q. Qiao, J. Chen, et al., Adv. Sci. 11 (2024) 2309743. doi: 10.1002/advs.202309743
S. Leng, Q. Qiao, L. Miao, et al., Chem. Commun. 53 (2017) 6448–6451. doi: 10.1039/C7CC01483J
W. Feng, Q. Qiao, S. Leng, et al., Chin. Chem. Lett. 27 (2016) 1554–1558. doi: 10.1016/j.cclet.2016.06.016
J. Li, Q. Qiao, N. Xu, et al., Chin. Chem. Lett. 35 (2024) 108348. doi: 10.1016/j.cclet.2023.108348
M. Wang, Z. Xu, X. Wang, et al., Dyes Pigm. 96 (2013) 333–337. doi: 10.1016/j.dyepig.2012.08.024
X. Chen, J. Wang, J. Cui, et al., Tetrahedron 67 (2011) 4869–4873. doi: 10.1016/j.tet.2011.05.001
L. Dai, D. Wu, Q. Qiao, et al., Chem. Commun. 52 (2016) 2095–2098.
D. Sarkar, M. Chowdhury, P.K. Das, Langmuir 38 (2022) 3480–3492. doi: 10.1021/acs.langmuir.1c03334
Q. Qiao, W. Liu, Y. Zhang, et al., Angew. Chem. Int. Ed. 61 (2022) e202208678. doi: 10.1002/anie.202208678
Y. Zhang, Q. Qiao, N. Xu, et al., Chem. Eur. J. 31 (2025) e202500979. doi: 10.1002/chem.202500979

Figure 1 Previous work: Effect of amino substituents on the morphology of the assembly and a schematic diagram of the photothermal rupture of PhAze nanofibers in this work.

Figure 2 (a) Normalized absorption spectra and (b) fluorescence spectra of 5 µmol/L PhAze in different solvents. (c) Fluorescence quantum yield of 5 µmol/L PhAze and BAze in different solvents. (d) Fluorescence spectra of different concentrations of PhAze in acetonitrile. The inset graph shows the relationship between the concentration and the fluorescence intensity at 530 nm.

Figure 3 CLSM image of PhAze assemblies under (a) 488 nm excitation (collect: 500–530 nm) and (b) corresponding bright-field image. In (a), the areas above and below the white dashed line represent the non-irradiated and irradiated regions, respectively. (c) Statistical analysis of fluorescence intensity in the region of interest (ROI) in (a). CLSM images of PhAze assemblies (d) before and (e) after local 488 nm irradiation. (f) Statistical analysis of fluorescence intensity within the ROI in (d) and (e). CLSM images of PhAze assembies (g) before and (h) after local 488 nm irradiation. (i) Statistical analysis of fluorescence intensity within the ROI in (g) and (h). CLSM imaging conditions: excitation wavelength: 488 nm; emission collection range: 500–600 nm. (j–l) SEM images: (j) before 488 nm irradiation; (k, l) after 488 nm irradiation.

Figure 4 (a) In situ dynamic CLSM imaging of synchronous microsphere formation leading to rupture of PhAze assemblies. (b) Time-dependent fluorescence intensity profiles along the white arrow in (a). (c) In situ dynamic confocal imaging of asynchronous microsphere formation leading to rupture of PhAze assemblies. (d) Time-dependent fluorescence intensity profiles along the white arrow in (c). In (a) and (c), the top panels show CLSM images under 488 nm excitation, and the bottom panels show bright-field images.

 扫一扫看文章

扫一扫关注我们
 DownLoad:
 下载:
下载:

 下载:
下载: