
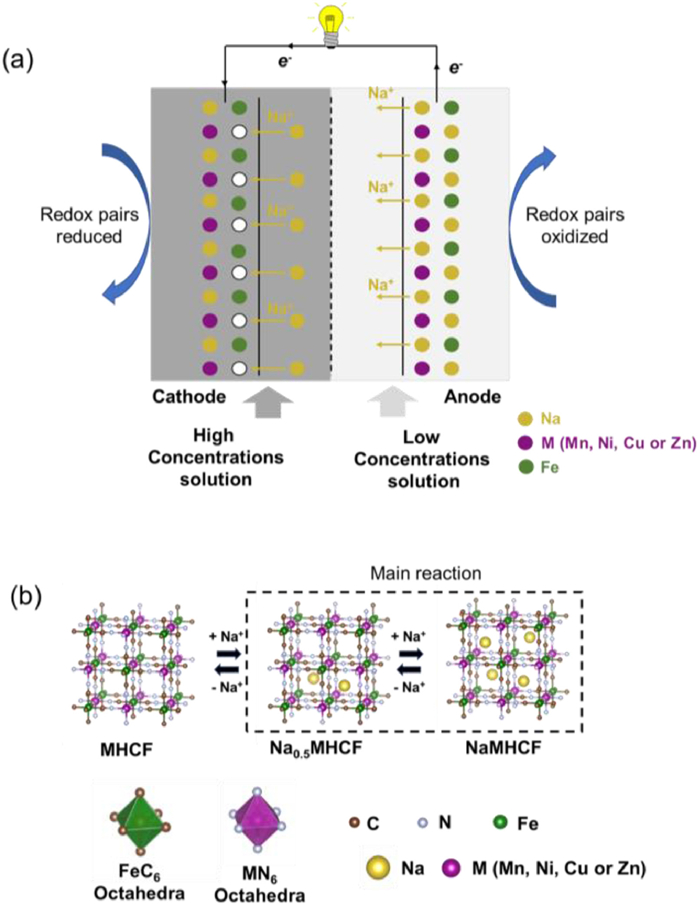
Figure 1.
(a) The working principle of CFCs with hexacyanoferrate electrodes. (b) The crystal structures of MHCF, Na0.5MHCF, and NaMHCF, and the octahedral structures of FeC6 and MN6.


Salinity gradient (SG) energy arises from the chemical potential difference between solutions of varying salt concentrations, such as seawater and river water, and represents a renewable resource with minimal environmental impact [1]. This energy form exhibits continuous availability independent of climatic variations, boasting a global theoretical potential exceeding 27,000 TWh/year [2]. While reverse electrodialysis (RED) and pressure-retarded osmosis (PRO) constitute mainstream SG technologies [3], capacitive flow cells (CFCs) have recently emerged as competitive alternatives due to their high energy density and scalable electrode design [4]. CFCs primarily rely on sodium ion intercalation/deintercalation mechanisms, where electrode materials critically determine system performance [5].
Transition metal hexacyanoferrates (MHCFs, M[Fe(CN)6]) have been extensively studied for CFCs due to their open-framework structures, low cost, and tunable redox chemistry [6]. The electrochemical properties of MHCFs are determined by the electronic configuration of the metal centers [7], which influences both ion transport and structural integrity [8,9]. Despite their potential, existing synthesis methods, such as hydrothermal treatment [10], ball milling [11], and coprecipitation [12], result in considerable variations in crystallinity and defect density [13]. These inconsistencies are further compounded by differences in device architectures employed for salinity gradient energy recovery, such as membrane-based and flow-through systems. For SG studies, progress is limited by (ⅰ) the lack of standardized testing metrics across electrolytes, cell architectures, and operating rates [14], (ⅱ) insufficient consideration of the coupling among phase, hydration, and vacancy, which strongly influences intercalation voltage and structural stability [15], and (ⅲ) the absence of transferable descriptors that relate the d orbital characteristics to electrochemical performance [16]. These gaps hinder cross study comparability and the development of generalizable structure with property relationships.
In this study, four MHCF variants (M = Mn, Ni, Cu, Zn) were examined by density functional theory (DFT) to predict voltage profiles during partial Na+ deintercalation in saline electrolytes of differing concentrations. Transition metals were chosen as representative systems because of their characteristic 3d electron configurations: Mn3+/Mn2+ in a high–spin state; Ni3+/Ni2+ in an intermediate–spin state; Cu2+/Cu+ in a low–spin state; and Zn2+ in a closed–shell configuration [17]. Lattice changes and electronic rearrangements occurring during cation intercalation were elucidated. The orbital analysis reveals how d electron filling patterns govern redox activity differences across transition metals. Experimental validation was carried out through cyclic voltammetry measurements that explicitly matched the redox assignments. These findings establish design principles for optimizing MHCF electrodes in CFCs systems, bridging the gap between fundamental electronic behavior and practical device performance.
First-principles calculations were conducted using the Vienna Ab initio Simulation Package (VASP) with projector augmented wave (PAW) pseudo-potentials [18]. The Perdew-Burke-Ernzerhof (PBE) within the generalized gradient approximation (GGA) addressed electron exchange-correlation, with a 400 eV plane-wave cutoff and 0.02 eV/Å ionic force convergence criteria [19]. A Γ-centered 4 × 4 × 4 k-point mesh sampled the Brillouin zone. Strong crystal field effects at octahedral Fe sites necessitated GGA+U corrections (UFe = 3.00 eV) to account for d-electron localization [20]. For M = Mn/Ni/Cu, the strong-field CN ligand substantially reduces on-site correlation relative to oxides; accordingly, many PBA studies either apply U only to Fe or report that moderate variations in UM do not alter qualitative trends [16,21].
The working principle of MHCF-based CFCs parallels that of sodium-ion batteries, with salinity-driven potential generation replacing electrical charging (Fig. 1a). During operation, the following electrochemical reaction occurs:
|
|
(1) |
At the cathode, Na+ ions intercalate into the electrode from the high concentration solution, and due to the introduction of extraneous cations, the cathode obtains electrons to keep charge balance and the redox couples (such as Fe2+/Fe3+) of the electrode are reduced. On the other hand, the anode is immersed in the low concentration solution, Na+ deintercalation occurs and the redox couples in the electrode are oxidized, providing electrons to the anode through the external circuit [2]. The CFCs could be recharged by switching the high and low concentration solutions after a discharge cycle is completed. The reversible Na+ intercalation and deintercalation at the electrodes allow CFCs to continuously output power.
The hexacyanoferrate framework adopts a cubic structure in which FeC6 and MN6 octahedra (M = Mn, Ni, Cu, Zn) are interconnected by cyanide ligands. Fe, C, N, and the transition metal centers form an open network that facilitates reversible Na+ insertion and extraction (Fig. 1b) [22]. To investigate the processes of Na+ insertion and deintercalation under varying salinity conditions, two structural models were constructed. Full sodiation (NaMHCF) represented the high–concentration electrolyte state, whereas half–sodiation (Na0.5MHCF) corresponded to the crystal structure of MHCF in low concentration solutions. The x = 0.5 phase represents the midpoint of Na+ (de)intercalation, where structural symmetry is maximized, simplifying the calculation of voltage profiles. Modeling of Na2MHCF was not included, as previous SG studies consistently employ MHCF as the Na+ intercalation electrode and no stable Na2MHCF phase has been reported under typical operating conditions [6,23]. In addition, Na+ rich phases often undergo rhombohedral to tetragonal distortion with significant strain [15], which compromises ion transport and structural reversibility in SG operation.
Stable crystal configurations of MHCFs were determined through lattice geometry optimization, with structural parameters summarized in Table S1 (Supporting information). All four variants crystallized in the cubic Fm3m space group (α = β = γ = 90°) featuring substantial interstitial space. While Fe−C (1.87-1.90 Å) and C−N (1.17 Å) bond lengths remained consistent across systems (Table S1), M−N bond distances exhibited transition metal-dependent variations due to distinct coordination environments in MN6 octahedra. For Na+ intercalated MHCFs (Na0.5MHCFs and NaMHCF), Na+ was located body-center of the cubic (Wyckoff notations as 8c), and the variation of their cell volume will be discussed in details in the following sections.
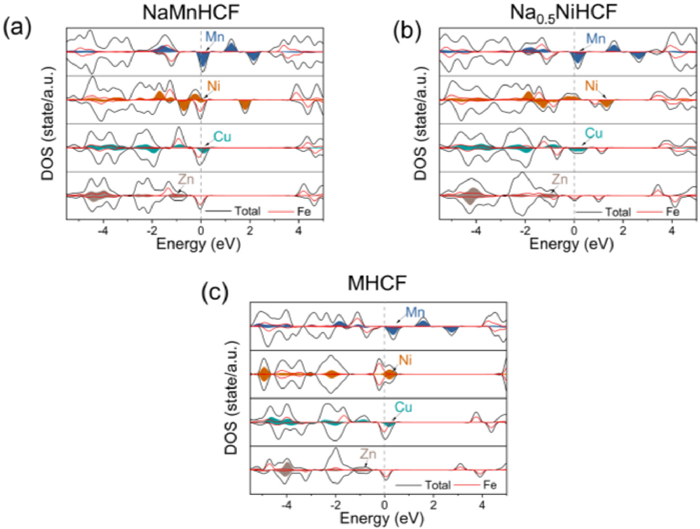
Density of states (DOS) analyses (Fig. 2) revealed continuous bands near the Fermi level for all MHCFs, indicative of intrinsic metallic conductivity. CuHCF and NiHCF demonstrated hybridized Fe and M d orbital contributions across the Fermi region, with NiHCF specifically showing spin-polarized d electron occupation at Ni sites. ZnHCF retained metallicity primarily through Fe d orbital participation, while Zn states remained energetically isolated below -0.5 eV. In contrast, MnHCF exhibited dominant Mn d orbital near the Fermi level. This systematic variation in electronic configurations directly governs the redox-active centers during Na+ deintercalation, as mechanistically detailed in subsequent electrochemical analyses.
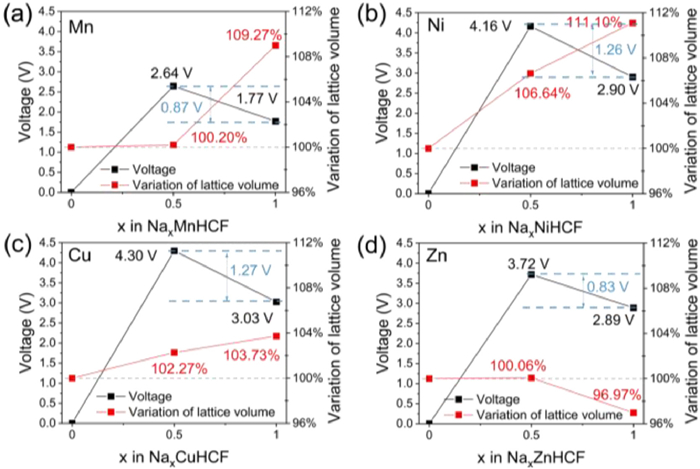
The electrochemical voltage profiles of Na+ intercalation in MHCFs were computationally derived through formation energy calculations for NaxMHCF configurations (x = 0.5, 1), following established thermodynamic frameworks (Fig. 3). As described by Eq. 2 [24], the intercalation voltage was determined through total energy differentials between pristine and sodium-incorporated systems during discharge processes.
|
|
(2) |
where E represents the total energy of optimized structures, the voltage was determined by energy differences during discharge processes. While the initial intercalation (x = 0 → 0.5) generated higher voltage differentials across all MHCF variants, the secondary intercalation (x = 0.5 → 1) proved more relevant for assessing performance in salinity gradient energy conversion systems. Among the investigated materials, CuHCF exhibited the highest operational voltage (1.27 V), followed by NiHCF (1.26 V), with MnHCF (0.87 V) and ZnHCF (0.83 V). Structural stability analysis revealed critical performance differentiators: CuHCF maintained minimal lattice distortion (< 1.5% variation of lattice volume) during secondary deintercalation, while other variants underwent > 4% structural deformation. Notably, MnHCF demonstrated contrasting stability behavior, despite favorable initial cycle preservation, it suffered severe lattice collapse (> 9% distortion) during secondary sodium extraction. This instability was attributed to Jahn-Teller distortion in Mn3+ coordination environments, as evidenced by orbital symmetry analysis [25].
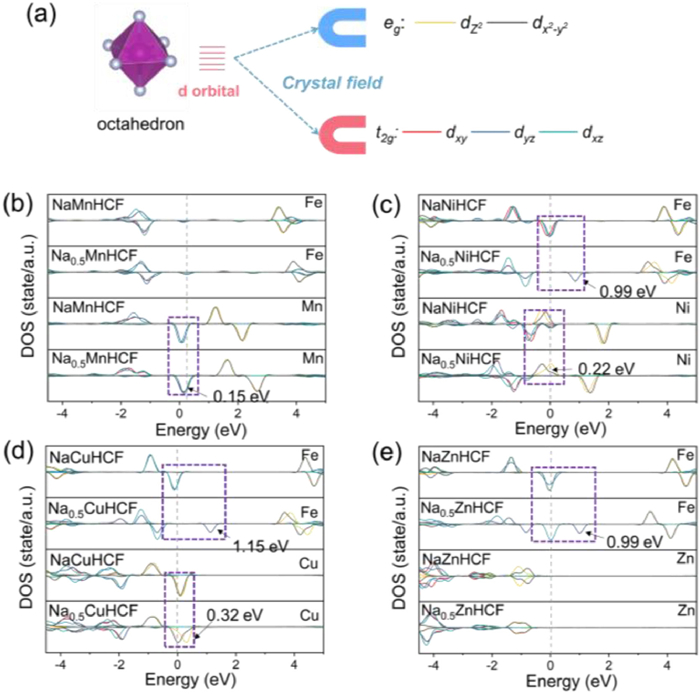
The electronic origins of voltage disparities during secondary deintercalation in CFCs were elucidated through projected density of states (PDOS) analyses (Fig. 4). Due to their octahedral coordination of both Fe atoms and M (Mn, Ni, Cu and Zn) atoms, their 3d orbitals were divided into t2g and eg orbitals under the effect of the coordination field [26], and for all NaMHCFs the electrons of its highly coordinated Fe were filled into t2g orbitals [27]. MnHCF exhibited its t2g with minimal Fermi-level shift (ΔE = 0.15 eV), explaining its low voltage through exclusive Mn3+/Mn2+ redox (Fig. 4b). NiHCF/CuHCF (Figs. 4c and d) demonstrate dual redox mechanisms: Fe3+/Fe2+ transitions via t2g shifts (ΔE = 0.99 for NiHCF and 1.15 eV for CuHCF) combine with Ni3+/Ni2+ or Cu2+/Cu+ eg orbital participation (ΔE = 0.99 for NiHCF and 1.15 eV for CuHCF), yielding enhanced voltages. ZnHCF exhibits Fe-centered t2g electron transfer (ΔE = 0.99 eV) without Zn2+ participation, mirroring ZnHCF's voltage profile (Fig. 4e). Charge density difference schematics (isosurfaces) for the secondary step (x = 1.0 to 0.5) in Fig. S6 (Supporting information) together with Bader charge differences for Fe and M, further support these assignments. For Ni/Cu/Zn, electron depletion localizes on Fe–C≡N bridges with minor changes at M, whereas MnHCF exhibits additional depletion around the Mn–N octahedra, indicating Mn participation. These trends are consistent with our DOS analysis based t2g of Fe and eg of Fe assignment. This orbital-resolved correlation establishes t2g orbital energy as the primary voltage determinant, while eg contributions enable multi-redox coupling in Cu/Ni systems to enhance the performance in Na+ intercalation voltages.
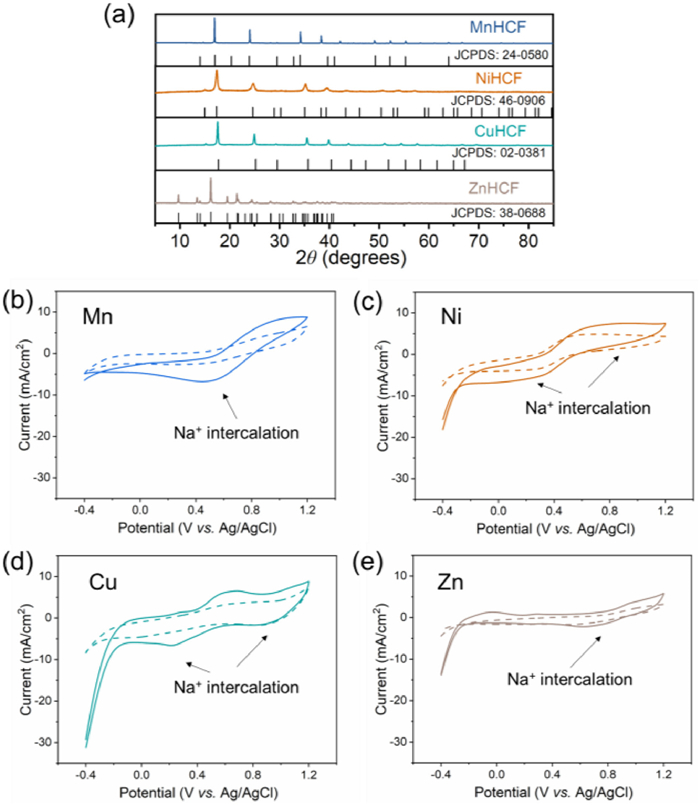
Four MHCF variants were synthesized via coprecipitation to verify computational insights. X-ray diffraction (XRD) patterns confirmed phase purity: CuHCF, NiHCF, and MnHCF crystallized in face-centered cubic structures (Fig. 5a). In contrast, ZnHCF crystallized in a tetragonal configuration due to Zn preference for tetrahedral ZnN4 coordination under dehydrated conditions. Cyclic voltammetry (CV) in 30 g/L NaCl revealed distinct Na+ storage mechanisms: MnHCF exhibited single redox pair behavior (0.49 V reduction; 0.89 V oxidation) matching Mn3+/Mn2+ transitions predicted computationally (Fig. 5b). NiHCF (Fig. 5c) displayed dual redox activity (-0.12 V and 0.63 V oxidation; 0.26 V and 0.93 V reduction), consistent with concurrent Fe3+/Fe2+ and Ni3+/Ni2+ processes. CuHCF (Fig. 5d) demonstrated bifurcated reduction peaks at 0.21 V (-6.6 mA/cm2) and 0.86 V (-1.5 mA/cm2), alongside a high-current oxidation at 0.64 V (6.4 mA/cm2)), validating Fe/Cu dual redox couples with enhanced kinetics. ZnHCF (Fig. 5e) showed limited activity with a reduction peak at 0.64 V (-2.1 mA/cm2) reduction and an oxidation peak at 0.04 V (1.3 mA/cm2), consistent with theoretical predictions of sluggish Na+ extraction kinetic. Concentration-dependent CV profiles maintained redox potential stability but showed reduced current densities at 1 g/L NaCl, experimentally confirming salinity gradient-induced rate limitations. For context, CFC studies on MHCF electrodes report Nernst-consistent OCVs and higher power for Ni/Cu than Mn/Zn; for example, CuHCF averages 0.41 W/m2 at SG CFC systems [4], with NiHCF higher in like-for-like tests (Text S6 in Supporting information). These systematic measurements conclusively validated the redox couple assignments derived from orbital-resolved computational analyses.
In summary, the relationships between crystal structure and electrochemical behavior in MHCFs were clarified by first–principles calculations. A voltage ordering of Cu ≈ Ni > Mn ≈ Zn was attributed to distinct d–orbital contributions: t2g orbital dictates baseline Na+ intercalation voltages, while eg orbital participation in Cu/Ni systems enables dual redox couples, enhancing voltages by 35%-45% compared to Mn/Zn analogs. The instability of MnHCF under high–salinity conditions was ascribed to Jahn–Teller distortions during Na+ extraction. By separating electronic factors (t2g and eg orbital effects) from geometric factors (maintenance of octahedral coordination symmetry), MHCFs were identified that combine voltages above 1.2 V with lattice strains below 2%. These results yield three practical design principles: (ⅰ) Suppress Jahn–Teller distortions through low-distortion metals or controlled defect chemistry; (ⅱ) enable dual redox coupling between Fe t2g and M eg orbitals to boost voltage and conductivity; and (ⅲ) limit lattice strain to about 3% during secondary Na+ deintercalation to preserve structural integrity.
Taobo Huang: Writing – review & editing, Writing – original draft, Software, Methodology, Formal analysis, Data curation, Conceptualization. Haodong Ji: Writing – review & editing, Software, Methodology, Conceptualization. Xiuping Zhu: Writing – review & editing, Writing – original draft, Supervision, Project administration, Funding acquisition.
The authors declare that they have no known competing financial interests or personal relationships that could have appeared to influence the work reported in this paper.
This work was supported by the National Natural Science Foundation of China (No. 52270029).
Supplementary material associated with this article can be found, in the online version, at doi:
M. Li, W. Zhang, Y. Geng, B. Jiang, et al., Adv. Funct. Mater. 35 (2025) 2414342. doi: 10.1002/adfm.202414342
G. Tan, N. Xu, D. Gao, X. Zhu, ACS Appl. Mater. Interfaces 13 (2021) 19855–19863. doi: 10.1021/acsami.0c21956
M. Marino, L. Misuri, R. Ruffo, D. Brogioli, Electrochim. Acta 176 (2015) 1065–1073. doi: 10.1016/j.electacta.2015.07.069
T. Kim, M. Rahimi, B.E. Logan, C.A. Gorski, Environ. Sci. Technol. 50 (2016) 9791–9797. doi: 10.1021/acs.est.6b02554
G. Tan, S. Lu, J. Fan, G. Li, X. Zhu, Electrochim. Acta 322 (2019) 134724. doi: 10.1016/j.electacta.2019.134724
X. Zhu, W. Xu, G. Tan, Y. Wang, ChemistrySelect 3 (2018) 5571–5580. doi: 10.1002/slct.201800312
G. Zhang, Y. Li, G. Du, J. Lu, et al., Angew. Chem. Int. Ed. 64 (2025) e202414650. doi: 10.1002/anie.202414650
M. Du, K. Li, N. Yu, et al., Adv. Mater. 37 (2025) 2418219. doi: 10.1002/adma.202418219
A. Zhou, W. Cheng, W. Wang, et al., Adv. Energy Mater. 11 (2021) 2000943. doi: 10.1002/aenm.202000943
W. Wang, Y. Gang, J. Peng, et al., Adv. Funct. Mater. 32 (2022) 2111727. doi: 10.1002/adfm.202111727
J. Peng, Y. Gao, H. Zhang, Z. Liu, et al., Angew. Chem. Int. Ed. 61 (2022) e202205867. doi: 10.1002/anie.202205867
Z. Pan, G. Ni, Y. Li, et al., ChemSusChem 17 (2024) e202400713. doi: 10.1002/cssc.202400713
X. Zhao, N. Liu, M. Zheng, et al., ACS Energy Lett. 9 (2024) 2748–2757. doi: 10.1021/acsenergylett.4c00976
G.Z. Ramon, B.J. Feinberg, E.M. Hoek, Energy Environ. Sci. 4 (2011) 4423–4434. doi: 10.1039/c1ee01913a
W. Wang, Y. Gang, Z. Hu, et al., Nat. Commun. 11 (2020) 980. doi: 10.1038/s41467-020-14444-4
K. Hurlbutt, S. Wheeler, I. Capone, M. Pasta, Joule 2 (2018) 1950–1960. doi: 10.1016/j.joule.2018.07.017
Y. Xiao, J. Xiao, H. Zhao, et al., Small 20 (2024) 2401957. doi: 10.1002/smll.202401957
G. Kresse, D. Joubert, Phys. Rev. B 59 (1999) 1758–1775.
P.E. Blöchl, Phys. Rev. B 50 (1994) 17953–17979. doi: 10.1103/PhysRevB.50.17953
L. Chen, H. Shao, X. Zhou, et al., Nat. Commun. 7 (2016) 11982. doi: 10.1038/ncomms11982
M. Li, F. Corà, J. Mater. Chem. A 13 (2025) 7207–7214. doi: 10.1039/D4TA07755E
L. Ma, S. Chen, C. Long, et al., Adv. Energy Mater. 9 (2019) 1902446. doi: 10.1002/aenm.201902446
Y. You, X.L. Wu, Y.X. Yin, Y.G. Guo, Energy Environ. Sci. 7 (2014) 1643–1647. doi: 10.1039/C3EE44004D
Y.S. Meng, M.E. Arroyo-de Dompablo, Energy Environ. Sci. 2 (2009) 589–609. doi: 10.1039/b901825e
A.S. Miñarro, M. Villa, B. Casals, et al., Nat. Commun. 15 (2024) 8694. doi: 10.1038/s41467-024-52848-8
L. Zhai, X. She, L. Zhuang, et al., Angew. Chem. Int. Ed. 61 (2022) e202116057. doi: 10.1002/anie.202116057
G. Shen, L. Pan, R. Zhang, et al., Adv. Mater. 32 (2020) 1905988. doi: 10.1002/adma.201905988

Figure 1 (a) The working principle of CFCs with hexacyanoferrate electrodes. (b) The crystal structures of MHCF, Na0.5MHCF, and NaMHCF, and the octahedral structures of FeC6 and MN6.

Figure 2 Density of states of (a) NaMHCF, (b) Na0.5MHCF and (c) MHCF. M: Mn, Ni, Cu and Zn.

Figure 3 Average intercalation voltages of NaxMHCF (M: Mn, Ni, Cu and Zn) and corresponding variation of lattice volume of NaxMHCF (M: Mn, Ni, Cu and Zn) during Na+ intercalation x (x = 0, 0.5, 1): (a) Mn, (b) Ni, (c) Cu, and (d) Zn.

Figure 4 (a) Schematic illustrations of 3d orbitals divided into t2g and eg orbitals under the effect of coordination field. Projected densities of states on Fe and M 3d orbitals of (b) NaMnHCF and Na0.5MnHCF, (c) NaNiHCF and Na0.5NiHCF, (d) NaCuHCF and Na0.5CuHCF, and (e) NaZnHCF and Na0.5ZnHCF. M: Mn, Ni, Cu and Zn.

 扫一扫看文章


扫一扫关注我们
 DownLoad:
 下载:

 下载: