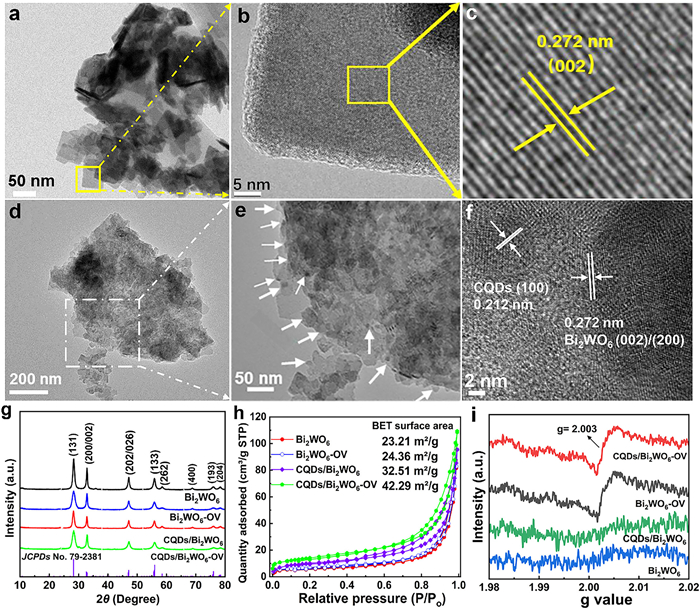
Figure 1.
(a-c) TEM micrographs of pure Bi2WO6 and (d-f) CQDs/Bi2WO6-OV at different magnifications. (g) XRD patterns, (h) N2 adsorption‐desorption isotherms and (i) EPR spectra of various samples.

Modulating the built-in electric field of S-scheme heterojunction via oxygen vacancies for boosting photocatalytic ciprofloxacin degradation
Haitao Ren , Zongcheng Miao , Xiangbo Feng , Abdelkader Labidi , Yuzhen Zhao , Chuanyi Wang


The widespread use of antibiotics in recent years has raised serious environmental and public health concerns [1]. To address this challenge, visible-light-driven photocatalysis has emerged as a potential solution for controlling antibiotic pollution owing to its environmentally benign nature, mild operating conditions, and potent radical-mediated oxidation capacity [2]. Consequently, the rational fabrication of high-performance photocatalysts is crucial for advancing photocatalytic technologies that effectively degrade antibiotics in wastewater systems. In this regard, as a typical bismuth-based photocatalyst, Bi2WO6 possesses a distinctive layered structure, excellent chemical stability, and outstanding visible-light response, exhibiting a great advantage for photocatalytic remediation applications [3,4]. Nevertheless, the severe recombination of photoproduced charges has restricted the photocatalytic efficiency of pure Bi2WO6 [5,6]. In recent years, heterojunction engineering has emerged as an effective approach to address this issue, especially given the growing focus on S-scheme heterojunction photocatalysts [7,8]. The S-scheme heterojunction is typically composed of two semiconductor materials with staggered energy bands. When two materials come into contact, the difference in their Fermi levels causes electron migration at the interface, resulting in band bending and the formation of an internal electric field (IEF). Notably, driven by the IEF, the low-value photogenerated electrons (e-) and holes (h+) undergo recombination, while those with strong redox ability are preserved. Consequently, the S-scheme heterojunction achieves dual functionality: (ⅰ) Significantly promoting the spatial separation of photoproduced e--h+ pairs while (ⅱ) maintaining the strong redox capabilities essential for photocatalytic processes [9,10].
Carbon quantum dots (CQDs), an emerging class of zero-dimensional carbon nanomaterials, exhibit excellent dispersibility, stable chemical structure, tunable optical bandgap, outstanding surface features, and strong light absorption capacity [11,12]. These exceptional properties enable CQDs to offer unique benefits in the development of advanced photocatalytic materials. Recent investigations have revealed that S-scheme heterojunctions can be constructed by coupling CQDs with appropriate semiconductor materials. Recent advances have demonstrated several CQD-based S-scheme heterojunction systems, including N-CQDs/g-C3N4 [13,14], CQDs/Cu2O [15], N-CQDs/TiO2 [16], Yb-MnO2/N-CQDs [17], CQDs/Bi2MoO6 [18] and CQDs/BiOBr [19], all of which have significantly enhanced photocatalytic activity. Despite the significant progress achieved, S-scheme photocatalysts that combine CQDs with semiconductors for antibiotic degradation are still in their nascent stages of development, with considerable potential yet to be harnessed for performance enhancement. Defect engineering, particularly through the introduction of OVs, is recognized as a potential tactic to increase the photocatalytic performance of semiconductor materials [20,21]. OV can not only expand light absorption but also modify the intrinsic bandgap structure of semiconductors, acting as trap centers for photoelectrons to facilitate the transfer/separation of photoproduced charges [22,23]. For example, Zhong et al. enhanced the photocatalytic activity of selective benzene oxidation to phenol by regulating the OV on the TiO2 surface [24]. Notably, while OVs have been extensively studied in single-component semiconductor photocatalysts, the mechanistic understanding of their role in S-scheme heterojunctions as binary photocatalysts remains limited. These observations inspire us to design S-scheme heterojunctions by incorporating OV-modified Bi2WO6 onto CQDs, aiming to improve the photocatalytic removal efficiency of emerging antibiotic contaminants from contaminated water.
Inspired by previous research, we fabricated a 3D nanoflower-shaped CQD/Bi2WO6-OV S-scheme heterojunction photocatalyst through a combination of hydrothermal synthesis and alkaline etching techniques (Fig. S1 in Supporting information). Systematic analyses reveal that the OV introduced in Bi2WO6 augments the Fermi level disparity between Bi2WO6 and the CQDs, facilitating the transfer of more e- from Bi2WO6-OV to the CQDs. This process strengthens the IEF at the interface, thereby improving the separation/transfer of photoproduced charges. In situ XPS, EPR, and density functional theory (DFT) evidence of the S-scheme charge transfer process between Bi2WO6-OV and the CQDs. The optimized catalyst achieves 95.2% CIP degradation within 40 min under visible light (λ > 420 nm), outperforming most reported Bi2WO6-based photocatalysts.
The microstructures of Bi2WO6, CQDs/Bi2WO6, and CQDs/Bi2WO6-OV were examined via scanning electron microscopy (SEM) analysis. The SEM micrographs in Fig. S2a (Supporting information) show that Bi2WO6 has a 3D nanoflower structure made from nanosheets approximately 22 nm thick. The images in Fig. S2b (Supporting information) indicate that, after adding the CQDs, the overall morphology of the CQD/Bi2WO6 composite remains a 3D nanoflower, with no significant change from that of pure Bi2WO6. However, the nanosheet surface appears rougher, likely due to the hydrothermal loading of CQDs onto the Bi2WO6 nanosheets. Owing to their small size, visualizing CQDs with SEM remains challenging. The SEM micrographs in Fig. S2c (Supporting information) show that the microstructure of the CQD/Bi2WO6 composite remained mostly the same after adding OV, implying that the NaOH treatment did not cause significant corrosion. Additionally, Fig. S2d (Supporting information) shows the SEM‒EDS elemental mapping results, confirming a uniform distribution of elements (Bi, W, O and C) in the CQD/Bi2WO6-OV nanocomposite.
The structure of the as-synthesized CQDs was characterized via transmission electron microscopy (TEM) and fluorescence spectroscopy. As depicted in Fig. S3 (Supporting information), the CQDs display a near-spherical morphology without interparticle aggregation and emit intense blue fluorescence under a 365 nm UV lamp. These findings demonstrate that highly crystalline fluorescent CQDs were synthesized via a hydrothermal approach using lignin as the precursor. The TEM micrograph in Fig. 1a shows that pure Bi2WO6 is composed of nanosheets, which aligns with the SEM findings. The HR-TEM micrographs of Bi2WO6 (Figs. 1b and c) reveal distinct lattice fringe spacings of 0.272 nm, assigned to the (002)/(200) crystal planes of Bi2WO6 [25]. Fig. 1d displays TEM images of CQDs/Bi2WO6-OV at various magnifications. Compared with that of pure Bi2WO6, the surface roughness of the CQD/Bi2WO6-OV composite is greater, with many quantum dots (6 nm in diameter) distributed across its surface (Fig. 1e). The HR-TEM image of CQDs/Bi2WO6-OV (Fig. 1f) shows two sets of clear lattice fringes: A spacing of 0.272 nm matching the Bi2WO6 (002)/(200) planes and another fringe with a 0.212 nm spacing associated with the CQD (100) crystal plane [26]. These results provide compelling evidence for the robust interfacial adhesion between the CQDs and Bi2WO6.
The X-ray diffraction (XRD) patterns of all the samples (Fig. 1g) exhibit exclusively Bi2WO6 diffraction peaks, with no observable CQD peaks in the CQD/Bi2WO6 composite, which is likely due to the low CQD loading (<5 wt%). Compared with those of Bi2WO6, distinct D and G bands were observed in the Raman spectra of the CQDs/Bi2WO6 (Fig. S4 in Supporting information), further confirming the formation of CQDs. The N2 adsorption‒desorption isotherms (Fig. 1h) reveal that all the catalysts exhibited a typical type Ⅳ shape, indicating the presence of narrow slit-like macropores and mesopores in the catalyst [27]. The specific surface areas of Bi2WO6, Bi2WO6-OV, CQDs/Bi2WO6, and CQDs/Bi2WO6-OV are 23.21, 24.36, 32.51, and 42.29 m2/g, respectively (Table S1 in Supporting information). The pore size distribution in Fig. S5 (Supporting information) indicates that CQD/Bi2WO6-OV has a narrower pore size distribution. These results demonstrate that incorporating CQDs and OVs onto Bi2WO6 3D nanoflowers increases the specific surface area of the catalyst, which offers more reactive sites for pollutant adsorption and degradation.
Fig. S6 (Supporting information) shows the high-resolution XPS spectra of O 1s and the relative amount of different oxygen species. The O 1s peaks of CQDs/Bi2WO6-OV and Bi2WO6-OV can split into three peaks at 530.2, 531.8, and 533.2 eV, corresponding to lattice oxygen, OVs, and adsorbed oxygen, respectively (Fig. S6a in Supporting information) [28]. The area of the three peaks and the corresponding oxygen species content were calculated through area integration. The semi-quantitative analysis results indicate that compared with Bi2WO6-OV, the relative content of OV in CQD/Bi2WO6-OV is slightly reduced (Fig. S6b in Supporting information), which may be due to the electronic defect states of OV on the surface of Bi2WO6-OV being offset by lone pair electrons of oxygen atoms on the surface of CQDs [29]. EPR spectroscopy was utilized as another powerful technique to confirm the existence of OV. As shown in Fig. 1i, the Bi2WO6-OV and CQD/Bi2WO6-OV nanoflowers exhibit similar EPR signals at g = 2.003, whereas the bare Bi2WO6 and CQD/Bi2WO6 samples present no signal, further indicating the presence of OV in Bi2WO6-OV and CQD/Bi2WO6-OV [30].
The relationship between the loading level of the CQDs (controlled via the lignin precursor dosage) and the photocatalytic efficiency of Bi2WO6 was explored. As presented in Fig. S7 (Supporting information), pristine Bi2WO6 degraded only 60.3% of the CIP after 40 min of visible light illumination. Notably, the CQDs/Bi2WO6–2 prepared with the addition of 140 mg of lignin exhibited the optimal degradation efficiency (80.8%) for CIP. Among them, the first-order rate constant (k = 0.04266 min-1) of CQDs/Bi2WO6–2 is 2.33 times greater than that of pristine Bi2WO6 (k = 0.01834 min-1). These findings demonstrate that introducing a suitable amount of CQDs can improve the photocatalytic degradation performance of Bi2WO6 toward CIP.
The removal efficiency of CIP was further assessed under visible-light irradiation across various catalysts. Fig. 2a shows that the concentration of the CIP solution remains stable under light irradiation without a photocatalyst, indicating the negligible self-photodegradation capability of CIP. Additionally, the CQDs exhibit a limited ability to degrade CIP under visible light. Under the same conditions, the CQD/Bi2WO6 composite exhibits a higher CIP removal efficiency than the original CQDs and Bi2WO6. After further introduction of OVs, the CQD/Bi2WO6-OV composite exhibits optimal photocatalytic activity, achieving 95.2% CIP degradation within 40 min of visible light irradiation. The corresponding rate constants were obtained by fitting the first-order reaction kinetics model (Table S2 in Supporting information). The fitting results are shown in Fig. S8 (Supporting information), which indicates that the photodegradation of CIP is consistent with the first-order reaction kinetics model. As presented in Fig. 2b, the first-order rate constant of CQDs/Bi2WO6-OV for CIP degradation is k = 0.06279 min-1, which is 1.47 times greater than that of CQDs/Bi2WO6 (k = 0.04266 min-1), 3.42 times greater than that of Bi2WO6 (k = 0.01834 min-1), 2.18 times greater than that of Bi2WO6-OV (k = 0.02879 min-1), and 30.78 times greater than that of CQDs (k = 0.00204 min-1). Furthermore, the effects of different catalysts on the mineralization of CIP were evaluated. Fig. S9 (Supporting information) shows that the CQD/Bi2WO6-OV composite achieves 46.83% CIP mineralization within 60 min of visible light illumination, which is 1.63 times greater than that of Bi2WO6-OV (28.66%) and 1.44 times greater than that of CQDs/Bi2WO6 (32.51%). The above results indicate that constructing heterojunctions with CQDs and creating OVs can effectively promote the degradation and mineralization of CIP by CQDs/Bi2WO6-OV under visible light.
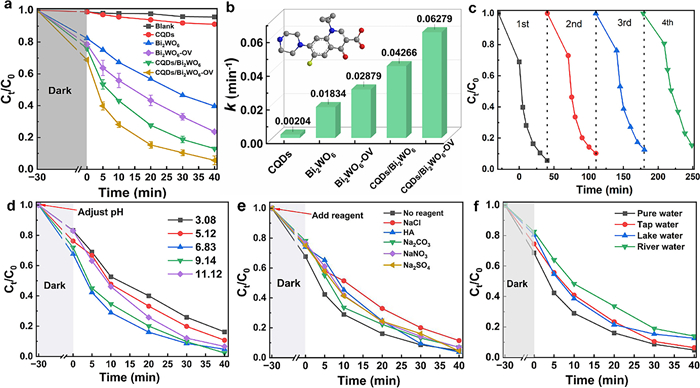
The stability of CQDs/Bi2WO6-OV was evaluated via recycling tests for the photocatalytic degradation of CIP. As evidenced in Fig. 2c, the CIP removal rate slightly decreased with each successive cycle, but remained stable at 84.0% after four cycles under visible light. The XRD patterns (Fig. S10 in Supporting information) before and after use show no change in the characteristic diffraction peaks, confirming the structural integrity of the composite. Moreover, the SEM images (Fig. S11 in Supporting information) reveal that the original morphology of CQDs/Bi2WO6-OV was well preserved after use. To further investigate the reasons for the performance decline of CQDs/Bi2WO6-OV after use. The Fourier transform infrared (FTIR) and XPS spectra of CQDs/Bi2WO6-OV were tested before and after use. The FTIR spectrum of the used sample (Fig. S12a in Supporting information) reveals no positional shift in peak positions but a reduction in intensity, indicating an alteration in its surface chemical state. This finding is supported by XPS analysis, which shows a concomitant attenuation in the intensities of the C 1s, O 1s, Bi 4f, and W 4f signals (Figs. S12b-f in Supporting information). These changes are likely attributable to the partial detachment of CQDs and the filling of surface OVs during the reaction.
Furthermore, the photocatalytic performance of CQDs/Bi2WO6-OV was investigated under various pH values, coexisting anions, humic acid, and real water conditions. As depicted in Fig. 2d, the CQD/Bi2WO6-OV exhibits high photocatalytic efficiency toward CIP within a wide pH range of 6.8‒11.1. Notably, compared with acidic environments (pH 3.08‒5.1), alkaline environments (pH 9.1‒11.1) are more favorable for CIP degradation. This phenomenon may be due to the reduced redox potential of OH-/•OH at higher pH values [31], which facilitates more efficient OH- oxidation by the CQD/Bi2WO6-OV photocatalytic system to generate additional •OH radicals. Fig. 2e shows the effects of the presence of both inorganic salts and humic acid (HA) in water on the photocatalytic degradation performance of CIP. Compared with ultrapure water, common anions (SO42-, NO3-, CO32-, Cl-) and HA have negligible effects on CIP photodegradation, and the total removal rate remains above 88.0% within 40 min. However, they have an impact on the kinetics of the CIP photodegradation reaction, which may result from their competition with CIP for reaction sites on the CQD/Bi2WO6-OV surface, as well as their ability to function as scavengers of active species [32,33]. The impact of actual water bodies on the CIP degradation performance is shown in Fig. 2f. The removal efficiencies of CIP in tap water, lake water, and river water were 93.6%, 87.5% and 86.0%, respectively. Further kinetic analysis (Fig. S13 in Supporting information) indicates that compared to the other three types of water, ultrapure water has a high removal efficiency and the fastest degradation rate for CIP, due to the absence of active species inhibitors in ultrapure water [34]. These findings indicate that CQDs/Bi2WO6-OV have great potential for purifying antibiotic pollutants in actual water bodies.
The light collection ability and band structure of the samples were evaluated via UV‒visible diffuse reflectance spectroscopy (UV‒vis DRS) and XPS valence band (XPS‒VB) analysis. As presented in Fig. 3a, the original Bi2WO6 exhibited excellent photoresponsivity in the range of 200–450 nm. The inherent absorption edge of Bi2WO6 redshifts after the introduction of the CQDs and OVs, indicating an improvement in its utilization efficiency of visible light. Moreover, the band gap energy (Eg) of the catalysts was calculated via the Tauc plot approach based on UV‒vis DRS spectra [35]. As given in Fig. S14 (Supporting information), the Eg of Bi2WO6-OV is 2.58 eV, which is lower than that of the original Bi2WO6 (2.65 eV). According to previous reports, OVs may generate defect levels below the conduction band (CB) of Bi2WO6, thereby shortening the bandgap and expanding the light absorption range [36]. In addition, Fig. 3b shows the UV‒vis DRS of the CQDs, which exhibit significant absorption throughout the visible light range of 200–800 nm, corresponding to a narrow bandgap of 1.88 eV (inset of Fig. 3b). The XPS-VB spectra of the samples were recorded to analyze the band structure. As given in Fig. 3c, the VBxps positions of Bi2WO6, Bi2WO6-OV, and the CQDs were 2.42, 2.22, and 2.48 eV, respectively. The VB position (vs. NHE) was calculated via the following equation: EVB (vs. NHE) = Φ + VBXPS - 4.44 eV, where Φ (4.2 eV) and 4.44 eV are the work functions of the XPS analyzer and the vacuum level, respectively [37]. The VB positions (vs. NHE) of Bi2WO6, Bi2WO6-OV, and the CQDs were calculated to be 2.18, 1.98, and 2.24 V, respectively. Thus, the CB potentials of Bi2WO6, Bi2WO6-OV, and CQDs were determined via the equation: Eg = EVB - ECB, which yielded values of −0.47, −0.60, and 0.36 V (vs. NHE), respectively. Based on these measurements, the band structures of Bi2WO6, Bi2WO6-OV, and the CQDs were determined and are summarized in Fig. S15 (Supporting information).
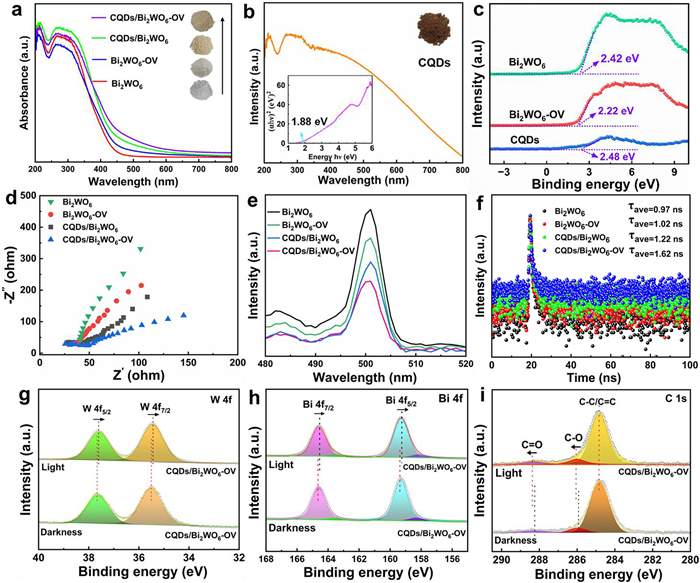
The charge migration/separation kinetics of the photocatalysts were investigated via photoluminescence (PL), electrochemical impedance spectroscopy (EIS), and time-resolved photoluminescence (TRPL). As given in Fig. 3d, compared with the Bi2WO6, Bi2WO6-OV, and CQD/Bi2WO6 heterojunctions, the CQD/Bi2WO6-OV heterojunction has a smaller resistance radius arc under the same conditions, indicating its excellent interface charge transfer ability [38]. The separation kinetics of the photoinduced charges were analyzed through PL and TRPL measurements. As depicted in Fig. 3e, the PL intensities of Bi2WO6-OV and CQDs/Bi2WO6 are significantly lower than that of pure Bi2WO6 after the introduction of CQDs and OV. At the same time, CQDs/Bi2WO6-OV presented the lowest PL signal, indicating that constructing heterojunctions with CQDs and introducing OVs can promote the effective separation of photogenerated charges [39]. In addition, TRPL analysis (Fig. 3f and Table S3 in Supporting information) reveals that, compared with Bi2WO6 (τavg: 0.97 ns), Bi2WO6-OV (τavg: 1.02 ns), and CQDs/Bi2WO6 (τavg: 1.22 ns), the CQDs/Bi2WO6-OV had a longer carrier lifetime (τavg: 1.62 ns), demonstrating the significant enhancement of space charge separation in CQDs/Bi2WO6-OV [40]. Therefore, the photogenerated charges in the CQD/Bi2WO6-OV composites can be maximally utilized for photocatalytic reactions.
The charge transfer direction between the CQDs and Bi2WO6-OV was determined via in situ irradiation XPS. Before analysis, all the XPS spectra were energy-calibrated with the adventitious carbon C 1s peak set at 284.8 eV as an internal reference. As given in Fig. 3g, the two peaks of the W 4f orbital in CQDs/Bi2WO6-OV are ascribed to the binding energies of W 4f5/2 and W 4f7/2, respectively [41]. Under light irradiation, these peaks shift toward lower binding energies, confirming the accumulation of e- in Bi2WO6-OV. Similar trends were recorded in the in situ XPS spectra of Bi 4f (Fig. 3h). The C 1s XPS spectrum (Fig. 3i) reveals three characteristic peaks at 284.8, 285.9, and 288.2 eV, corresponding to C-C/C═C, C-O, and C═O bonds, respectively, which are consistent with the typical chemical structure of CQDs. Notably, these peaks shift toward higher binding energies under light irradiation [42]. The in situ XPS results strongly confirmed that the photogenerated e- transferred from the CQDs to Bi2WO6-OV.
Additionally, ultraviolet photoelectron spectroscopy (UPS) was employed to determine the work functions (Φs) of Bi2WO6, Bi2WO6-OV, and the CQDs [43]. The cutoff edges (Ecutoff) of Bi2WO6, Bi2WO6-OV and the CQDs are located at 16.11, 16.72 and 15.51 eV, respectively (Fig. S16 in Supporting information). The Φ values of Bi2WO6, Bi2WO6-OV and CQDs can be calculated to be 5.11, 4.50 and 5.71 eV, respectively, via the following equation: Φ = hν - Ecutoff, where hν denotes the energy of the incident photon (21.22 eV) [44,45]. Furthermore, the Fermi levels (Ef) of Bi2WO6, Bi2WO6-OV and the CQDs are calculated to be −5.11, −4.5 and −5.71 eV, respectively, by applying the equation Φ = Ev - Ef, where Ev represents the potential of the vacuum (0 eV). The different Φ values between two semiconductors are the key factors for charge transfer at the semiconductor interface. The greater the difference in Φ between the two semiconductors is, the stronger the IEF at the interface, and the higher the efficiency of interface charge transfer [46,47]. Obviously, after introducing OVs into Bi2WO6, the Φ of Bi2WO6-OV decreases, leading to an increase in Ef. The Φ difference between the CQDs and Bi2WO6 is 0.6 eV, whereas that between the CQDs and Bi2WO6-OV increases to 1.21 eV. Therefore, the introduction of OVs modulated the diameter of Bi2WO6, increased the diameter difference between the CQDs and Bi2WO6, provided a stronger driving force for interface charge transfer, and enhanced the performance of the CQD/Bi2WO6-OV S-scheme heterojunction in degrading CIP. As presented in Fig. S17 (Supporting information), the Ef of Bi2WO6-OV is greater than that of the CQDs. In close contact, e- spontaneously transfers from Bi2WO6-OV to the CQDs until Ef at the interface reaches equilibrium. Simultaneously, the energy band of Bi2WO6-OV that loses e- bends upward, whereas the energy band of the CQDs that gain e- bends downward. The e- depletion layer and e- accumulation layer are formed in Bi2WO6-OV and CQDs, respectively, resulting in IEF and band bending from Bi2WO6-OV to the CQD direction in the space charge layer. During photoexcitation, the photoproduced e- in the CB of the CQDs spontaneously migrates toward Bi2WO6-OV and recombines with h+ in the VB of Bi2WO6-OV. The electron-rich Bi2WO6-OV serves as the reduction reaction site, whereas the hole-rich CQDs serve as the oxidation reaction site. The constructed S-scheme heterojunction between the CQDs and Bi2WO6-OV synergistically promotes the spatial separation of photoexcited e--h+ pairs while maintaining their high redox potentials.
To elucidate the charge transfer mechanism, the 3D charge density differences of CQDs/Bi2WO6-OV and CQDs/Bi2WO6 were computed via DFT. Figs. 4a, b, d and e denote the charge density differences of CQDs/Bi2WO6 and CQDs/Bi2WO6-OV, respectively. Blue and yellow refer to the charge depletion and accumulation regions, respectively. e- are readily transferred from the Bi2WO6 and Bi2WO6-OV sides to the CQD side through the heterojunction interface, leading to a positive charge on the Bi2WO6 and Bi2WO6-OV sides near the interface and a negative charge on the CQD side. The redistribution of charges results in the generation of IEF from Bi2WO6 and Bi2WO6-OV to the CQDs near the interface, which aligns with the results of the work function and in situ XPS. Notably, the CQD/Bi2WO6-OV system results in a stronger charge density difference than the CQD/Bi2WO6 system does, resulting in an enhanced IEF effect at the CQD/Bi2WO6-OV interface due to the modification of OV, effectively increasing the spatial separation/transfer of photoproduced charges. Bader charge analysis revealed that the number of free electrons transferred from Bi2WO6 and Bi2WO6-OV to the CQDs was 0.74 e and 1.06 e, respectively (the fundamental charge), which further supports the above conclusion. As depicted in Figs. 4c and f, the planar average charge density difference of CQDs/Bi2WO6-OV along the z-axis is positive for the CQDs and negative for Bi2WO6-OV, further confirming e- migration from Bi2WO6-OV to the CQDs under nonilluminated conditions. Moreover, the planar average charge density difference along the z-axis of CQDs/Bi2WO6-OV is significantly greater than that of CQDs/Bi2WO6, which is in good agreement with the charge density difference analysis. These findings provide clear evidence for both an S-scheme charge transfer pathway and a strengthened IEF in the CQD/Bi2WO6-OV composite.
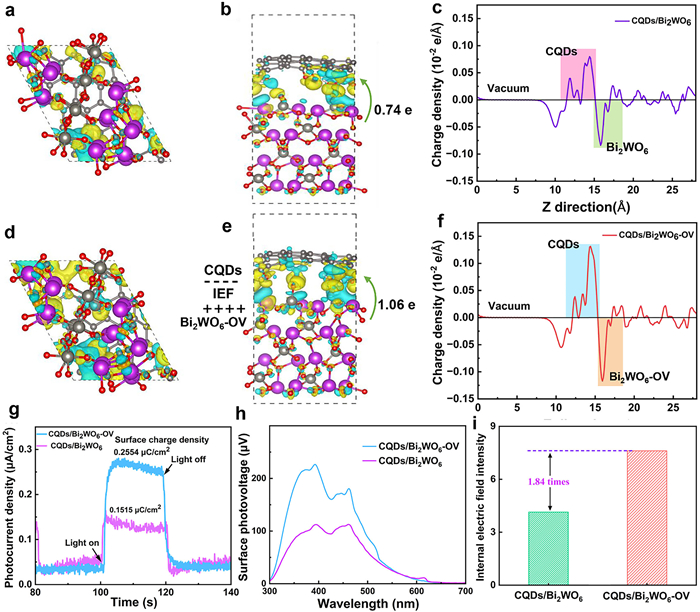
Typically, the intensity of the IEF serves as a key kinetic factor governing charge separation, making its quantitative evaluation an essential step. According to the theory proposed by Kanata et al., the IEF of a given material shows a monotonic positive correlation with both its surface charge density and surface photovoltage [48]. Notably, the CQD/Bi2WO6-OV sample achieves a high surface charge density of 0.2554 µC/cm2, as determined by transient photocurrent measurements (Fig. 4g). Steady-state surface photovoltage (SPV) measurements revealed a significant surface potential of 227.1 µV for CQDs/Bi2WO6-OV (Fig. 4h). These results further demonstrate that the CQD/Bi2WO6-OV heterostructure has an enhanced photogenerated charge separation efficiency compared with its CQD/Bi2WO6 counterpart [49]. According to the surface charge density and surface photovoltage results (Table S4 in Supporting information), the IEF intensity of CQDs/Bi2WO6-OV is 1.84 times greater than that of CQDs/Bi2WO6 (Fig. 4i). As a result of the enhanced IEF and well-designed S-scheme heterojunction in CQDs/Bi2WO6-OV, highly efficient charge migration and separation can be achieved.
The reactive species generated by CQDs/Bi2WO6-OV during the photocatalytic process were identified via in situ EPR. As presented in Figs. 5a and b, the CQD/Bi2WO6-OV does not exhibit DMPO-•OH or DMPO-•O2- characteristic signals under dark conditions. A distinct four-line DMPO-•OH signal with a 1:2:2:1 intensity ratio and six intense lines of DMPO-•O2- were observed under visible light, confirming the generation of •OH and •O2- radicals. As the irradiation time increased, the increasing peak intensities of the DMPO-•OH and DMPO-•O2- signals increased, indicating a corresponding increase in the concentration of these two free radicals. These findings demonstrate that the constructed CQD/Bi2WO6-OV S-scheme heterojunction facilitates visible-light-driven generation of •OH and •O2- radicals, which are primarily responsible for CIP degradation via oxidative cleavage. Reactive species quenching experiments were performed to assess the contributions of •OH, •O2-, and h+ to the photocatalytic removal of CIP by CQDs/Bi2WO6-OV. As given in Fig. 5c, the addition of L-ascorbic acid (AA) significantly inhibited CIP degradation, revealing that •O2− was the primary reactive species for the photocatalytic removal of CIP. Moreover, the addition of Na2C2O4 (h+ scavenger) and isopropanol (IPA, •OH scavenger) also inhibited CIP degradation to some extent, confirming the secondary roles of h+ and •OH in the photocatalytic process. The corresponding rate constants were obtained by fitting the first-order reaction kinetics model (Fig. S18 in Supporting information). Furthermore, compared with the quencher-free system, the addition of AA, Na2C2O4, and IPA reduced the reaction rate constants for CIP removal to 0.00553, 0.02414, and 0.03799 min-1, respectively (Fig. 5d). This further indicates that •O2− is the main reactive species for CIP degradation, followed by •OH and h+.
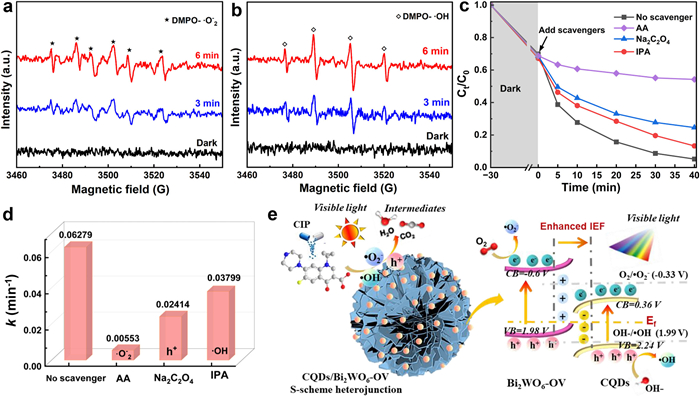
Based on experimental analysis and theoretical calculations, the photocatalytic mechanism of the CQD/Bi2WO6-OV heterojunction for CIP degradation was further investigated. As revealed in Fig. 5e, the e- in the CQDs and Bi2WO6-OV transitions from their respective VB to CB under irradiation with light. Under IEF driving, e- in the CB of the CQDs recombines with h+ in the VB of Bi2WO6-OV, whereas highly reactive h+ and e- are retained in the CQD/Bi2WO6-OV heterojunction. The VB potential of the CQDs is more positive than that of OH-/•OH (1.99 V vs. NHE) [50], and the CB potential of Bi2WO6-OV is more negative than that of O2/•O2- (−0.33 V vs. NHE) [51]. Under these conditions, the h+ in the VB of the CQDs can oxidize OH- to generate •OH, and the e- in the CB of Bi2WO6-OV can reduce O2 to form •O2-. Consequently, an S-scheme heterojunction is successfully constructed between the CQDs and Bi2WO6-OV, which simultaneously facilitates (ⅰ) efficient separation and directional migration of photoinduced charges and (ⅱ) abundant production of •O2- and •OH radicals.
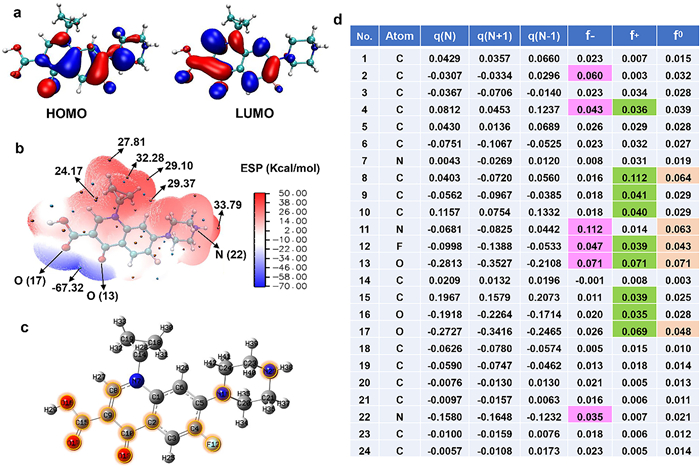
DFT calculations based on the Fukui function were adopted to investigate the removal pathways of CIP. The optimized structure of the CIP is presented in Fig. 6c. Typically, the highest occupied molecular orbital (HOMO) and lowest unoccupied molecular orbital (LUMO) identify the sites prone to electrophilic and nucleophilic reactions in photocatalytic processes [52]. As displayed in Fig. 6a, the HOMO orbitals of CIP are predominantly situated at C10, C2, C4, C5, and O13 atoms, whereas the LUMO orbitals are mainly found at C15, C8, C6, C3, C5, and N11 atoms. Moreover, the electrostatic potential (ESP) mapping of CIP reveals distinct charge localization, with strongly negative potentials concentrated at the O13 and O17 sites, whereas the N7, N22, and C14 regions exhibit significant positive potentials (Fig. 6b). Although these results indicate probable reactive sites, HOMO‒LUMO and ESP analyses alone are insufficient for the quantitative evaluation of reactive sites. Therefore, the Fukui function of CIP was used to quantify its local reactivity. As depicted in Fig. 6d, the C8, O17, N11, and O13 atoms have high f0 values and are susceptible to •OH attack; the C2, O13, N22, F12, and C4 atoms have higher f- values and are vulnerable to h+ and 1O2 assaults; and the C4, C10, C9, O13, and O17 positions have high f+ values and are prone to preferential attacks from •O2-.
LC‒MS technology was utilized to identify potential degradation intermediates of CIP, as illustrated in Fig. S19 (Supporting information). Based on the above DFT calculations and LC‒MS findings, three plausible pathways for CIP degradation were proposed. As revealed in Fig. 7a, the removal process of CIP essentially involves cleavage of the piperazine ring, F-substitution, depropylation, defluorination, and decarboxylation, among other steps. In pathway Ⅰ, CIP (m/z 332) undergoes initial attack by •O2- and •OH, resulting in cleavage and opening of the piperazine ring to generate P1 (m/z 334) and P2 (m/z 262). P2 is subsequently attacked by h+ and •O2-, triggering defluorination and depropylation to yield P3 (m/z 243) and P4 (m/z 205) [53]. In pathway Ⅱ, CIP (m/z 332) undergoes decarboxylation via •O2- attack to generate P6 (m/z 286). Then, P6 undergoes tetrahydropyridine ring cleavage under combined •O2- and •OH attacks, yielding P7 (m/z 262), followed by C‒N bond cleavage of P7 to form P8 (m/z 179) [54]. In pathway Ⅲ, CIP (m/z 332) undergoes h+-mediated piperazine ring oxidation and cleavage to produce P10 (m/z 361). P10 is subsequently attacked by h+ and •O2-, followed by hydrolysis to yield P11 (m/z 334) [55]. Then, P11 is converted to P12 (m/z 261) via amination and fluorine substitution reactions. Thereafter, P12 undergoes deamination and ring opening, affording P13 (m/z 197) and P14 (m/z 166). Finally, these intermediates are further oxidized to nontoxic small molecules via the combined action of •O2-, •OH, and h+, with some mineralized into CO2 and H2O.
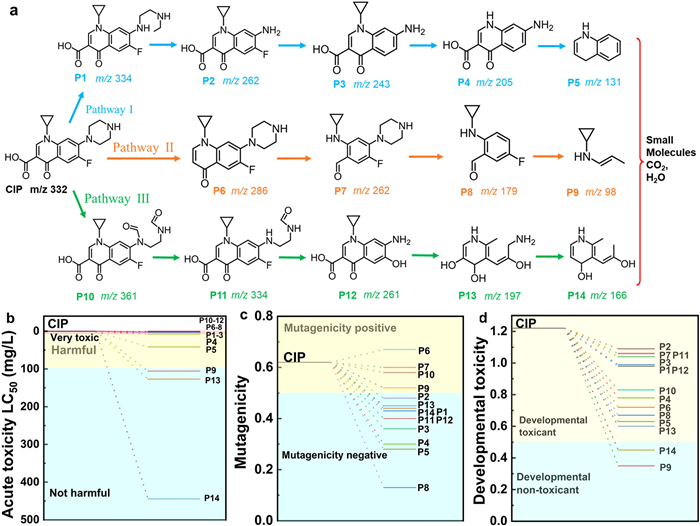
The toxicity of CIP and its intermediates was assessed via the Toxicity Estimation Software Tool (T.E.S.T.) based on QSAR modeling. Fig. 7b shows the evolution of acute toxicity for CIP and its degradation intermediates during photodegradation, with nearly all the transformation products exhibiting elevated LC50 values relative to those of CIP. Among them, three degradation products (P9, P13, and P14) presented significantly higher LC50 values (>100 mg/L) than did CIP, demonstrating an order-of-magnitude decrease in acute toxicity. As presented in Fig. 7c, a similar phenomenon regarding mutagenicity is observed. Except for product P6, which is more mutagenic than CIP, the mutagenicity of the other products is lower than that of CIP. Notably, products P1, P13, P11, P14, P12, P3, P4, P5, P8, and P13 show no detectable mutagenicity. Fig. 7d further demonstrates that all the intermediates exhibit reduced developmental toxicity compared with that of CIP, with products P14 and P9 showing no detectable toxicity. The results demonstrate that the developed CQDs/Bi2WO6-OV can effectively reduce the toxicity of CIP and its byproducts under visible light illumination.
Furthermore, the ecological toxicity of the solution following CIP degradation by CQDs/Bi2WO6-OV was assessed using mung bean sprout cultivation experiments. In these experiments, mung beans were soaked in 30 mL of tap water, a raw CIP solution (20 mg/L), and a treated CIP solution. After 7 days of cultivation at a constant temperature of 25 ℃, the growth results (Fig. S20 in Supporting information) reveal that the CIP solution significantly inhibited mung bean growth. In contrast, the mung beans in the treated CIP solution germinated successfully and grew well, indicating that the CQDs/Bi2WO6-OV can effectively reduce the ecological toxicity of the CIP solution with the assistance of visible light. Notably, the length of the bean sprouts in the treatment group is slightly shorter than that in the tap water control. This slight difference indicates that trace amounts of toxic intermediates still exist in the CIP solution after 40 min of photodegradation, implying that a longer irradiation time is necessary to achieve complete detoxification.
In summary, we synthesized a novel 3D nanoflower-structured CQD/Bi2WO6-OV S-scheme heterojunction, which demonstrates favorable visible-light photocatalytic activity with a 95.2% CIP removal rate, outperforming most reported similar catalysts. Kinetic analysis revealed that the first-order rate constant k of CQDs/Bi2WO6-OV for CIP degradation was 3.4- and 30.8-fold greater than that of Bi2WO6 and CQDs, respectively. DFT calculations and UPS analysis indicate that the introduction of a moderate OV in the CQD/Bi2WO6-OV S-scheme heterojunction increases the Fermi level difference between Bi2WO6 and the CQDs. These findings indicate that more electrons are transferred from Bi2WO6-OV to the CQDs, resulting in a strengthened IEF at their interface, which enhances the separation of the photoproduced charge carriers. In situ XPS and EPR further confirmed the establishment of an S-scheme charge migration pathway between the CQDs and Bi2WO6-OV, promoting the generation of •OH and •O2- radicals and the photodegradation of CIP. Moreover, three potential degradation pathways of CIP were elucidated via LC‒MS and the Fukui index. The T.E.S.T. analysis predicts low toxicity of the intermediates, confirming that the CQD/Bi2WO6-OV S-scheme heterojunction effectively mitigates the ecological risk of CIP by minimizing the number of heterocyclic groups. This work provides insights into the design of advanced S-scheme heterojunctions with robust IEF to achieve superior charge separation and environmental remediation.
Haitao Ren: Writing – original draft, Funding acquisition, Formal analysis, Data curation. Zongcheng Miao: Resources, Methodology. Xiangbo Feng: Investigation. Abdelkader Labidi: Writing – original draft. Yuzhen Zhao: Visualization, Conceptualization. Chuanyi Wang: Writing – original draft, Supervision, Project administration.
The authors declare that they have no known competing financial interests or personal relationships that could have appeared to influence the work reported in this paper.
This study was supported by the SAFEA of China (“Belt and Road” Innovative Exchange Foreign Expert Project, DL2023041004L), the Natural Science Basic Research Program of Shaanxi (No. 2025JC-YBQN-149) and the Xijing University Special Fund for High-Level Talents (No. XJ24B20).
Supplementary material associated with this article can be found, in the online version, at doi:
Y. Lu, X. Zhou, Y. Zheng, et al., Water Res. 275 (2025) 123179. doi: 10.1016/j.watres.2025.123179
W.W. Chen, F.F. Huang, Q.Y. Qu, et al., Rare Met. 44 (2025) 3970–3980. doi: 10.1007/s12598-024-03174-x
W. Mao, X. Shen, L. Zhang, et al., Front. Environ. Sci. Eng. 18 (2024) 86. doi: 10.1007/s11783-024-1846-x
B. Li, X. Liu, H. Zhu, et al., Small 20 (2024) 2406074. doi: 10.1002/smll.202406074
S. Li, M. Cai, Y. Liu, et al., Chin. J. Catal. 43 (2022) 2652–2664. doi: 10.1016/S1872-2067(22)64106-8
X. Ning, A. Hao, X. Qiu, et al., Adv. Funct. Mater. 35 (2025) 2413217. doi: 10.1002/adfm.202413217
H. Ren, Z. Miao, Y. Zhao, et al., J. Alloy Compd. 1028 (2025) 180646. doi: 10.1016/j.jallcom.2025.180646
X. Li, Y. Wan, F. Deng, et al., Chin. Chem. Lett. 36 (2025) 111418. doi: 10.1016/j.cclet.2025.111418
L. Zhang, J. Zhang, J. Yu, et al., Nat. Rev. Chem. 9 (2025) 328–342. doi: 10.1038/s41570-025-00698-3
L. Sun, W. Yan, W. Wang, et al., Angew. Chem. Int. Ed. 137 (2025) e202511080. doi: 10.1002/ange.202511080
J. Zhao, C. Li, X. Du, et al., Small 18 (2022) 2200744. doi: 10.1002/smll.202200744
P. Wang, C. Chen, H. Ren, et al., Chin. Chem. Lett. 36 (2025) 110725. doi: 10.1016/j.cclet.2024.110725
X. Li, Q. Luo, L. Han, et al., J. Mater. Sci. Technol. 114 (2022) 222–232. doi: 10.1016/j.jmst.2021.10.030
Y. Xu, W. Hou, K. Huang, et al., Adv. Sci. 11 (2024) 2403607. doi: 10.1002/advs.202403607
J. Wang, S. Li, P. Ma, et al., Colloids Surf. A 690 (2024) 133779. doi: 10.1016/j.colsurfa.2024.133779
M. Karaca, Z. Eroğlu, O. Ağığlı, et al., ACS Omega 8 (2023) 26597–26609. doi: 10.1021/acsomega.3c03532
Z. Chen, D. Yang, Z. Liang, et al., Chem. Eng. J. 474 (2023) 145978. doi: 10.1016/j.cej.2023.145978
J. Liu, L. Ji, Q. He, et al., Sep. Purif. Technol. 363 (2025) 132196. doi: 10.1016/j.seppur.2025.132196
Y. Liu, X. Zhang, X. Li, et al., J. Water Process. Eng. 57 (2024) 104588. doi: 10.1016/j.jwpe.2023.104588
H. Li, J. Li, Z. Ai, et al., Angew. Chem. Int. Ed. 57 (2018) 122. doi: 10.1002/anie.201705628
H. Jiang, L. Wang, X. Yu, et al., Chem. Eng. J. 466 (2023) 143129. doi: 10.1016/j.cej.2023.143129
C. Yang, J. Zhang, G. Yu, et al., Adv. Energy Mater. 15 (2025) 2403713. doi: 10.1002/aenm.202403713
S. Gao, R. Wu, M. Sun, et al., Appl. Catal. B: Environ. 324 (2023) 122260. doi: 10.1016/j.apcatb.2022.122260
S. Zhong, D. Yu, Y. Ma, et al., Angew. Chem. Int. Ed. 25 (2025) e202502823. doi: 10.1002/anie.202502823
L. Liu, J. Liu, K. Sun, et al., Chem. Eng. J. 411 (2021) 128629. doi: 10.1016/j.cej.2021.128629
Y. Quan, B. Wang, G. Liu, et al., Chem. Eng. Sci. 232 (2021) 116338. doi: 10.1016/j.ces.2020.116338
Q. Wang, R. Zhao, H. Li, et al., Sep. Purif. Technol. 359 (2025) 130546. doi: 10.1016/j.seppur.2024.130546
X. Li, Q. Liu, F. Deng, et al., Appl. Catal. B: Environ. 314 (2022) 121502. doi: 10.1016/j.apcatb.2022.121502
X. Li, B. Kang, F. Dong, et al., Nano Energy 81 (2021) 105671. doi: 10.1016/j.nanoen.2020.105671
F. Xu, Y. He, J. Zhang, et al., Angew. Chem. Int. Ed. 64 (2025) e202414672. doi: 10.1002/anie.202414672
S. Zhou, L. Jiang, H. Wang, et al., Adv. Funct. Mater. 33 (2023) 2307702. doi: 10.1002/adfm.202307702
X. Yang, H. Sun, G. Li, et al., Appl. Catal. B: Environ. 294 (2021) 120252. doi: 10.1016/j.apcatb.2021.120252
R. Chen, L. Li, Y. Gong, et al., J. Mater. Sci. Technol. 202 (2024) 67–81. doi: 10.1016/j.jmst.2024.02.080
J. Guo, H. Sun, X. Yuan, et al., Water Res. 219 (2022) 118558. doi: 10.1016/j.watres.2022.118558
S.D. Wang, L.Y. Huang, L.J. Xue, et al., Appl. Catal. B: Environ. 358 (2024) 124366. doi: 10.1016/j.apcatb.2024.124366
A. Mariappan, P. Mannu, T. Thiruppathiraja, et al., Chem. Eng. J. 476 (2023) 146720. doi: 10.1016/j.cej.2023.146720
Y. Meng, J. Li, H. Liu, et al., Small Methods 9 (2025) 2401510. doi: 10.1002/smtd.202401510
D. Zu, Y. Ying, Q. Wei, et al., Angew. Chem. Int. Ed. 63 (2024) e202405756. doi: 10.1002/anie.202405756
J. Wang, S. He, M. Zhang, et al., Adv. Energy Mater. 4 (2025) 2406048.
S. Li, M. Cai, Y. Liu, et al., Adv. Powder Mater. 2 (2023) 100073. doi: 10.1016/j.apmate.2022.100073
Y. Feng, D. Chen, Y. Zhong, et al., ACS Appl. Mater. Interfaces 15 (2023) 9221–9230. doi: 10.1021/acsami.2c19703
A. Wang, W. Hong, L. Li, et al., Energy Storage Mater. 44 (2022) 145–155. doi: 10.1016/j.ensm.2021.10.019
S. Li, C. You, F. Yang, et al., Chin. J. Catal. 68 (2025) 259–271. doi: 10.1016/S1872-2067(24)60181-6
L. Yuan, C. Tang, P. Du, et al., Angew. Chem. Int. Ed. 36 (2024) e202412340. doi: 10.1002/anie.202412340
X. Xia, Y. Jia, W. Wang, et al., J. Mater. Sci. Technol. 236 (2025) 301–309. doi: 10.1016/j.jmst.2024.12.093
J. Zhu, Q. Bi, Y. Tao, et al., Adv. Funct. Mater. 33 (2023) 2213131. doi: 10.1002/adfm.202213131
X. Wang, X. Wang, J. Huang, et al., Nat. Commun. 12 (2021) 4112. doi: 10.1038/s41467-021-24511-z
D. Liu, X. Yang, P. Chen, et al., Adv. Mater. 35 (2023) 2300655. doi: 10.1002/adma.202300655
L. Sun, X. Yu, L. Tang, et al., Chin. J. Catal. 52 (2023) 164–175. doi: 10.1016/S1872-2067(23)64507-3
Y. Zhong, S. Ma, D. Chen, et al., Water Res. 258 (2024) 121774. doi: 10.1016/j.watres.2024.121774
Y. Ai, J. Hu, X. Xiong, et al., Appl. Catal. B: Environ. 353 (2024) 124098. doi: 10.1016/j.apcatb.2024.124098
S.B. Prasanna, A.A. Jagtap, S. Ramanathan, et al., Chem. Eng. J. 505 (2025) 159579. doi: 10.1016/j.cej.2025.159579
V.D. Dang, J.A. Jr, T. Annadurai, et al., Chem. Eng. J. 422 (2021) 130103. doi: 10.1016/j.cej.2021.130103
C. Li, B. Cheng, J. Shen, et al., Sep. Purif. Technol. 360 (2025) 131116. doi: 10.1016/j.seppur.2024.131116
D. Liu, L. Jiang, D. Chen, et al., Chem. Eng. J. 482 (2024) 149165. doi: 10.1016/j.cej.2024.149165

Figure 1 (a-c) TEM micrographs of pure Bi2WO6 and (d-f) CQDs/Bi2WO6-OV at different magnifications. (g) XRD patterns, (h) N2 adsorption‐desorption isotherms and (i) EPR spectra of various samples.

Figure 2 (a) Photocatalytic removal and (b) first-order rate constants of CIP by various catalysts under visible light exposure. (c) Cycling tests of CQDs/Bi2WO6-OV for CIP degradation. (d) Impact of pH on CIP removal, (e) degradation of CIP in the presence of distinct inorganic ions and HA, (f) degradation of CIP in various water sources.

Figure 3 UV‒vis DRS of (a) Bi2WO6-based catalyst and (b) CQDs. (c) XPS-VB spectra of Bi2WO6, Bi2WO6-OV and CQDs. (d) EIS spectra, (e) PL spectra and (f) TRPL measurements of different samples. In situ irradiated XPS for (g) W 4f, (h) Bi 4f and (i) C 1s of CQDs/Bi2WO6-OV in the dark or under visible light exposure.

Figure 4 Top view (a, d) and side view (b, e) of the charge density difference, plane average charge density difference Δρ (z) (c, f) of CQDs/Bi2WO6 and CQDs/Bi2WO6-OV. (g) Transient photocurrent density, (h) SPV and (i) IEF intensity of CQDs/Bi2WO6 and CQDs/Bi2WO6-OV.

Figure 5 EPR peaks of (a) DMPO-•O2- and (b) DMPO-•OH. (c) Trapping experiments for the removal of CIP over CQDs/Bi2WO6-OV. (d) Effect of different scavengers on the reaction rate constants. (e) Potential mechanism of CQDs/Bi2WO6-OV for CIP photodegradation.

Figure 6 (a) HOMO and LUMO, (b) ESP mapping, (c) optimized structure and (d) Fukui index of CIP.

 扫一扫看文章


扫一扫关注我们
 DownLoad:
 下载:
下载:

 下载:
下载: