
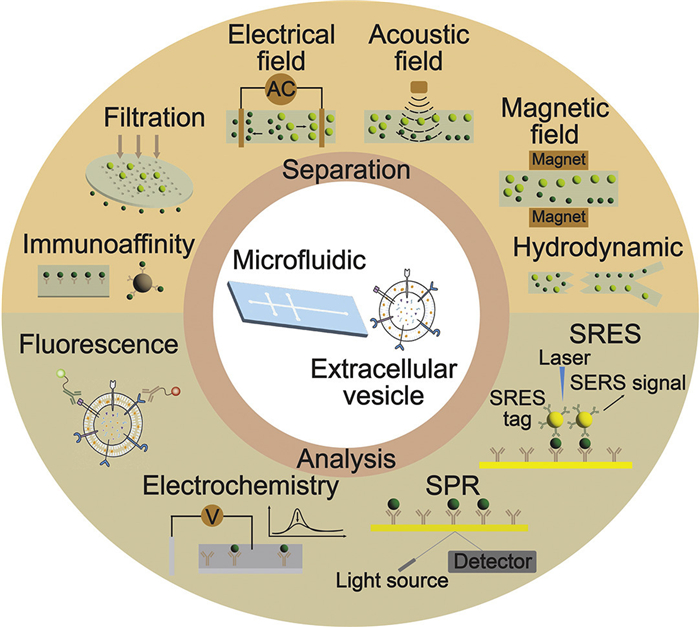
Figure 1.
Microfluidic-based methods for the separation and analysis of EVs.


Extracellular vesicles (EVs) released from cells are particles encapsulated by lipid bilayers and present in various body fluids such as blood, urine, and saliva [1,2]. According to different biogenesis and physiological characteristics, EVs are mainly classified into three types: exosomes (50–150 nm), microvesicles (100–1000 nm), and apoptotic bodies (100–5000 nm) [3,4]. EVs contain proteins, lipids, DNA and RNA from parental cells and play a critical role in mediating and regulating biological processes such as intercellular communication and signaling [5–7]. Due to their widespread presence in body fluids, EVs have emerged as potential biomarkers in disease diagnosis [8–10]. EVs are also used as vehicles to deliver drugs to specific cells or tissues to treat diseases [11–13]. Therefore, it is essential to separate and analyse EVs in EV-based scientific research and clinical applications [14–16]. However, due to their small size and coexistence with contaminants (proteins, nucleic acids, etc.), isolation and analysis of EVs from complex body fluids remain challenging [17–19].
Ultracentrifugation (UC) is considered to be the gold standard for separating EVs. Different sizes of EVs (103–105 g) are gradually separated from body fluids by adjusting the rotational speed. UC requires expensive instrumentation and long processing times, and there are still problems such as low EV yield, contamination of protein aggregates, and EV damage [20,21]. Ultrafiltration (UF) allows simple and rapid separation of specific sized EVs, but has problems with membrane blockage and loss of small EVs [22]. Size-exclusion chromatography (SEC) utilizes the difference in elution speed of different sized particles in the column to separate EVs. SEC has the advantage that the collected EVs are morphologically and functionally intact, but it requires special equipment [23]. Precipitation, which separates EVs by adding polymers to change the dispersibility of EVs, is a simple and relatively inexpensive method, but the purity of the EVs is insufficient [24]. Immunoaffinity capture isolates sub-population EVs with specific surface proteins, but this method requires expensive reagents [25]. Thus, novel techniques need to be developed to efficiently separate and analyse EVs.
Microfluidic technologies enable the manipulation of small volumes of liquid in microchannels, providing new strategies for the separation and analysis of EVs [26–28]. Microfluidics has many advantages compared with conventional methods, such as low sample consumption, high yield, low cost, precise fluidic control and automation [29,30]. These microfluidic-based EV separation methods are integrated with downstream analytical techniques to provide powerful tools for life science research and clinical diagnostics related to EVs.
In this review, we present recent advances in microfluidic-based methods for the separation and analysis of EVs. Fig. 1 shows the currently popular microfluidic methods for EV separation and detection. A comprehensive overview of microfluidic-based methods for EV separation is provided in terms of label-free and affinity-based separation strategies. Then, microfluidics-based EV detection techniques are summarized. We also concluded the single-cell EV analysis method based on the microfluidic platform. Finally, challenges and future prospects of microfluidics in the separation and analysis of EVs are emphasized.
The separation of EVs is a significant step for EV-related research. Microfluidics utilizes differences in the physical properties (size or density, etc.) or biological properties (proteins or lipids, etc.) of EVs to separate EVs from contaminant-containing biological samples. The main microfluidic-based separation techniques for EVs are filtration, deterministic lateral displacement, hydrodynamic separation, pinched flow fractionation, asymmetric flow field-flow fractionation, field separation (electrical, acoustic and magnetic separation), and affinity-based separation (proteins and lipids). These methods utilize various mechanisms to isolate EV subpopulations based on size or protein markers, which are applied in cell biology research and disease diagnosis. Table 1 summarizes advanced microfluidic platforms based on different principles for obtaining high yields and purity of EVs from biological fluids.

 DownLoad:
CSV
DownLoad:
CSV
| Methods | Sample | Recovery | Protein removal | Advantages | Limitations | Ref. | ||||||||||||||||||||||||||||||||||||||||||||||||||||||||||||||||||||||||||||||||||||||||||||||||
| Filtration | Blood | 74.7% | NA | Simple, high recovery | Risk of filter membrane clogging | [34] | ||||||||||||||||||||||||||||||||||||||||||||||||||||||||||||||||||||||||||||||||||||||||||||||||
| Plasma | 80% | 97% | [40] | |||||||||||||||||||||||||||||||||||||||||||||||||||||||||||||||||||||||||||||||||||||||||||||||||||
| Serum | 90% | 88.7% | [35] | |||||||||||||||||||||||||||||||||||||||||||||||||||||||||||||||||||||||||||||||||||||||||||||||||||
| Blood | 10.5% | 95% | [38] | |||||||||||||||||||||||||||||||||||||||||||||||||||||||||||||||||||||||||||||||||||||||||||||||||||
| Deterministic lateral displacement | Urine, serum | 50% | NA | High size resolution, gentle | Complicated fabrication, clogging | [46] | ||||||||||||||||||||||||||||||||||||||||||||||||||||||||||||||||||||||||||||||||||||||||||||||||
| Inertial and viscoelastic microfluidics | Plasma | NA | NA | High throughput, simple device | Polymer addition, protein contamination | [49] | ||||||||||||||||||||||||||||||||||||||||||||||||||||||||||||||||||||||||||||||||||||||||||||||||
| Blood | 87% | NA | [55] | |||||||||||||||||||||||||||||||||||||||||||||||||||||||||||||||||||||||||||||||||||||||||||||||||||
| Serum, cell culture medium | 70.6% | 91.4% | [54] | |||||||||||||||||||||||||||||||||||||||||||||||||||||||||||||||||||||||||||||||||||||||||||||||||||
| Cell culture medium | 91.1% | 95.6% | [56] | |||||||||||||||||||||||||||||||||||||||||||||||||||||||||||||||||||||||||||||||||||||||||||||||||||
| Pinched flow fractionation | Cell culture medium | NA | NA | Simple device | Need for large sheath flows | [61] | ||||||||||||||||||||||||||||||||||||||||||||||||||||||||||||||||||||||||||||||||||||||||||||||||
| Asymmetric flow field-flow fractionation | Cell culture medium | NA | NA | High size resolution, gentle | Complicated fabrication, low throughput | [64] | ||||||||||||||||||||||||||||||||||||||||||||||||||||||||||||||||||||||||||||||||||||||||||||||||
| Electrical field | Plasma | NA | NA | Highly controllable | Complicated fabrication, risk of EV damage | [76] | ||||||||||||||||||||||||||||||||||||||||||||||||||||||||||||||||||||||||||||||||||||||||||||||||
| Cell culture medium | NA | NA | [78] | |||||||||||||||||||||||||||||||||||||||||||||||||||||||||||||||||||||||||||||||||||||||||||||||||||
| Acoustic field | EVs in PBS | NA | NA | High manoeuvrability | Complicated fabrication, high cost | [84] | ||||||||||||||||||||||||||||||||||||||||||||||||||||||||||||||||||||||||||||||||||||||||||||||||
| Plasma | NA | NA | [87] | |||||||||||||||||||||||||||||||||||||||||||||||||||||||||||||||||||||||||||||||||||||||||||||||||||
| Magnetic field | Cell culture medium, serum | 94.3% | NA | Simple device | Low size resolution | [89] | ||||||||||||||||||||||||||||||||||||||||||||||||||||||||||||||||||||||||||||||||||||||||||||||||
| Cell culture medium | 85.8% | NA | [90] | |||||||||||||||||||||||||||||||||||||||||||||||||||||||||||||||||||||||||||||||||||||||||||||||||||
| Immunoaffinity-based separation | Serum | NA | NA | Selective capture, high purity | Need for specific capture probes, only EVs containing specific proteins are obtained | [101] | ||||||||||||||||||||||||||||||||||||||||||||||||||||||||||||||||||||||||||||||||||||||||||||||||
| Plasma | NA | NA | [107] | |||||||||||||||||||||||||||||||||||||||||||||||||||||||||||||||||||||||||||||||||||||||||||||||||||
| NA: Not applicable. | ||||||||||||||||||||||||||||||||||||||||||||||||||||||||||||||||||||||||||||||||||||||||||||||||||||||
Filtration is a widely used method for particle separation due to its simplicity of operation [31,32]. The filter pores allow the passage of small-sized particles and retain large-sized particles. Filtration is divided into blocked filtration and tangential flow filtration, where the flow direction of particles is perpendicular and parallel to the filter membrane, respectively [33]. A series of microfluidic filtration devices have been developed for label-free separation of EVs from biological samples [34–39]. To isolate exosomes from blood samples, a fully integrated lab-on-a-disc equipped with two nanofilters (iExoDisc) was proposed [34]. The plasma separation module, highly abundant protein removal module, and nanopore membrane-based total isolation module were integrated within a disc-chip (Fig. 2A). The iExoDisc allowed automated isolation of exosomes from blood samples in 45 min, achieving an EV recovery of 74.7% and a purity of 3.5 × 10⁷ particles/µg protein. Compared with conventional UC methods, iExoDisc had advantages in purity, recovery and processing time. Furthermore, iExoDisc was used to isolate exosomes from the plasma of triple-negative breast cancer (TNBC) patients. The glycan profiles of exosomes were analysed by MALDI-TOF-MS and the lectin microarray. The results of both methods showed elevated sialylation and galactosylation glycan profiles in plasma exosomes from TNBC patients. Tangential flow filtration has also been used to separate and purify exosomes. Han et al. developed a size-dependent microfluidic chip with two serpentine channels and a nanoporous polycarbonate track etched (PCTE) membrane [40]. The sample was injected into one side of the serpentine channel, and contaminants were transferred across the filter membrane into the other side of the serpentine channel, while exosomes were retained in the original channel. The recovery of exosomes after elution was 80% and protein removal was 97%. The characteristic peaks of exosomes isolated by this method were found to be consistent with those isolated by UC by MALDI-TOF analysis, but the protein contaminant peaks were of lower intensity.
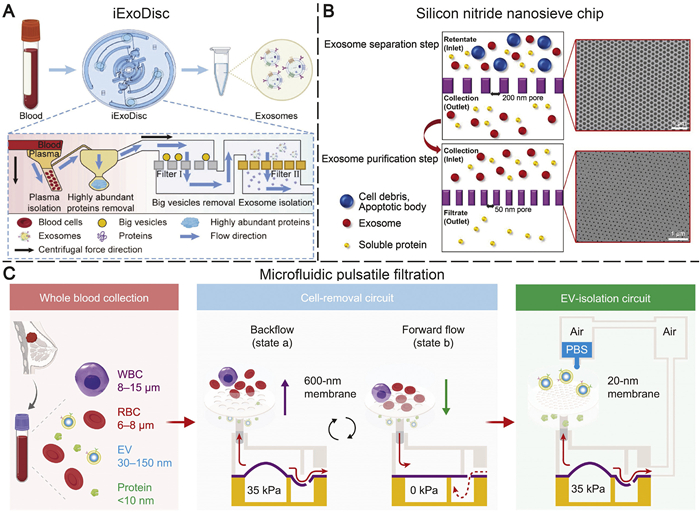
Kim et al. designed a diffusion-based exosome filtration method and developed a silicon nitride nanosieve chip for isolating exosomes from human serum [35]. The ultra-thin (300 nm) silicon nitride nanosieve improved the separation efficiency. A 200 nm porous sieve was used to separate exosomes and a 50 nm porous sieve was used to remove soluble proteins (Fig. 2B). No pressure was applied to the nanosieves during the separation process, which only relied on the diffusion of exosomes, thus reducing the risk of clogging. The method reached an EV recovery of 90% and a purity of 3 × 10⁷ particles/µg protein, which was superior to gold-standard UC method. Fabrication of large-area nanosieves allowed processing of 15 mL sample. Li et al. used the electric-hydraulic analogy to design cascaded microfluidic circuits for pulsatile filtration of EVs (Fig. 2C) [38]. The platform consisted of two circuits: a cell-removal circuit with an external polycarbonate (PC) membrane filter (600 nm pore size) and an EV-isolation circuit with an anodic aluminum oxide (AAO) membrane filter (20 nm pore size). Particles on the porous membrane were lifted by the pulsatile flows generated by the designed microfluidic circuit, inhibiting the filter fouling. Microfluidic pulsatile filtration enabled the separation of EVs from whole blood in 30 min with a recovery of 10.5%, and removed 95% of proteins, 92% of low density lipoprotein and 93% of very low density lipoprotein. Filtration enables simple separation of EVs based on size, but clogging is still a potential risk.
The separation of micron to submicron particles can be achieved by taking advantage of the differences in hydrodynamic forces applied to the particles within the microchannels [41,42]. Deterministic lateral displacement (DLD) affects particle trajectories by tilted micropillar arrays. Smaller sized particles move zigzag in the micropillar array, while larger particles are gradually shifted laterally by the micropillars causing separation between different sized particles [43,44]. Wunsch et al. fabricated silicon-based nano-DLD arrays to separate particles between 20–110 nm (Fig. 3A) [45]. The gap sizes between the nanopillars ranged from 25 nm to 235 nm. When using nanopillars with a gap of 235 nm, the device was able to collect exosomes with a diameter of <100 nm. Smith et al. integrated 1024 nano-DLD arrays on a single chip, which allowed for the isolation of EVs from urine and serum samples [46]. The chip was able to process samples at a rate of 900 µL/h with a recovery rate of 50%. The advantages of nano-DLD are gentle conditions and high size resolution. However, nano-DLD has the problems of complicated fabrication and clogging.
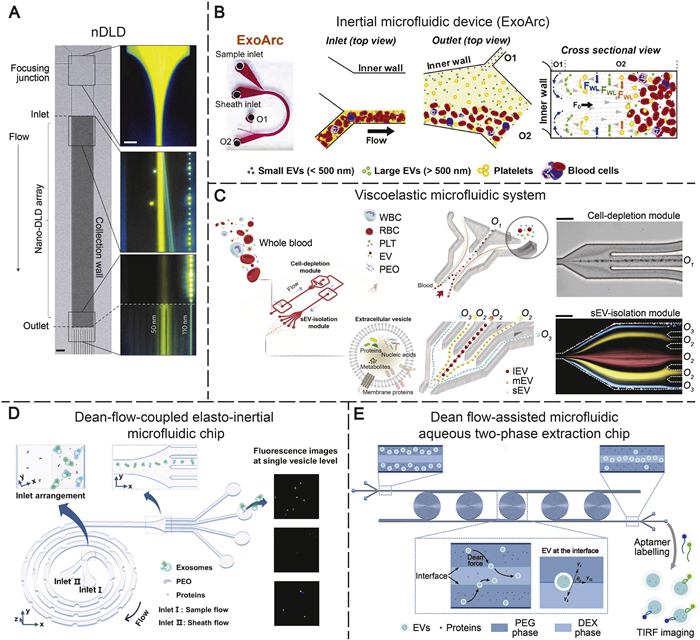
Inertial microfluidics is a powerful tool for particle separation which utilizes inertial lift and Dean forces to focus particles at different locations in the channel [47,48]. Shear-induced lift force (FSL) is caused by the curvature of the fluid velocity profile and wall-induced lift force (FWL) is induced by the repulsion between the particle and the wall. The particles are also affected by Dean forces (FD) in the curved channel. The inertial lift and Dean forces applied to the particles determine the equilibrium positions of particles of different sizes. A high-throughput inertial microfluidic device (ExoArc) for the isolation of EVs from plasma was reported [49]. Large EVs (> 500 nm), platelets and blood cells were excluded from the outlet near the outer wall, and small EVs (<500 nm) were collected from the outlet near the inner wall (Fig. 3B). ExoArc had less EV losses and higher EV yield (2.1 × 10⁸ particles/mL whole blood) compared with UC and SEC. Furthermore, there are a number of spiral chips that have been developed for the separation of EVs from blood [50,51]. However, these methods have limited resolution of EV size and cannot accurately separate EVs of different sizes.
Viscoelastic fluids were applied in order to further improve the size resolution of the EV separation [52,53]. Polyvinylpyrrolidone (PVP), poly(ethylene oxide) (PEO) and polyacrylamide (PAA) are usually used to produce viscoelastic fluids. Particles in viscoelastic fluid flow are affected by the elastic lift (FE), which is the dominant force controlling the focusing state of the particle [54]. Meng et al. designed a viscoelastic microfluidic system that could extract small EVs (sEVs, refer to EVs with a size smaller than 200 nm) from whole blood [55]. The system consisted of a cell-depletion module for removing micron-sized blood components and a sEV-isolation module for separating sEVs from other EV subpopulations (Fig. 3C). Diluted whole blood sample was injected into the device at a volumetric flow rate of 200 µL/h. sEV recovery was 87%, and 97% blood cells (red blood cells, white blood cells, and platelets) were removed. However, the device was not able to remove proteins effectively, and protein contamination was still present in the isolated sEV. Bai et al. developed a Dean-flow-coupled elasto-inertial microfluidic chip (DEIC) for isolation of exosomes with low protein contamination from cell culture medium and serum (Fig. 3D) [54]. DEIC utilized FD and FE to synergistically control the equilibrium position of the particles, which allowed for the separation of 20 and 200 nm particles. The method reached an exosome recovery of 70.6% and a protein removal of 91.4%. The expression of surface proteins was further analysed at the single vesicle level by labeling purified exosomes with fluorescent aptamers and visualizing them with total internal reflection microscopy (TIRF). It was possible to classify exosomes from liver cancer patients and esophageal cancer patients based on the expression of EpCAM and PD-L1. Song et al. developed a Dean flow-assisted microfluidic aqueous two-phase extraction chip (DATPEC) for EV separation. (Fig. 3E) [56]. By utilizing the differential affinities of EVs and proteins toward the dextran (DEX) and polyethylene glycol (PEG) phases, EVs were separated within the aqueous two-phase laminar flow. The Dean flow induced by the spiral microchannel accelerated the separation process. DATPEC achieved an EV recovery rate of 91.1% and a protein removal efficiency of 95.6%. Inertial and viscoelastic microfluidic devices are simple and enable high-throughput EV separation, but the addition of polymers may hinder subsequent detection.
Pinched flow fractionation (PFF) is a size-based separation technique that utilizes the laminar flow profile in microchannels [57–59]. In PFF, the sample with particles and the sheath fluid are introduced into the same channel from two inlets, and the sample flow is focused on one sidewall in the pinched segment (Fig. 4A). At the boundary of the channel widening, the difference in particle positions in the pinched segment influenced is amplified by the spreading flow profile, enabling particle separation according to size [60]. Shin et al. isolated exosomes and apoptotic bodies from cell culture medium using PFF [61]. The PFF device consists of of two inlets, nine outlets, and a magnification channel that controls the overall flow pattern (Fig. 4B). Samples and sheath fluid were injected at flow rates of 20 and 180 µL/min, respectively. Immunoblotting and transmission electron microscopy (TEM) results showed that exosomes (30–100 nm) were collected at outlets 1–3 and apoptotic bodies (500–2000 nm) were collected at outlets 5–9. The PFF device is simple, but it requires a large sheath flow that dilutes the sample.
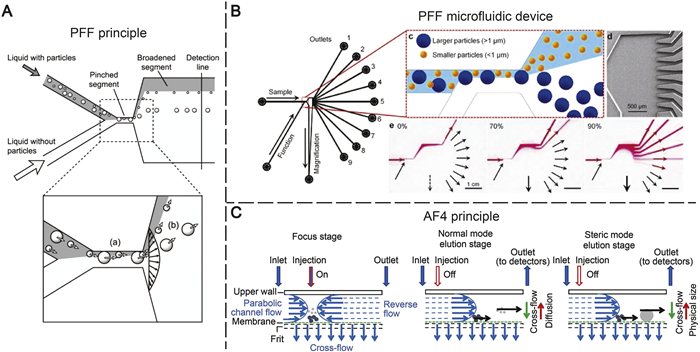
Asymmetric flow field-flow fractionation (AF4) is a high-resolution particle separation technique that is widely used for the separation of colloids, proteins, liposomes, viruses, and EVs [62–67]. As shown in Fig. 4C, particles were first dragged to the surface of the membrane by the effect of cross-flow, which enabled the particles to form a concentration gradient and diffuse into the channel. The heights reached by the particles were related to their diffusion coefficients. Particles occupied different streamlines of the parabolic velocity flow profile during their elution process, and small particles eluted earlier than large particles. However, when the physical size of the particles was too large, large particles eluted earlier than small particles [62,68]. Zhang et al. used AF4 to isolate and identify size-based subpopulations of EVs [64]. Two exosome subpopulations (60–80 nm and 90–120 nm) and a new non-membranous nanoparticle population (exomeres, 35 nm) were identified. Exomeres are non-membranous nanovesicles with a size ≤ 50 nm. Further analysis showed that all three subpopulations had unique biophysical properties and exhibited heterogeneity and diversity in N-glycosylation, protein, lipid, DNA and RNA profiles. AF4 separates EVs with high size resolution, but the device is complex and has low throughput.
The electric field applied within the microchannel can effectively separate biological particles [69–71]. Dielectrophoresis (DEP) is the movement of dielectric particles in a non-uniform electric field due to electrostatic forces arising from their polarization effect [72]. The DEP force is related to the size and conductivity of the particles [73]. Based on this, microfluidic devices integrated with electric field are used for EV separation [74–79]. Ibsen et al. designed an alternating current electrokinetic microarray chip with 400 platinum microelectrodes for isolating exosomes from plasma (Fig. 5A) [76]. The DEP force generated by applying an alternating electric field allowed exosomes to move towards the edge of the electrodes, while cells and large particles moved towards low-field regions between the electrodes. After washing with buffer to remove plasma, exosomes could also be eluted by adjusting the electric field. This device enabled separation of exosomes with a diameter of 30–150 nm from 30–50 µL plasma in <30 min. A similar design was used to isolate sEVs from breast cancer patient plasma for disease diagnosis [77]. Ayala-Mar et al. developed a direct current-insulator-based DEP (DC-iDEP) method for size-based capture and isolation of exosomes (Fig. 5B) [78]. The device had two different arrays of oval electrically insulating posts. By adjusting the voltage, large and small exosomes were captured in the two electrode arrays respectively. This method can be used to isolate and study subpopulations of exosomes at a small scale. However, electric field may also cause EV damage. The high complexity and cost of the equipment also limit its large-scale application.
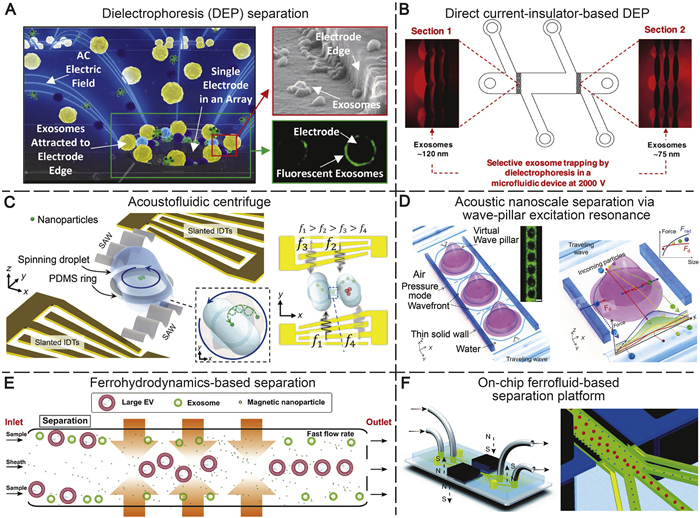
Acoustofluidic technologies that combine acoustic fields and microfluidics have been widely used for bioparticle manipulation [80,81]. In the acoustofluidic device, the flowing particles are subjected to acoustic radiation forces due to acoustic waves generated by piezoelectric actuators. Larger particle is affected by greater acoustic radiation force and migrates faster, which allows the size-based separation of particles [82,83]. Thus, acoustofluidics are employed for the separation of EVs [84–88]. Gu et al. proposed the acoustofluidic centrifuge for rapid (<1 min) nanoparticle concentration and separation [84]. Surface acoustic waves were used to rotate the droplet, and the nanoparticles in the droplet were subjected to acoustic radiation forces and fluid dynamics, moving closer to the center of the droplet along a helical path (Fig. 5C). Acoustofluidic centrifuge could specifically concentrate particles of tens of nanometers by using different frequencies. In order to achieve the separation of particles of different sizes, a dual-droplet system was designed. At a specific rotational speed, smaller particles in one droplet were transferred to another droplet through the fluid channels between the droplets. Exosome subpopulation (diameter <50 nm) was isolated using this system. Zhang et al. developed an EV separation technique called acoustic nanoscale separation via wave-pillar excitation resonance (ANSWER) [87]. An array of acoustic wave pillars was generated by forming tunable acoustic waves in the microfluidic channel by excitation resonance (Fig. 5D). Particles with a positive acoustic contrast factor were subjected to acoustic radiation force as they flow through acoustic wave pillars, enabling the size-based separation of particles. By tuning the acoustic wave pillar, ANSWER could selectively separate particles from 50–1000 nm. This method achieved rapid (<10 min), single-step, high-purity (>96%) isolation of sEV subpopulation from plasma. Acoustofluidic technology enables label-free continuous separation of EVs with good biocompatibility. Nevertheless, the complexity and high cost of the device remain challenges that need to be addressed.
Label-free magnetic separation of EVs is achieved based on negative magnetophoresis, unlike positive magnetophoresis that requires magnetic bead labeling [89,90]. Non-magnetic particles in the magnetic fluid are subjected to a magnetic buoyancy force proportional to their volume, resulting in the separation of particles of different sizes [91,92]. Biocompatible ferrofluids have sufficient magnetic susceptibility to induce negative magnetophoresis for driving nanoscale bioparticles [93]. Liu et al. developed a ferrohydrodynamics-based microfluidic device for the isolation of exosomes from cell culture medium and human serum (Fig. 5E) [89]. Four magnets were placed around the straight channel. The sample mixed with ferrofluid was injected from both sides of the channel and the particles were subjected to magnetic buoyancy force to migrate towards the center of the channel. Larger particles migrated at a faster rate, resulting in the separation of different sized particles at the outlet. With the optimal conditions, exosomes were isolated from MDA-MB-231 cell culture medium with a recovery of 94.3% and a purity of 87.9%. This method was further used to isolate exosomes from serum samples and the proteins of the collected exosomes were detected for heterogeneity analysis. Zeng et al. reported an on-chip ferrofluid-based separation platform for efficient isolation of sEVs from cell culture medium (Fig. 5F) [90]. An ultra-high gradient magnetic field module was integrated with the microfluidic chip, which provided a magnetic field gradient of ~105 T/m. Due to the ultra-high magnetic field gradient, the low ferrofluid concentration (0.3% of original concentration) could meet the separation conditions and help to maintain the biological activity of sEVs. As a result, the system isolated sEVs (30–200 nm) from cell culture medium with 85.8% recovery and 80.45% purity at a sample flow rate of 150 µL/h. Magnetophoresis-based EV separation methods are simple in device design but exhibit low size resolution.
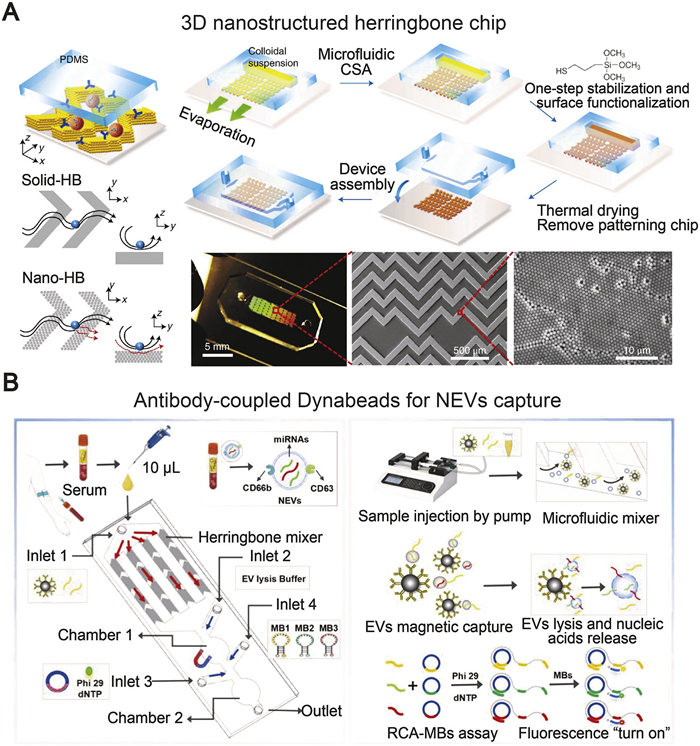
The membrane of EVs contains many protein markers (CD9, CD63, CD81, etc.) and specific disease markers (EpCAM, EGFR, etc.). Generally, capture probes are modified on the microchannel surface or microbeads to identify these markers [94–98]. Microstructures within microfluidic chips facilitate the binding between EVs and capture probes, thereby enhancing EV capture efficiency. Compared with traditional methods, microfluidic methods require less reagent consumption, resulting in cost savings. Antibodies are the most commonly used capture probes. Zhang et al. fabricated a 3D nanostructured herringbone (nano-HB) chip for the detection of circulating exosomes (Fig. 6A) [99]. The anti-CD81 monoclonal antibody was modified on the microstructures to capture exosomes. The nano-HB not only promoted mass transfer of particles at the microscale and increased probe density, but also reduced the near-surface hydrodynamic resistance to enhance the surface binding of particles. Due to these advantages, the nano-HB chip was able to detect low levels of exosomes in plasma (10 exosomes/µL). For exosome detection, biotinylated detection antibodies, streptavidin-conjugated β-galactosidase and its fluorescent substrate were used to generate fluorescent signals. The ultra-high sensitivity allowed rapid sensing of disease-related exosomes by the nano-HB chip, which was expected to be an effective method for clinical diagnosis. Another OncoBean chip was designed for high-throughput EV isolation from cell culture media and plasma [100]. The OncoBean chip had a radial flow design and many anti-CD63-coated microcolumns, which helped to capture EVs at high flow rates. Proteins and RNAs from isolated EVs were analysed using western blot and qPCR. Yu et al. used CD66b antibody-coupled Dynabeads to specifically capture CD63 aptamer labeled neutrophil extracellular vesicles (NEVs) within a microfluidic chip (Fig. 6B) [101]. Herringbone microchannels disrupted laminar flow to generate micro-vortexes, which helped to enhance mixing to facilitate efficient capture of NEVs. Captured NEVs were heated and lysed to release CD63 aptamer and miRNAs, which triggered the rolled circular amplification (RCA) reaction. Finally, molecular beacons (MBs) were introduced to generate fluorescent signals. Serum samples from healthy controls (HC), benign gastric diseases (BGD) and gastric cancer (GC) patients were examined using this microfluidic chip, and the results showed that NEV markers in GC patients were significantly higher than those in HC and BGD. This chip provided an innovative tool for NEV analysis and gastric cancer diagnosis.
In addition to antibodies, aptamers are also used as capture probes for EV isolation due to their unique advantages such as low cost and small size [102–105]. Jia et al. developed a microfluidic device equipped with a cactus-like array substrate (CAS) for exosome surface-enhanced Raman spectroscopy (SERS) detection (Fig. S1A in Supporting information) [106]. Samples and EpCAM aptamer-modified SERS nanoprobes were injected into the mixing channel from two inlets, and exosome surface proteins bound with the aptamer to form a complex. Subsequently, they were captured by the CD63 aptamer on the CAS in the assay chamber, forming sandwich immunocomplexes that were detected by SERS. Prostate cancer cell-derived exosomes were detected using this method with a detection limit of 1 exosome/µL. To analyse nascent tumor extracellular vesicles (tEVs), Wu et al. presented a new technique named specific click-tagging driven by aptamer for tEV labeled with a metabolic timestamp (STAMP) (Fig. S1B in Supporting information) [107]. tEVs specifically refer to EVs secreted by tumor cells. This strategy utilized metabolic glycoengineering to add azide groups as markers on newly generated EVs. Aptamer probes modified with alkyne biotin specifically bound to the nascent tEVs. The covalent binding of alkyne and azide groups was achieved through click chemistry reaction. Single-stranded DNA binding protein (SSB) was introduced to disrupt the binding of the aptamer and tEVs without azide groups, thereby further improving selectivity. Finally, the labeled tEVs were captured and analysed in a streptavidin-functioned chip. Captured tEVs could also be released from the chip using nucleases for proteome profiling. Immunoaffinity-based separation techniques can selectively capture highly purified EVs, but this method cannot obtain all EVs and the required specific probes are often costly.
As shown in Table 2, many methods have been coupled with microfluidic techniques for rapid and highly sensitive analysis of isolated EVs, such as fluorescence, electrochemical methods, surface plasmon resonance (SPR), and surface-enhanced Raman spectroscopy (SERS).
DownLoad:
CSV
| Analytical methods | Sample | Detection target | Advantages | Limitations | Ref. |
| Fluorescence | Plasma | Phospholipid bilayers, CD63 | High sensitivity, high specificity | Background interference, spectral overlap | [113] |
| Saliva | PD-L1, EpCAM, CD45 | [114] | |||
| Plasma | CD63, PD-L1, EpCAM | [115] | |||
| Serum | SORL1 | [116] | |||
| Electrochemical methods | Serum | EpCAM | Simple, rapid, miniaturization | Environmental disturbances, less stability | [121] |
| Blood | PSMA, EGFR, CD81, GPC1 | [122] | |||
| Serum | CD63 | [123] | |||
| Plasma | PD-L1, PD-1 | [124] | |||
| Surface plasmon resonance | Cell culture medium | CD9, CD63, CD82, CD41b, EpCAM, E-cadherin | High sensitivity | Complex instruments, high cost | [130] |
| Plasma | CD63 | [131] | |||
| Surface-enhanced Raman spectroscopy | Plasma | HER2 | High sensitivity | Reproducibility, high cost | [144] |
| Plasma | LacdiNAc, T antigen, CD81 | [145] | |||
| Cell culture medium | MUC1 | [146] | |||
| Serum | CD81, CD9, EpCAM, EGFR, CD24, CA125 | [147] |
Fluorescence detection is a widely used detection technique that is suitable for combination with microfluidic devices to detect isolated EVs. A common strategy is to use fluorescent probes to bind to EVs and visualize them using fluorescence microscopy [108–112]. Ren et al. developed a microfluidic chip for the enrichment and detection of EVs (Fig. 7A) [113]. EV phospholipid bilayers were labeled with Mem GlowTM 488 to quantify the number of EVs, and CD63 expression levels were detected using FAM-labeled CD63 aptamers. On-chip gel electrophoresis removed unbound fluorescent probes and allowed EVs to aggregate to enhance the fluorescent signal. This method was used in the detection of plasma samples to distinguish cancer patients from healthy people, and the limit of detection (LOD) was 6.89 × 10³ particles/µL. Yu et al. designed a step-wedge microfluidic chip to quantify and count PD-L1-positive EVs derived from tumor cells and immune cells in saliva of oral squamous cell carcinoma (OSCC) patients [114]. This chip integrated anti-PD-L1 antibody-modified magnetic microspheres and fluorescent nanoparticles targeting EpCAM/CD45 (Fig. S2A in Supporting information). EpCAM and CD45 were used as markers for tumor cells and immune cells, respectively. Microsphere-EV-fluorescent nanoparticle complexes were captured and arranged within the chip to visualize individual fluorescent markers which improved detection sensitivity. OSCC patients had reduced levels of PD-L1-positive EVs derived from immune cells compared to healthy people. Wu et al. proposed an integrated microfluidic device for analysing the phenotypes of tEVs (Fig. S2B in Supporting information) [115]. Different sized microbeads encoded with specific probes (CD63, PD-L1 and EpCAM aptamers) were used to bind tEVs of different phenotypes. The microbeads were subsequently captured on microfluidic chip pillar arrays to achieve position-specific separation of different EV phenotypes, which allowed to detect different EVs using one fluorophore, avoiding signal overlap among different fluorescent dyes. The aptamer signals on the microbeads were amplified by in situ RCA to improve detection sensitivity. This method successfully detected four phenotypes of EVs from the plasma of cancer patients. Li et al. fabricated a 3D porous microfluidic chip for exosome enrichment and used silicon quantum dot coupled SORL1 antibody (Si-QD-SORL1) for fluorescence detection (Fig. 7B) [116]. A porous sponge PDMS chip was produced using NaCl particles as a template and CD9 antibody was immobilized on the chip to capture exosomes. Proteomic screening identified SORL1 as a colorectal cancer (CRC) signature exosome protein. The expression of exosome SORL1 in the serum of CRC patients was measured with the help of this chip and Si-QD-SORL1. An artificial intelligence (AI)-based ensemble classification system was used to process the acquired fluorescence images, which efficiently and accurately distinguished between CRC patients and non-CRC populations. Fluorescence methods have the advantages of high sensitivity and specificity, but issues such as background interference and spectral overlap limit their application.

Electrochemical detection is a simple, rapid, and low-cost method. Antibodies or aptamers are modified on the electrodes. When EVs bind to them, electrical signal changes are generated, enabling EVs-specific detection [117–120]. Li et al. integrated EpCAM aptamer-modified gold electrodes with herringbone microfluidic chips for tumor exosome detection (Fig. 8A) [121]. Exosomes bound to aptamers formed a biomolecular layer that impeded electron transport and caused electrical signaling changes. The results of cyclic voltammetry (CV) and electrochemical impedance spectroscopy (EIS) demonstrated the changes in electron transfer resistance caused by the adsorption of exosomes on the electrode. The LOD of this method was 1.4 × 10⁴ particles/mL and the linear range was from 1.0 × 10⁵ particles/mL to 1.0 × 10⁹ particles/mL. Serum samples from lung cancer patients were also examined by the method, demonstrating its applicability to clinical samples. Wang et al. proposed a filtration-electrochemical microfluidic chip (FEMC) for detecting and classifying exosomes derived from breast cancer (Fig. S3A in Supporting information) [122]. FEMC integrated filtration-based exosome separation and in situ surface protein electrochemical analysis. The filter membrane removed contaminants from the sample and allowed only exosomes to enter four detection zones at the bottom with different antibody-modified screen-printed electrodes (SPEs). Methylene blue@UiO-66 amplified current signals non-specifically. The FEMC assay process was completed within 1 h, with a LOD of 1.0 × 10⁴ particles/mL. Blood samples from breast cancer patients and healthy people were analysed for the exosome proteins (PSMA, EGFR, CD81, and GPC1) using FEMC, providing a valuable tool for the diagnosis and treatment of breast cancer.
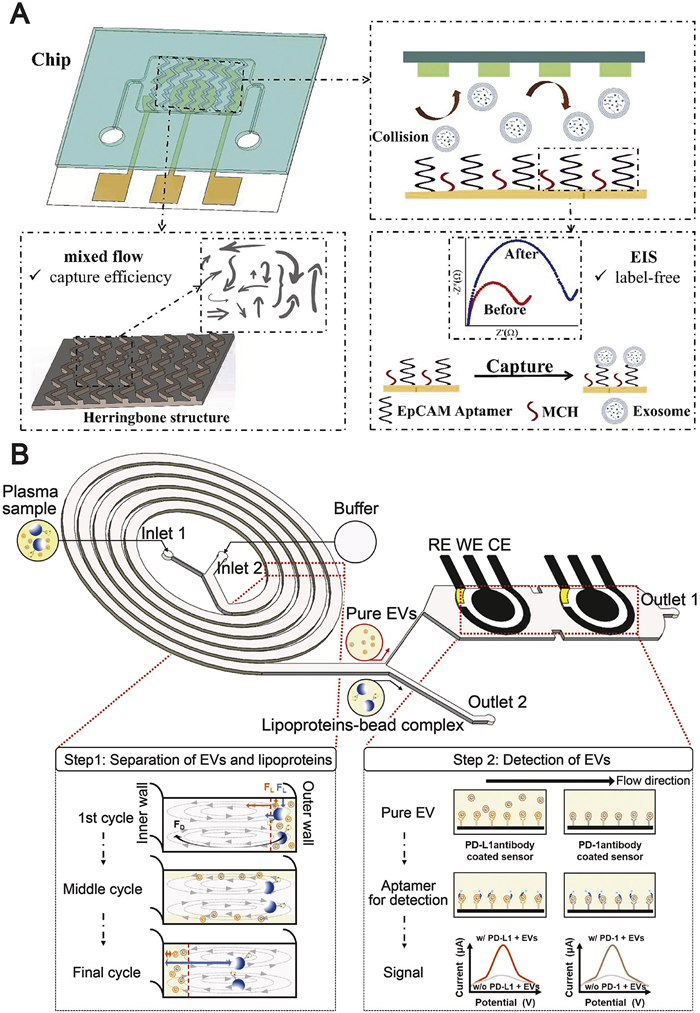
Xu et al. developed a two-stage microfluidic platform (ExoPCD-chip) for on-chip exosome isolation and electrochemical analysis (Fig. S3B in Supporting information) [123]. Since phosphatidylserine (PS) on the exosome membranes could be recognized by Tim4 protein, exosomes were captured using magnetic beads modified with Tim4. The beads and samples were mixed in a Y-shaped micropillar array and subsequently enriched on the surface of the ITO electrode for highly sensitive detection. An electrochemical aptasensor containing a CD63 aptamer was designed, and it could be converted into a small G-quadruplex containing a hairpin configuration by CD63 positive exosomes. With the help of hemin, the hemin/G-quadruplex functioned as a DNAzyme, catalyzing the H2O2 generated by NADH oxidation to produce a significant signal enhancement. CV and differential pulse voltammetry (DPV) were used to detect changes in electrical signals. The LOD of ExoPCD-chip was 4.39 × 10³ particles/mL and the linear range was from 7.61 × 10⁴ to 7.61 × 10⁸ particles/mL. ExoPCD-chip was used to detect CD63-positive exosomes in human serum for liver cancer diagnosis. Kwon et al. presented a spiral microfluidic channel integrated electrochemical device (HiMEc) that removed lipoproteins and detected EVs (Fig. 8B) [124]. Antibody-modified microbeads (7 µm) were first added to plasma samples to capture lipoproteins. The EVs and lipoprotein-microbead complexes in the samples achieved spatial separation within the spiral channel due to size difference. EVs entered the detection chamber and were detected by electrodes modified with PD-L1 antibody or PD-1 antibody. The LOD of HiMEc was determined to be 1.0 × 10³ particles/mL with a linear range from 1 × 10⁴ particles/mL to 1 × 10⁸ particles/mL. To demonstrate applicability to clinical samples, HiMEc was used to detect PD-L1 and PD-1 levels of EVs in the lung cancer patient plasma. Electrochemical methods are simple, rapid, and conducive to miniaturization, but they are susceptible to environmental disturbances and exhibit poor stability.
Surface plasmon resonance (SPR) is an optical-based technique for analysing biomolecular interactions. The SPR sensing chip coated with substrates is modified using capture probes. SPR is very sensitive to the refractive index of substrates, so the captured EVs cause changes in the optical signal [125–129]. Zhu et al. combined SPR imaging (SPRi) and antibody microarrays to quantify exosomes in cell culture medium (Fig. 9A) [130]. Multiple antibodies specific to various proteins (CD9, CD63, CD82, CD41b, EpCAM, and E-cadherin) were printed on the bare gold-coated sensor chip. The binding of exosomes was proved to cause changes in SPRi response signals. A positive correlation between tumor cell exosome secretion and metastatic potential was revealed using this method. Feng et al. developed a concentric gradient nanoplasmonic (CGN) sensor integrated with a microfluidic device for EV quantification (Fig. S4A in Supporting information) [131]. Gradient nanostructures were patterned on the gold film on a glass slide, and CD63 aptamers were immobilized on the surface of the CNG sensor. EVs in A549 and MCF-7 cell culture medium were detected using this device with LODs of 8.37 × 10⁷ and 1.5 × 10⁸ particles/mL, respectively. EVs in plasma were also quantified using the CGN sensor and the results were consistent with nanoparticle tracking analysis (NTA). SPR offers high sensitivity, but the instrument is complex and expensive.
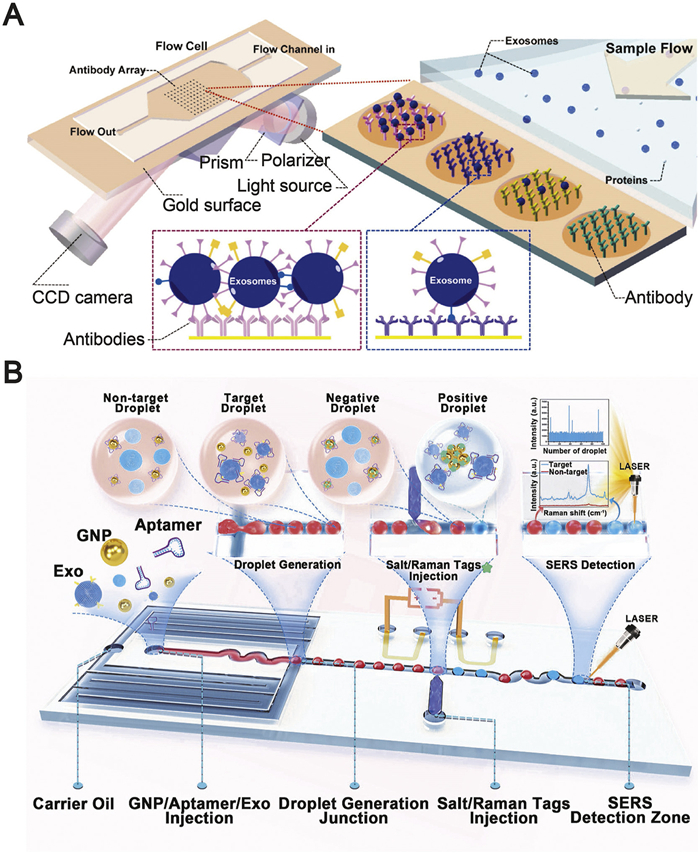
Surface-enhanced Raman spectroscopy (SERS) utilizes the synergistic effect of electromagnetic enhancement and chemical enhancement to greatly amplify the Raman signals [132–134]. SERS is a technique that is widely used in analytical and bioanalytical chemistry [135–138]. The combination with microfluidics improves the reproducibility and sensitivity of SERS for accurate and rapid EV detection [139–143]. Ho et al. developed a droplet microfluidic platform integrated with SERS-based aptasensor (Fig. 9B) [144]. HER2 aptamers, gold nanoparticles (GNPs), and exosomes were encapsulated in a droplet. HER2-positive exosomes bound to the HER2 aptamers, which detached aptamers from the surface of GNPs, leading to aggregation of GNPs under high-salt conditions. Aggregated GNPs formed hotspot regions that enhanced the electromagnetic field and SERS signals, whereby HER2-positive exosomes could be identified. The method had a LOD of 4.5 log10 particles/mL was successfully used to detect HER2-positive exosomes in clinical samples for breast cancer diagnosis. In order to perform early diagnosis of lung cancer based on sEVs, Zhou et al. proposed a microfluidic and SERS-based sEV glycan phenotype (EV-GLYPH) assay (Fig. S4B in Supporting information) [145]. SEC-purified sEVs from plasma of non-small cell lung cancer (NSCLC) patients were captured by anti-MUC1 antibody-modified electrodes. GNPs conjugated with Raman reporters and specific lectins or antibody were used as SERS nanotags targeting LacdiNAc, T antigen and CD81 on the surface of sEVs. To enhance the interaction of sEVs and SERS nanotags with anti-MUC1 antibody, an alternating current-electrohydrodynamic (ac-EHD) field was applied to generate a circulating flow on the electrode surface. Based on the results of in situ SERS imaging, the number and glycosylation levels of sEVs were quantified, thus identifying early-stage NSCLC. The EV-GLYPH assay accurately differentiated late-stage NSCLC patients from healthy people and exhibited outstanding diagnostic performance for early-stage NSCLC and benign lung disease.
To improve the sensitivity and accuracy of exosome detection, Ma et al. fabricated a dual-control microfluidic device integrating magnetic separation and SERS signal amplification reactions (Fig. S4C in Supporting information) [146]. The binding of the exosome to the MUCI aptamer modified on the magnetic beads in the separation chamber led to the release of the Initiator chain. The exosomes and magnetic beads were retained in the separation chamber due to the magnetic field, while the released Initiator chains were pushed by the pump into the reaction chamber. The SERS signal was amplified using DNA cascade amplification with the Initiator chain as the substrate. In addition, electrokinetic stirring and enrichment technology improves the reaction efficiency and signal strength. The LOD of exosomes by this method was 10.9 particles/µL. Chen et al. designed a SERS-multichannel microchip platform for sEVs (S-MMEV) analysis for early-stage clinical diagnosis of ovarian cancer (Fig. S4D in Supporting information) [147]. Anti-CD63 antibody was modified within the channels to immobilize sEVs. Metal nanoparticles modified with different antibodies were used as SERS probes to detect different markers (CD81, CD9, EpCAM, EGFR, CD24, and CA125) in multiple parallel channels. S-MMEV allowed the assay to be completed in <1 h and had a low LOD of 10 particles/mL. The sEVs in the serum of early-stage ovarian cancer patients were detected using S-MMEV and accordingly the ovarian cancer patients were differentiated from healthy people with high accuracy. SERS exhibits high sensitivity, but its reproducibility poses a challenge.
Traditional EV analysis can only provide population-level information, while single-cell EV analysis can identify differences in EV characteristics across different cell types or states, facilitating early disease diagnosis. Signal transmission between cells via EVs also needs to be studied at the single-cell level. This analysis provides more detailed insights into cell biology and disease mechanisms. Single-cell EV analysis requires extremely high sensitivity due to the low levels of EV secretion from individual cells. Constructing a separate detection environment for each cell is also essential to eliminate signal crosstalk between cells. In addition to enabling single-cell EV analysis, throughput is crucial to ensure sufficient data acquisition for statistically significant results. Traditional methods often struggle to meet these requirements simultaneously. Microfluidic technology can isolate individual cells within discrete microvolumes due to its high degree of design flexibility and capability to manipulate small liquid volumes, making it an ideal platform for single-cell EV analysis.
Isolation and culture of single cells are prerequisites for single-cell EV analysis. Microfluidic system allows precise manipulation of fluids and channel size is matched with single cell, making it an optimal tool for single-cell isolation [148–150]. Culturing single cells in the compartments of the microfluidic device reduces reagent consumption and sample contamination and enables high-throughput and automated single-cell EV analysis. Moreover, the closed compartment avoids the diffusion of EVs and improves the analytical sensitivity. Microfluidic devices based on valves, traps and droplets have been developed for single-cell isolation.
Microfluidic devices integrated with microvalves enable the capture, manipulation and isolation of single cells by precisely controlling fluid flow. Multilayer chips containing fluid layers and valve layers are widely used as single-cell isolation chips [151–155]. The fluid layer is designed according to the size of single cell to ensure that the single cell can enter the compartment appropriately. The valve layer, controlled by gas or liquid, can block or allow the passage of fluid in the fluid layer to isolate the single cell within the compartment (Fig. S5A in Supporting information) [156]. Chen et al. developed a microfluidic chip with dual pneumatic microvalves for dynamic screening and printing of single cells [157]. Cell size limitation was dynamically controlled by adjusting the deformation of two adjacent microvalves, and single cells were printed onto a 384-well plate (Fig. S5B in Supporting information). The device achieved 100% single-cell printing efficiency with high cell viability. Wang et al. fabricated a microfluidic device with 5000 hydrodynamic traps and control microvalves [158]. Membrane deformability, valve shape and actuation media were demonstrated to be related to sealing pressure. By optimizing the chip design and actuation media, the device achieved precise control of thousands of microchambers at sealing pressures of 0.04 MPa. Although valve-based microfluidic devices allow precise and automated isolation of single cells, the devices are complicated to manufacture.
Setting up traps within microfluidic chips to obtain single-cell arrays is also a commonly used method for single-cell researches [159–163]. The size of the trap can be adjusted to the target single cell. As the cell suspension flows through the channel, the specific structure allows only one cell to enter into the trap, improving single-cell capture efficiency. Zhang et al. designed a microfluidic chip with thousands of microhooks for preparing large-area single-cell array [164]. By applying negative pressure at the outlet to introduce the cell suspension into the channel, a single-cell loading efficiency of 97% was achieved. Combined with laser capture microdissection (LCM) technology, cell protrusions were isolated from single cell array, and gene expression profiles of cancer cell protrusions were successfully detected. Xuanyuan et al. presented an on-chip single-cell trapping method based on mechanical traps (Fig. S5C in Supporting information) [165]. The chip was made up of a trap channel and a bypass channel. When a cell entered the trap, the fluid would flow to the bypass channel, allowing the next cell to enter the next trap. Sequential single-cell trapping was thus achieved. A single-cell capture efficiency of 99% was realized by adjusting the structure of the trap to avoid cell escape and multi-cell capture. Lu et al. integrated 5440 sub-nanoliter microchambers on a chip for high-throughput secretomic analysis of single cells (Fig. 10A) [166]. The cell suspension was dropped on the surface of the chip, and the cells fell into each chamber with a Poisson distribution by gravity. A slide modified with an antibody barcode array was immobilized on the chip to detect proteins secreted by single cells. The chip could simultaneously detect 14 proteins from more than a thousand single cells, helping to identify cellular functions.
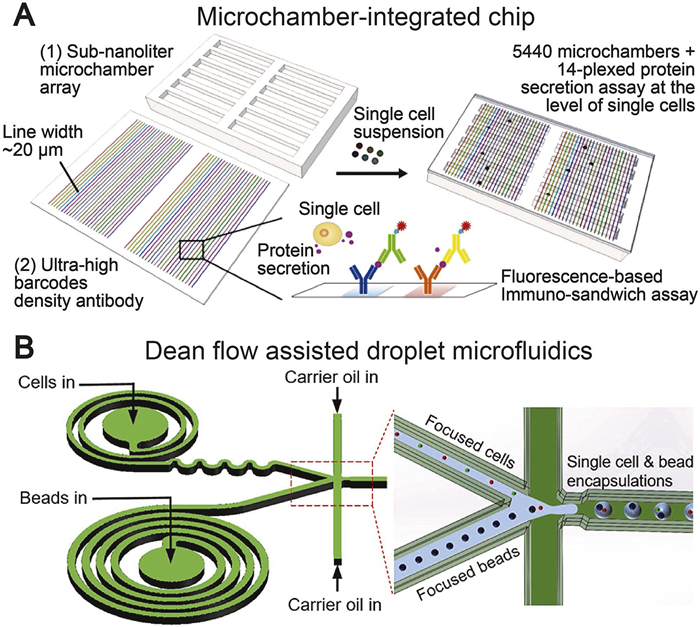
Droplet microfluidics can generate thousands of nanoliter to picoliter droplets per second for single-cell encapsulation and is considered one of the most promising methods for single-cell isolation [167–169]. The dispersed phase in the chip is divided into microdroplets by the shear force provided by the continuous phase, and the droplet diameter can be adjusted by changing the flow rate or fluid properties [170]. Single-cell encapsulation in droplets is a randomized process, and the number of cells encapsulated in each droplet obeys the Poisson distribution. Only a small fraction of droplets contain a single cell. In order to improve the efficiency of single-cell encapsulation, Zhou et al. proposed a droplet-generating microfluidic chip integrated with a passive droplet-sorting system, which generated > 22 000 single-cell loaded droplets per minute (Fig. S5D in Supporting information) [171]. In the T-shaped junction, empty droplets were divided into two, but droplets containing a single cell were unevenly divided into large empty droplets and small cell-loaded droplets. Subsequently, small cell-loaded droplets were sorted by PFF. The system reduced the percentage of empty droplets from 89% to 1%, while the percentage of single-cell loaded droplets increased from 11% to 94%. Li et al. utilized serpentine and spiral channels to focus cells and beads and improve the efficiency of cell and bead co-encapsulation (Fig. 10B) [172]. The proportions of single cell encapsulation and single bead encapsulation were 20.77% and 24.88%, respectively. The proportion of co-encapsulation was 2.93%, which was about twice as high as that of the device without focused channels. The device was used for single-cell RNA sequencing of human and mouse cells, improving the performance of library preparation.
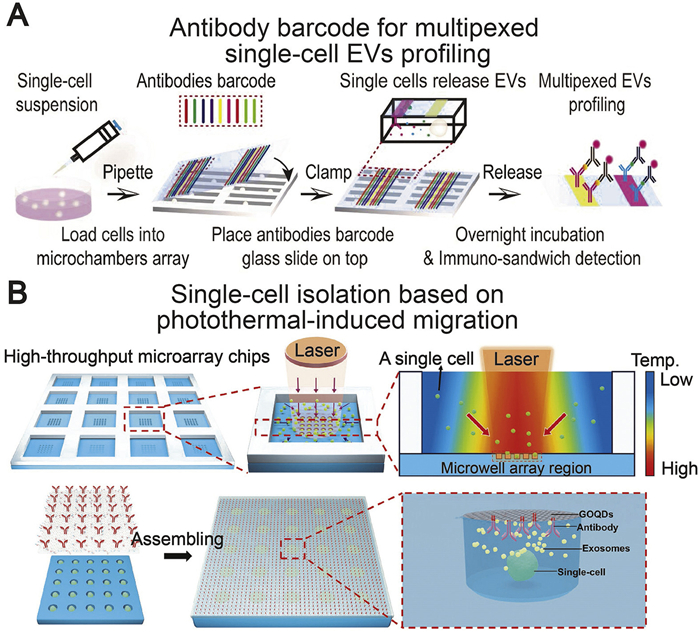
The microwell trap chip is the most commonly used platform for single-cell EV detection [173–177]. EVs released from single cells within the compartments are specifically captured by antibodies and subsequently detected. Ji et al. developed a microfluidic platform combining a high-density microchamber array and a spatially resolved antibody barcode slide for multiplexed analysis of single-cell EVs (Fig. 11A) [178]. The platform was used to analyse the heterogeneity of single-cell EV secretion and reveal the correlation between EV secretion and cell invasive behaviour. Chiu et al. designed a microfluidic device with removable microwells to allow single-cell culture without space restrictions (Fig. S6A in Supporting information) [179]. A PDMS mesh was utilized to guide single cells to form arrays on a glass substrate, and then removed. Antibody-modified slides above the cells allowed continuous counting of exosomes secreted by single cells within 96 h. The exosome secretion rates of MCF-7 and MDA-MB-231 cells were evaluated under different conditions using this method. It should be noted that the diffusion of exosomes caused a small amount of crosstalk (3%) because the cells are located in an open space. Song et al. used a similar strategy for single-cell multi-phenotypic exosome analysis (Fig. S6B in Supporting information) [180]. Ovarian cells were categorized into several subpopulations based on the expression of seven proteins of exosomes. The platform revealed the heterogeneous secretion function of single cells and was successfully used for the analysis of clinical samples. Wang et al. proposed a high-throughput single-cell chip based on photothermal-induced migration (Fig. 11B) [181]. Combined with multicolor barcode array technology, it achieved efficient single-cell exosome separation and phenotypic analysis. A low-power light source was used to create a temperature gradient in the cell suspension, causing cells to aggregate toward specific areas on the chip surface. The cells settled into the microwells under the combined effect of photothermal effect and gravity, reaching 97.2% single-cell separation efficiency. Graphene oxide quantum dots (GOQDs) with capture antibodies enabled specific capture of exosomes secreted by single cells and phenotypic analysis against CD44, EGFR, and PD-L1. Due to the fluorescence quenching effect of GOQDs, the background signal was significantly reduced, ensuring high detection sensitivity.
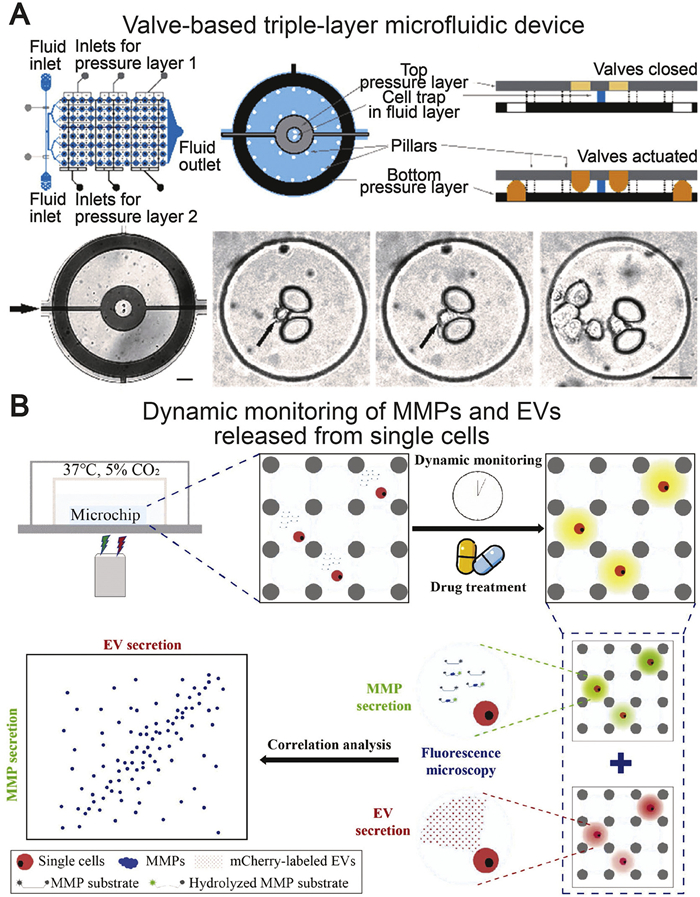
In addition to microwell arrays, valve- and droplet-based microfluidics have also been used for single-cell EV analysis. Nikoloff et al. proposed a bilayer microfluidic device with an array of two concentric pneumatic valves (Fig. S7A in Supporting information) [182]. The fluid layer set up a series of hydrodynamic traps for single-cell capture, and the valve layer set up two concentric circular valves around each trap to create isolated chambers around the single cells. EVs released by single cells were immobilized in the antibody-modified regions between the valves and subsequently detected using fluorescent antibodies. Another work used two valve layers to separate the inner and outer valves to avoid fine structures and improved the stability of the device (Fig. 12A) [183]. The device was utilized to analyse the EVs from single breast cancer cells and cluster the EVs with colocalized markers. Droplet-based microfluidic technology encapsulates single cells in individual droplets, enabling the study of their EV secretion. Ji et al. reported the 12-h dynamic monitoring of single-cell secretion of matrix metalloproteinases (MMPs) and EVs using microdroplet arrays (Fig. 12B) [184]. The EV marker CD9 was labeled to monitor EV secretion, and fluorescent MMP substrates measured extracellular MMP activity. The results showed a positive correlation between single-cell EV and MMP secretion. Hattori et al. monitored the release of EVs from single cells in droplets during 36 h and indicated that cell division facilitated the secretion of EVs [185]. Wang et al. developed a droplet microfluidic coupled SERS platform for detecting protein expression levels of single-cell exosomes (Fig. S7B in Supporting information) [186]. The exosome capture probe, SERS activity detection probe, and single cell were encapsulated in a droplet. Immuno-sandwich structures were successfully constructed only when exosomes were present as bridges and SERS signaling was observed. Differences in single-cell exosome proteins were investigated using this method, and normal breast cells showed lower expression of CEA, CD44, and PD-L1 than breast cancer cells.
Microfluidic methods for single-cell EV analysis still face limitations such as complex operation and low throughput, with detection primarily relying on the specific recognition of EV surface proteins. Improving single-cell encapsulation efficiency and integrating more detection methods will be the future development trend.
The isolation and detection of EVs have attracted extensive research due to their great potential as disease markers. Compared with traditional EV separation methods, microfluidics has the advantages of high throughput, low cost, integration, and simple operation, and is easy to be coupled with various detection techniques to achieve rapid and accurate EV analysis. We have reviewed advanced microfluidic techniques for efficient separation of high-purity EVs from different biological samples. Microfluidic devices enable label-free separation of EVs based on their physical properties by utilizing hydrodynamic effects or applying additional physical fields. Alternatively, immunoaffinity-based methods isolate EV subpopulations with specific proteins by antibody-modified microparticles or microstructures. Multiple detection techniques (fluorescence, electrochemistry, SPR, and SERS) are coupled with microfluidics to analyse EVs from clinical samples, demonstrating the effectiveness of these methods in disease diagnosis. Furthermore, microfluidics allows single-cell EV analysis, facilitating the understanding of physiological functions of EVs at the single-cell level.
Although microfluidics has made significant progress in EV separation and analysis, there are still some challenges and limitations. The low concentration and wide size range (50–5000 nm) of EVs in biological samples require microfluidic devices with efficient EV separation and superior size resolution. In addition, some microfluidic chips have the relatively high design complexity, which increases the likelihood of errors occurring during actual operation. Finally, most microfluidic-based methods for EV separation and analysis are still in the laboratory stage, and few microfluidic methods have been extensively clinically validated. In the future, the development of microfluidics in EV isolation and analysis may be in the following directions. First, microfluidic platforms combining multiple separation mechanisms improve the size resolution and purity of EV separation. The large-scale integration of the chip can dramatically increase the sample processing capacity. Meanwhile, coupling the microfluidic chip with mass spectrometry allows for obtaining more comprehensive information about EV components, including RNAs, DNAs, metabolites, proteins, and lipids. This capability is highly beneficial for multidimensional EV analysis and the discovery of new biological markers. Artificial intelligence (AI) can be used for real-time analysis of large amounts of EV detection data, automatically identifying and classifying different types of EVs to further enhance analytical accuracy and throughput. In addition, AI can integrate machine learning models to predict EV characteristics in clinical samples, thereby supporting personalized diagnostic and therapeutic decision-making. Then, the development of manufacturing technologies may improve the processing accuracy and reduce the manufacturing cost of microfluidic chips, improving the standardization of the chips to meet the requirements of clinical testing. Finally, standardization and reproducibility are key challenges in the clinical translation of microfluidic technology. Variations in equipment and reagents across different laboratories and manufacturers may lead to inconsistent results, limiting its widespread adoption. To advance the clinical application of microfluidics, addressing equipment standardization, process optimization, and batch-to-batch variability is essential. Furthermore, large-scale clinical validation remains a crucial prerequisite for the genuine application of microfluidics in clinical diagnosis and treatment. It is essential to validate microfluidic methods using a large number of clinical samples (plasma, serum, urine, and saliva) to ensure their efficacy and accuracy. Microfluidic method based on immunoaffinity separation may represent a future direction for development. This technique facilitates rapid isolation of EVs with specific biomarkers from samples without requiring complex equipment, potentially aiding in the early diagnosis of diseases.
Yang Song: Writing – review & editing, Writing – original draft, Conceptualization. Jin-Ming Lin: Writing – review & editing, Supervision, Investigation, Funding acquisition, Formal analysis, Conceptualization.
The authors declare that they have no known competing financial interests or personal relationships that could have appeared to influence the work reported in this paper.
This work was supported by the National Key R & D Program of China (No. 2022YFC3400700) and the National Natural Science Foundation of China (No. 22034005).
Supplementary material associated with this article can be found, in the online version, at doi:
G. van Niel, G. D'Angelo, G. Raposo, Nat. Rev. Mol. Cell Biol. 19 (2018) 213–228. doi: 10.1038/nrm.2017.125
S. Zhang, J. Deng, J. Li, et al., Trac-Trends Anal. Chem. 157 (2022) 116817. doi: 10.1016/j.trac.2022.116817
M. Mathieu, L. Martin-Jaular, G. Lavieu, C. Théry, Nat. Cell Biol. 21 (2019) 9–17. doi: 10.1038/s41556-018-0250-9
R. Kalluri, V.S. LeBleu, Science 367 (2020) eaau6977. doi: 10.1126/science.aau6977
Y.J. Liu, C. Wang, Cell Commun. Signal. 21 (2023) 77. doi: 10.1186/s12964-023-01103-6
S. Maacha, A.A. Bhat, L. Jimenez, et al., Mol. Cancer 18 (2019) 55. doi: 10.1186/s12943-019-0965-7
P.D. Robbins, A.E. Morelli, Nat. Rev. Immunol. 14 (2014) 195–208. doi: 10.1038/nri3622
J. Wang, J. Jing, C. Zhou, Y. Fan, Int. J. Oral Sci. 16 (2024) 4. doi: 10.1038/s41368-023-00274-9
M.L. Merchant, I.M. Rood, J.K.J. Deegens, J.B. Klein, Nat. Rev. Nephrol. 13 (2017) 731–749.
R. Shah, T. Patel, J.E. Freedman, N. Engl. J. Med. 379 (2018) 958–966. doi: 10.1056/NEJMra1704286
K. O'Brien, K. Breyne, S. Ughetto, L.C. Laurent, X.O. Breakefield, Nat. Rev. Mol. Cell Biol. 21 (2020) 585–606. doi: 10.1038/s41580-020-0251-y
L. Zou, M. Cheng, K. Hu, J. Feng, L. Tu, Chin. Chem. Lett. 35 (2024) 109129. doi: 10.1016/j.cclet.2023.109129
L. Zheng, B. Hu, D. Zhao, et al., Chin. Chem. Lett. 35 (2024) 108647. doi: 10.1016/j.cclet.2023.108647
T. Liangsupree, E. Multia, M.L. Riekkola, J. Chromatogr. A 1636 (2021) 461773. doi: 10.1016/j.chroma.2020.461773
Y. Jia, L. Yu, T. Ma, et al., Theranostics 12 (2022) 6548–6575. doi: 10.7150/thno.74305
T. Wang, Y. Xing, Z. Cheng, F. Yu, Trac-Trends Anal. Chem. 152 (2022) 116604. doi: 10.1016/j.trac.2022.116604
M.I. Ramirez, M.G. Amorim, C. Gadelha, et al., Nanoscale 10 (2018) 881–906. doi: 10.1039/C7NR08360B
H. Shao, H. Im, C.M. Castro, et al., Chem. Rev. 118 (2018) 1917–1950. doi: 10.1021/acs.chemrev.7b00534
N. Ludwig, T.L. Whiteside, T.E. Reichert, Int. J. Mol. Sci. 20 (2019) 4684. doi: 10.3390/ijms20194684
S.C. Guo, S.C. Tao, H. Dawn, J. Extracell. Vesicles 7 (2018) 1508271. doi: 10.1080/20013078.2018.1508271
Y. Tian, M. Gong, Y. Hu, et al., J. Extracell. Vesicles 9 (2020) 1697028. doi: 10.1080/20013078.2019.1697028
J. Chen, P. Li, T. Zhang, et al., Front. Bioeng. Biotechnol. 9 (2022) 811971. doi: 10.3389/fbioe.2021.811971
K. Sidhom, P.O. Obi, A. Saleem, Int. J. Mol. Sci. 21 (2020) 6466. doi: 10.3390/ijms21186466
L.M. Doyle, M.Z. Wang, Cells 8 (2019) 727. doi: 10.3390/cells8070727
L. Ding, X. Yang, Z. Gao, et al., Small 17 (2021) 2007174. doi: 10.1002/smll.202007174
S. Gholizadeh, M. Shehata Draz, M. Zarghooni, et al., Biosens. Bioelectron. 91 (2017) 588–605. doi: 10.1016/j.bios.2016.12.062
J. Chen, M. Zheng, Q. Xiao, et al., Micromachines 15 (2024) 630. doi: 10.3390/mi15050630
D. Li, Y. Zhao, Z. Nie, et al., Chem. Commun. 61 (2025) 14022–14038. doi: 10.1039/D5CC02460A
G. Zhang, X. Huang, S. Liu, et al., Lab Chip 25 (2025) 1228–1255. doi: 10.1039/D4LC00777H
S. Cheng, Y. Li, H. Yan, et al., Lab Chip 21 (2021) 3219–3243. doi: 10.1039/D1LC00443C
I. Bouhid de Aguiar, K. Schroën, Membranes 10 (2020) 316. doi: 10.3390/membranes10110316
S. Busatto, G. Vilanilam, T. Ticer, et al., Cells 7 (2018) 273. doi: 10.3390/cells7120273
S. Wang, Q. Xu, Y. Cai, et al., Interdiscip. Med. 2 (2024) e20240003. doi: 10.1002/INMD.20240003
X. Zhao, X. Liu, T. Chen, et al., ACS Nano 19 (2025) 8948–8965. doi: 10.1021/acsnano.4c16988
G. Kim, M. Seo, J. Xu, et al., Small Methods 8 (2024) 2301624.
H.K. Woo, V. Sunkara, J. Park, et al., ACS Nano 11 (2017) 1360–1370. doi: 10.1021/acsnano.6b06131
F. Liu, O. Vermesh, V. Mani, et al., ACS Nano 11 (2017) 10712–10723. doi: 10.1021/acsnano.7b04878
Z. Li, C. Liu, Y. Cheng, et al., Sci. Adv. 9 (2023) eade2819. doi: 10.1126/sciadv.ade2819
C.J. Kim, D.Y. Ki, J. Park, et al., Lab Chip 20 (2020) 949–957. doi: 10.1039/C9LC01140D
Z. Han, C. Peng, J. Yi, et al., Sens. Actuator B: Chem. 333 (2021) 129563. doi: 10.1016/j.snb.2021.129563
Y. Xie, J. Rufo, R. Zhong, et al., ACS Nano 14 (2020) 16220–16240. doi: 10.1021/acsnano.0c06336
T. Salafi, K.K. Zeming, Y. Zhang, Lab Chip 17 (2017) 11–33. doi: 10.1039/C6LC01045H
T. Salafi, Y. Zhang, Y. Zhang, Nano-Micro Lett. 11 (2019) 77. doi: 10.1007/s40820-019-0308-7
J. McGrath, M. Jimenez, H. Bridle, Lab Chip 14 (2014) 4139–4158. doi: 10.1039/C4LC00939H
B.H. Wunsch, J.T. Smith, S.M. Gifford, et al., Nat. Nanotechnol. 11 (2016) 936–940. doi: 10.1038/nnano.2016.134
J.T. Smith, B.H. Wunsch, N. Dogra, et al., Lab Chip 18 (2018) 3913–3925. doi: 10.1039/C8LC01017J
N. Xiang, Z. Ni, Lab Chip 22 (2022) 4792–4804. doi: 10.1039/D2LC00722C
M. Bagi, F. Amjad, S.M. Ghoreishian, et al., Biochip J. 18 (2024) 45–67. doi: 10.1007/s13206-023-00131-1
S.Y. Leong, W.W. Lok, K.Y. Goh, et al., ACS Nano 18 (2024) 6623–6637. doi: 10.1021/acsnano.3c12862
S. Zhou, T. Hu, F. Zhang, et al., Anal. Chem. 92 (2020) 1574–1581. doi: 10.1021/acs.analchem.9b04852
H.M. Tay, S.Y. Leong, X. Xu, et al., Lab Chip 21 (2021) 2511–2523. doi: 10.1039/D1LC00333J
C. Liu, J. Guo, F. Tian, et al., ACS Nano 11 (2017) 6968–6976. doi: 10.1021/acsnano.7b02277
C. Liu, J. Zhao, F. Tian, et al., J. Am. Chem. Soc. 141 (2019) 3817–3821. doi: 10.1021/jacs.9b00007
J.J. Bai, X. Zhang, X. Wei, et al., Anal. Chem. 95 (2023) 2523–2531. doi: 10.1021/acs.analchem.2c04898
Y. Meng, Y. Zhang, M. Bühler, et al., Sci. Adv. 9 (2023) eadi5296. doi: 10.1126/sciadv.adi5296
Y. Song, Q. Zhang, J. Lin, J. Wang, J.M. Lin, Anal. Chem. 97 (2025) 18689–18696. doi: 10.1021/acs.analchem.5c03052
A. Srivastav, T. Podgorski, G. Coupier, Microfluid. Nanofluid 13 (2012) 697–701. doi: 10.1007/s10404-012-0985-8
S.R. Risbud, G. Drazer, Microfluid. Nanofluid 17 (2014) 1003–1009. doi: 10.1007/s10404-014-1404-0
X. Lu, X. Xuan, Anal. Chem. 87 (2015) 4560–4565. doi: 10.1021/acs.analchem.5b00752
M. Yamada, M. Nakashima, M. Seki, Anal. Chem. 76 (2004) 5465–5471. doi: 10.1021/ac049863r
S. Shin, D. Han, M.C. Park, et al., Sci. Rep. 7 (2017) 9907. doi: 10.1038/s41598-017-08826-w
M. Wagner, S. Holzschuh, A. Traeger, A. Fahr, U.S. Schubert, Anal. Chem. 86 (2014) 5201–5210. doi: 10.1021/ac501664t
Y. Wang, C.W. Cuss, W. Shotyk, J. Chromatogr. A 1632 (2020) 461600. doi: 10.1016/j.chroma.2020.461600
H. Zhang, D. Freitas, H.S. Kim, et al., Nat. Cell Biol. 20 (2018) 332–343. doi: 10.1038/s41556-018-0040-4
S. Sitar, A. Kejžar, D. Pahovnik, et al., Anal. Chem. 87 (2015) 9225–9233. doi: 10.1021/acs.analchem.5b01636
J. Ashby, K. Flack, L.A. Jimenez, et al., Anal. Chem. 86 (2014) 9343–9349. doi: 10.1021/ac5028929
K.E. Petersen, E. Manangon, J.L. Hood, et al., Anal. Bioanal. Chem. 406 (2014) 7855–7866. doi: 10.1007/s00216-014-8040-0
H. Zhang, D. Lyden, Nat. Protoc. 14 (2019) 1027–1053. doi: 10.1038/s41596-019-0126-x
H. Zhang, H. Chang, P. Neuzil, Micromachines 10 (2019) 423. doi: 10.3390/mi10060423
B. Cetin, D. Li, Electrophoresis 32 (2011) 2410–2427. doi: 10.1002/elps.201100167
C. Zhang, K. Khoshmanesh, A. Mitchell, K. Kalantar-zadeh, Anal. Bioanal. Chem. 396 (2010) 401–420. doi: 10.1007/s00216-009-2922-6
J. Yao, K. Zhao, J. Lou, K. Zhang, Biosensors 14 (2024) 417. doi: 10.3390/bios14090417
E.A. Kwizera, M. Sun, A.M. White, J. Li, X. He, ACS Biomater. Sci. Eng. 7 (2021) 2043–2063. doi: 10.1021/acsbiomaterials.1c00083
W.J. Soong, C.H. Wang, C. Chen, G.B. Lee, Lab Chip 24 (2024) 1965–1976. doi: 10.1039/D3LC01007D
H. Hadady, F. Karamali, F. Ejeian, et al., Electrophoresis 42 (2021) 2018–2026. doi: 10.1002/elps.202000376
S.D. Ibsen, J. Wright, J.M. Lewis, et al., ACS Nano 11 (2017) 6641–6651. doi: 10.1021/acsnano.7b00549
M. Lan, Z. Ren, C. Cheng, G. Li, F. Yang, Biosens. Bioelectron. 259 (2024) 116382. doi: 10.1016/j.bios.2024.116382
S. Ayala-Mar, V.H. Perez-Gonzalez, M.A. Mata-Gómez, R.C. Gallo-Villanueva, J. González-Valdez, Anal. Chem. 91 (2019) 14975–14982. doi: 10.1021/acs.analchem.9b03448
L. Shi, A. Rana, L. Esfandiari, Sci. Rep. 8 (2018) 6751. doi: 10.1038/s41598-018-25026-2
W. Li, Z. Yao, T. Ma, et al., Adv. Colloid Interface Sci. 332 (2024) 103276. doi: 10.1016/j.cis.2024.103276
A. Ozcelik, J. Rufo, F. Guo, et al., Nat. Methods 15 (2018) 1021–1028. doi: 10.1038/s41592-018-0222-9
Y. Li, S. Cai, H. Shen, et al., Biomicrofluidics 16 (2022) 031502. doi: 10.1063/5.0089051
T. Zhang, T. Zhou, Q. Cui, et al., ACS Sens. 10 (2025) 5299–5313. doi: 10.1021/acssensors.5c01896
Y. Gu, C. Chen, Z. Mao, et al., Sci. Adv. 7 (2021) eabc0467. doi: 10.1126/sciadv.abc0467
P. Dumcius, R. Mikhaylov, X. Zhang, et al., Small 19 (2023) 2300390. ˇ doi: 10.1002/smll.202300390
M. Wu, C. Chen, Z. Wang, et al., Lab Chip 19 (2019) 1174–1182. doi: 10.1039/C8LC01134F
J. Zhang, C. Chen, R. Becker, et al., Sci. Adv. 8 (2022) eade0640. doi: 10.1126/sciadv.ade0640
M. Chen, Z. Pei, Y. Wang, et al., Analyst 149 (2024) 3169–3177. doi: 10.1039/D4AN00034J
Y. Liu, W. Zhao, R. Cheng, et al., Lab Chip 20 (2020) 3187–3201. doi: 10.1039/D0LC00609B
L. Zeng, S. Hu, X. Chen, et al., Lab Chip 22 (2022) 2476–2488. doi: 10.1039/D2LC00217E
W. Zhao, R. Cheng, J.R. Miller, L. Mao, Adv. Funct. Mater. 26 (2016) 3916–3932. doi: 10.1002/adfm.201504178
F. Alnaimat, S. Dagher, B. Mathew, A. Hilal-Alnqbi, S. Khashan, Chem. Rec. 18 (2018) 1596–1612. doi: 10.1002/tcr.201800018
L. Liang, J. Zhu, X. Xuan, Biomicrofluidics 5 (2011) 034110. doi: 10.1063/1.3618737
Z. Chen, S.B. Cheng, P. Cao, et al., Biosens. Bioelectron. 122 (2018) 211–216. doi: 10.1016/j.bios.2018.09.033
C.L. Hisey, K.D.P. Dorayappan, D.E. Cohn, K. Selvendiran, D.J. Hansford, Lab Chip 18 (2018) 3144–3153. doi: 10.1039/C8LC00834E
Y. Bai, Y. Lu, K. Wang, et al., Nano-Micro Lett. 11 (2019) 59. doi: 10.1007/s40820-019-0285-x
M. Lan, D. Wu, C. Cheng, et al., Anal. Chem. 97 (2025) 5678–5687. doi: 10.1021/acs.analchem.4c06592
L.J. Sha, B. Bo, J.Y. Li, et al., Chin. Chem. Lett. 36 (2025) 110109. doi: 10.1016/j.cclet.2024.110109
P. Zhang, X. Zhou, M. He, et al., Nat. Biomed. Eng. 3 (2019) 438–451. doi: 10.1038/s41551-019-0356-9
T.W. Lo, Z. Zhu, E. Purcell, et al., Lab Chip 20 (2020) 1762–1770. doi: 10.1039/C9LC01190K
D. Yu, J. Gu, J. Zhang, et al., ACS Nano 19 (2025) 10078–10092. doi: 10.1021/acsnano.4c16894
S. Wen, L. Zhang, Z. Huang, et al., Chin. Chem. Lett. (2025) 111333.
G. Yang, Z. Li, R. Usman, et al., Chin. Chem. Lett. 36 (2025) 109930. doi: 10.1016/j.cclet.2024.109930
L. Yang, H. Guo, T. Hou, B. An, F. Li, Chin. Chem. Lett. 34 (2023) 107607. doi: 10.1016/j.cclet.2022.06.030
J.W. Zhao, J.P. Tang, Z. Cui, et al., Chin. Chem. Lett. 35 (2024) 109303. doi: 10.1016/j.cclet.2023.109303
H. Jia, W. Meng, R. Gao, et al., Biosensors 14 (2024) 579. doi: 10.3390/bios14120579
Q. Wu, Y. Zeng, W. Wang, et al., J. Am. Chem. Soc. 147 (2025) 10737–10749. doi: 10.1021/jacs.5c01973
V. Riazanski, G. Mauleon, K. Lucas, et al., Commun. Biol. 5 (2022) 13. doi: 10.1038/s42003-021-02965-7
K.T. Gustafson, K.T. Huynh, D. Heineck, et al., Lab Chip 21 (2021) 1318–1332. doi: 10.1039/D0LC00940G
J. Feng, B.L. Xiao, L.Z. Zhang, et al., Anal. Chem. 95 (2023) 7753–7760. doi: 10.1021/acs.analchem.3c00940
L. Zheng, H. Wang, P. Zuo, et al., Anal. Chem. 94 (2022) 7703–7712. doi: 10.1021/acs.analchem.2c01187
S. Hu, R. Hao, Z. Yu, H. Zhang, H. Yang, Chin. Chem. Lett. 35 (2024) 108534. doi: 10.1016/j.cclet.2023.108534
Y. Ren, K. Ge, D. Sun, et al., Biosens. Bioelectron. 199 (2022) 113870. doi: 10.1016/j.bios.2021.113870
Z.L. Yu, Z.Y. Wu, X.C. Liu, et al., Anal. Chem. 96 (2024) 14980–14988. doi: 10.1021/acs.analchem.4c03101
J. Wu, Z. Lin, Z. Zou, et al., J. Am. Chem. Soc. 144 (2022) 23483–23491. doi: 10.1021/jacs.2c10042
P. Li, J. Chen, Y. Chen, et al., Small 19 (2023) 2207381. doi: 10.1002/smll.202207381
Q. Zhou, A. Rahimian, K. Son, et al., Methods 97 (2016) 88–93. doi: 10.1016/j.ymeth.2015.10.012
L. Kashefi-Kheyrabadi, J. Kim, S. Chakravarty, et al., Biosens. Bioelectron. 169 (2020) 112622. doi: 10.1016/j.bios.2020.112622
F.G. Ortega, S.V. Piguillem, G.A. Messina, et al., Talanta 194 (2019) 243–252. doi: 10.1016/j.talanta.2018.10.016
S. Cavallaro, J. Horak, P. Hååg, et al., ACS Sens. 4 (2019) 1399–1408. doi: 10.1021/acssensors.9b00418
M. Li, P. Yang, J. Wu, et al., Microchem. J. 203 (2024) 110875. doi: 10.1016/j.microc.2024.110875
Y. Wang, W. Gao, M. Sun, et al., Biosens. Bioelectron. 239 (2023) 115590. doi: 10.1016/j.bios.2023.115590
H. Xu, C. Liao, P. Zuo, Z. Liu, B.C. Ye, Anal. Chem. 90 (2018) 13451–13458. doi: 10.1021/acs.analchem.8b03272
Y.H. Kwon, S. Park, H. Jiang, et al., Biosens. Bioelectron. 267 (2025) 116792. doi: 10.1016/j.bios.2024.116792
H. Im, H. Shao, Y.I. Park, et al., Nat. Biotechnol. 32 (2014) 490–495. doi: 10.1038/nbt.2886
C. Liu, X. Zeng, Z. An, et al., ACS Sens. 3 (2018) 1471–1479. doi: 10.1021/acssensors.8b00230
C.Z.J. Lim, Y. Zhang, Y. Chen, et al., Nat. Commun. 10 (2019) 1144. doi: 10.1038/s41467-019-09030-2
C. Zhai, J. Long, J. He, et al., ACS Nano 17 (2023) 16656–16667. doi: 10.1021/acsnano.3c02853
Y. Yildizhan, V.S. Vajrala, E. Geeurickx, et al., J. Extracell. Vesicles 10 (2021) e12059. doi: 10.1002/jev2.12059
L. Zhu, K. Wang, J. Cui, et al., Anal. Chem. 86 (2014) 8857–8864. doi: 10.1021/ac5023056
H. Feng, S. Min, Y. Huang, et al., Sens. Actuator B: Chem. 400 (2024) 134899. doi: 10.1016/j.snb.2023.134899
L.A. Lane, X. Qian, S. Nie, Chem. Rev. 115 (2015) 10489–10529. doi: 10.1021/acs.chemrev.5b00265
S.Y. Ding, E.M. You, Z.Q. Tian, M. Moskovits, Chem. Soc. Rev. 46 (2017) 4042–4076. doi: 10.1039/C7CS00238F
H. Ma, S.Q. Pan, W.L. Wang, et al., ACS Nano 18 (2024) 14000–14019. doi: 10.1021/acsnano.4c02670
C. Zong, M. Xu, L.J. Xu, et al., Chem. Rev. 118 (2018) 4946–4980. doi: 10.1021/acs.chemrev.7b00668
S.E.J. Bell, G. Charron, E. Cortés, et al., Angew. Chem. Int. Ed. 59 (2020) 5454–5462. doi: 10.1002/anie.201908154
K. Xu, R. Zhou, K. Takei, M. Hong, Adv. Sci. 6 (2019) 1900925. doi: 10.1002/advs.201900925
M. Fan, G.F.S. Andrade, A.G. Brolo, Anal. Chim. Acta 1097 (2020) 1–29.
Y. Wang, Q. Li, H. Shi, et al., Lab Chip 20 (2020) 4632–4637. doi: 10.1039/D0LC00677G
J. Wang, Y.C. Kao, Q. Zhou, et al., Adv. Funct. Mater. 32 (2022) 2010296. doi: 10.1002/adfm.202010296
G. Zhang, Y. Wang, W. Zhou, et al., Angew. Chem. Int. Ed. 62 (2023) e202315113. doi: 10.1002/anie.202315113
M. Jalali, I. Isaac Hosseini, T. AbdelFatah, et al., Lab Chip 21 (2021) 855–866. doi: 10.1039/D0LC00957A
Z. Han, X. Peng, Y. Yang, et al., Biosens. Bioelectron. 217 (2022) 114709. doi: 10.1016/j.bios.2022.114709
K.H.W. Ho, H. Lai, R. Zhang, et al., ACS Sens. 9 (2024) 4860–4869. doi: 10.1021/acssensors.4c01357
Q. Zhou, X. Niu, Z. Zhang, et al., Adv. Sci. 11 (2024) 2401818. doi: 10.1002/advs.202401818
J. Ma, K. Li, Z. Duan, et al., Anal. Chem. 97 (2025) 7483–7489. doi: 10.1021/acs.analchem.5c00426
X. Chen, J. Tang, Y. Zhao, et al., Biosens. Bioelectron. 267 (2025) 116724. doi: 10.1016/j.bios.2024.116724
Q. Huang, S. Mao, M. Khan, J.M. Lin, Analyst 144 (2019) 808–823. doi: 10.1039/C8AN01079J
Y. Liu, Z. Fan, L. Qiao, B. Liu, Trac-Trends Anal. Chem. 157 (2022) 116822. doi: 10.1016/j.trac.2022.116822
Y. Wu, Y. Meng, Trac-Trends Anal. Chem. 168 (2023) 117301. doi: 10.1016/j.trac.2023.117301
T.N. Chen, A. Gupta, M.D. Zalavadia, A. Streets, Lab Chip 20 (2020) 3899–3913. doi: 10.1039/D0LC00169D
C. Zheng, G.E. Chen, Y. Pang, Y. Huang, Sci. China Chem. 55 (2012) 502–507. doi: 10.1007/s11426-012-4493-1
Y. Zhou, S. Basu, K.J. Wohlfahrt, et al., Sens. Actuator B: Chem. 232 (2016) 680–691. doi: 10.1016/j.snb.2016.03.131
H.S. Rho, Y. Yang, A.T. Hanke, et al., Lab Chip 16 (2016) 305–311. doi: 10.1039/C5LC01206F
C. Chen, Y. Zhu, J.W.K. Ho, H. Chen, MethodsX 8 (2021) 101190. doi: 10.1016/j.mex.2020.101190
C. Wang, J. Qiu, M. Liu, et al., Adv. Sci. 11 (2024) 2401263. doi: 10.1002/advs.202401263
C. Chen, D. Xu, S. Bai, et al., Lab Chip 20 (2020) 1227–1237. doi: 10.1039/D0LC00040J
J. Briones, W. Espulgar, S. Koyama, et al., Sci. Rep. 11 (2021) 12995. doi: 10.1038/s41598-021-92472-w
K. Chung, C.A. Rivet, M.L. Kemp, H. Lu, Anal. Chem. 83 (2011) 7044–7052. doi: 10.1021/ac2011153
A. Ahmad Khalili, M.R. Ahmad, M. Takeuchi, et al., Appl. Sci. 6 (2016) 40. doi: 10.3390/app6020040
T.H. Nguyen, N.A.N. Thi, H.B. Thu, et al., Microfluid. Nanofluid. 28 (2024) 35. doi: 10.1007/s10404-024-02734-y
S.A. Kobel, O. Burri, A. Griffa, et al., Lab Chip 12 (2012) 2843–2849. doi: 10.1039/c2lc40317j
S.H. Jin, S.C. Jang, B. Lee, et al., Lab Chip 16 (2016) 1358–1365. doi: 10.1039/C5LC01422K
P. Zhang, X. Han, J. Yao, et al., Angew. Chem. Int. Ed. 58 (2019) 13700–13705. doi: 10.1002/anie.201903694
T. Xuanyuan, M. Sun, J. Zhang, et al., Adv. Mater. Technol. 10 (2025) 2401018. doi: 10.1002/admt.202401018
Y. Lu, J.J. Chen, L. Mu, et al., Anal. Chem. 85 (2013) 2548–2556. doi: 10.1021/ac400082e
D. Liu, M. Sun, J. Zhang, et al., Analyst 147 (2022) 2294–2316. doi: 10.1039/D1AN02321G
Y. Shang, Z. Wang, L. Xi, et al., Biotechnol. Adv. 77 (2024) 108454. doi: 10.1016/j.biotechadv.2024.108454
K. Matula, F. Rivello, W.T.S. Huck, Adv. Biosyst. 4 (2020) 1900188. doi: 10.1002/adbi.201900188
T.P. Lagus, J.F. Edd, J. Phys. D: Appl. Phys. 46 (2013) 114005. doi: 10.1088/0022-3727/46/11/114005
J. Zhou, A. Wei, A. Bertsch, P. Renaud, Lab Chip 22 (2022) 4841–4848. doi: 10.1039/D2LC00841F
L. Li, P. Wu, Z. Luo, et al., ACS Sens. 4 (2019) 1299–1305. doi: 10.1021/acssensors.9b00171
W. Cai, Y.J. Chiu, V. Ramakrishnan, et al., Lab Chip 18 (2018) 3154–3162. doi: 10.1039/C8LC00821C
H. Zhang, X. Zheng, T. Zhao, et al., ACS Sens. 8 (2023) 2583–2590. doi: 10.1021/acssensors.3c00288
F. Zhu, Y. Ji, L. Li, et al., Anal. Chem. 93 (2021) 13152–13160. doi: 10.1021/acs.analchem.1c01446
M. Fathi, R. Joseph, J.R.T. Adolacion, et al., Cancers 13 (2021) 4397. doi: 10.3390/cancers13174397
K.J. Son, A. Rahimian, D.S. Shin, et al., Analyst 141 (2016) 679–688. doi: 10.1039/C5AN01648G
Y. Ji, D. Qi, L. Li, et al., Proc. Natl. Acad. Sci. U. S. A. 116 (2019) 5979–5984. doi: 10.1073/pnas.1814348116
Y.J. Chiu, W. Cai, Y.-R.V. Shih, I. Lian, Y.H. Lo, Small 12 (2016) 3658–3666. doi: 10.1002/smll.201600725
F. Song, C. Wang, C. Wang, et al., Small Methods 6 (2022) 2200717. doi: 10.1002/smtd.202200717
C. Wang, Y. Zhang, J. Wang, et al., Adv. Mater. 37 (2025) 2411259. doi: 10.1002/adma.202411259
J.M. Nikoloff, M.A. Saucedo-Espinosa, A. Kling, P.S. Dittrich, Proc. Natl. Acad. Sci. U. S. A. 118 (2021) e2106630118. doi: 10.1073/pnas.2106630118
J.M. Nikoloff, M.A. Saucedo-Espinosa, P.S. Dittrich, Anal. Chem. 95 (2023) 1933–1939. doi: 10.1021/acs.analchem.2c04106
Y. Ji, A. Wang, W. Zeng, et al., Sens. Actuator B: Chem. 423 (2025) 136836. doi: 10.1016/j.snb.2024.136836
K. Hattori, Y. Goda, M. Yamashita, et al., Anal. Chem. 94 (2022) 11209–11215. doi: 10.1021/acs.analchem.2c01609
X. Wang, J. Wang, S. Xu, Chem. Eng. J. 506 (2025) 159904. doi: 10.1016/j.cej.2025.159904

Figure 2 Microfluidic filtration for EV separation. (A) The fully integrated lab-on-a-disc equipped with two nanofilters (iExoDisc) for isolating EVs from blood. Reproduced with permission [34]. Copyright 2025, American Chemical Society. (B) The silicon nitride nanosieve chip for isolating exosomes from human serum. Reproduced with permission [35]. Copyright 2024, Wiley-VCH. (C) Cascaded microfluidic circuits for pulsatile filtration of EVs. Reproduced with permission [38]. Copyright 2023, AAAS.

Figure 3 Microfluidic hydrodynamic separation of EVs. (A) Nano deterministic lateral displacement (nDLD) for high resolution isolation of EVs. Reproduced with permission [45]. Copyright 2016, Springer Nature. (B) Inertial microfluidic device (ExoArc) for the isolation of EVs from plasma. Reproduced with permission [49]. Copyright 2024, American Chemical Society. (C) An integrated microfluidic system for the isolation of sEV from whole blood. Reproduced with permission [55]. Copyright 2023, AAAS. (D) A Dean-flow-coupled elasto-inertial microfluidic chip (DEIC) for isolation of exosomes with low protein contamination. Reproduced with permission [54]. Copyright 2023, American Chemical Society. (E) Dean flow-assisted microfluidic aqueous two-phase extraction chip for isolation of EVs from cell culture media. Reproduced with permission [56]. Copyright 2025, American Chemical Society.

Figure 4 Pinched flow fractionation (PFF) and asymmetric flow field-flow fractionation (AF4) for EV separation. (A) The particle separation principle of PPF. Reproduced with permission [60]. Copyright 2004, American Chemical Society. (B) PPF for isolation of exosomes and apoptotic bodies. Reproduced with permission [61]. Copyright 2017, Springer Nature. (C) AF4 for high-resolution particle separation. Reproduced with permission [68]. Copyright 2019, Springer Nature.

Figure 5 Microfluidic device integrated with physical fields for EV separation. (A) Alternating current electrokinetic dielectrophoresis (DEP) microarray chip for isolating exosomes from plasma. Reproduced with permission [76]. Copyright 2017, American Chemical Society. (B) Direct current-insulator-based DEP (DC-iDEP) method for size-based capture and isolation of exosomes. Reproduced with permission [78]. Copyright 2019, American Chemical Society. (C) Acoustofluidic centrifuge for rapid nanoparticle concentration and separation. Reproduced with permission [84]. Copyright 2021, AAAS. (D) acoustic nanoscale separation via wave-pillar excitation resonance (ANSWER). Reproduced with permission [87]. Copyright 2022, AAAS. (E) Ferrohydrodynamics-based microfluidic device for the isolation of exosomes from cell culture medium and human serum. Reproduced with permission [89]. Copyright 2020, Royal Society of Chemistry. (F) On-chip ferrofluid-based separation platform for efficient isolation of sEVs from cell culture medium. Reproduced with permission [90]. Copyright 2022, Royal Society of Chemistry.

Figure 6 Immunoaffinity-based EV separation. (A) A 3D nanostructured herringbone (nano-HB) chip for the immunocapture of circulating exosomes. Reproduced with permission [99]. Copyright 2019, Springer Nature. (B) CD66b antibody-coupled Dynabeads for isolating neutrophil extracellular vesicles (NEVs). Reproduced with permission [101]. Copyright 2025, American Chemical Society.

Figure 7 Microfluidic-based EV fluorescence detection. (A) A microfluidic chip for the enrichment and detection of EVs and on-chip gel electrophoresis was used to remove unbound fluorescent probes and enhance the fluorescent signal. Reproduced with permission [113]. Copyright 2022, Elsevier. (B) The 3D porous sponge chip for exosome SORL1 detection and colorectal cancer diagnosis. Reproduced with permission [116]. Copyright 2023, Wiley-VCH.

Figure 8 Microfluidic-based EV electrochemical detection. (A) Integrated EpCAM aptamer-modified gold electrodes with herringbone microfluidic chips for tumor exosome detection. Reproduced with permission [121]. Copyright 2024, Elsevier. (B) High-resolution spiral microfluidic channel-integrated electrochemical device (HiMEc) for removing lipoproteins and detecting EVs. Reproduced with permission [124]. Copyright 2025, Elsevier.

Figure 9 Microfluidic-based surface plasmon resonance (SPR) and surface-enhanced Raman spectroscopy (SERS) for EV detection. (A) SPR imaging (SPRi) combined with antibody microarrays to quantify exosomes in cell culture medium. Reproduced with permission [130]. Copyright 2014, American Chemical Society. (B) A droplet microfluidic platform integrated with SERS-based aptasensor. Reproduced with permission [144]. Copyright 2024, American Chemical Society.

Figure 10 Microfluidic-based single-cell isolation method. (A) Nanoliter microchambers-integrated chip for high-throughput secretomic analysis of single cells. Reproduced with permission [166]. Copyright 2013, American Chemical Society. (B) Microfluidic system with serpentine and spiral channels for cell and bead co-encapsulation. Reproduced with permission [172]. Copyright 2019, American Chemical Society.

Figure 11 Microwell-based single-cell EV analysis. (A) Microfluidic platform combining a microchamber array and an antibody barcode slide for multiplexed analysis of single-cell EVs. Reproduced with permission [178]. Copyright 2019, National Academy of Sciences. (B) A high-throughput single-cell chip based on photothermal-induced migration for single-cell exosome phenotypic analysis. Reproduced with permission [181]. Copyright 2025, Wiley-VCH.

Figure 12 Valve- and droplet-based microfluidic for single-cell EV analysis. (A) Valve-based triple-layer microfluidic device. Reproduced with permission [183]. Copyright 2023, American Chemical Society. (B) Dynamic monitoring of single-cell secretion of matrix metalloproteinases (MMPs) and EVs using microdroplet arrays. Reproduced with permission [184]. Copyright 2025, Elsevier.
Table 1. Comparison of different microfluidic methods for EV separation.
| Methods | Sample | Recovery | Protein removal | Advantages | Limitations | Ref. | ||||||||||||||||||||||||||||||||||||||||||||||||||||||||||||||||||||||||||||||||||||||||||||||||
| Filtration | Blood | 74.7% | NA | Simple, high recovery | Risk of filter membrane clogging | [34] | ||||||||||||||||||||||||||||||||||||||||||||||||||||||||||||||||||||||||||||||||||||||||||||||||
| Plasma | 80% | 97% | [40] | |||||||||||||||||||||||||||||||||||||||||||||||||||||||||||||||||||||||||||||||||||||||||||||||||||
| Serum | 90% | 88.7% | [35] | |||||||||||||||||||||||||||||||||||||||||||||||||||||||||||||||||||||||||||||||||||||||||||||||||||
| Blood | 10.5% | 95% | [38] | |||||||||||||||||||||||||||||||||||||||||||||||||||||||||||||||||||||||||||||||||||||||||||||||||||
| Deterministic lateral displacement | Urine, serum | 50% | NA | High size resolution, gentle | Complicated fabrication, clogging | [46] | ||||||||||||||||||||||||||||||||||||||||||||||||||||||||||||||||||||||||||||||||||||||||||||||||
| Inertial and viscoelastic microfluidics | Plasma | NA | NA | High throughput, simple device | Polymer addition, protein contamination | [49] | ||||||||||||||||||||||||||||||||||||||||||||||||||||||||||||||||||||||||||||||||||||||||||||||||
| Blood | 87% | NA | [55] | |||||||||||||||||||||||||||||||||||||||||||||||||||||||||||||||||||||||||||||||||||||||||||||||||||
| Serum, cell culture medium | 70.6% | 91.4% | [54] | |||||||||||||||||||||||||||||||||||||||||||||||||||||||||||||||||||||||||||||||||||||||||||||||||||
| Cell culture medium | 91.1% | 95.6% | [56] | |||||||||||||||||||||||||||||||||||||||||||||||||||||||||||||||||||||||||||||||||||||||||||||||||||
| Pinched flow fractionation | Cell culture medium | NA | NA | Simple device | Need for large sheath flows | [61] | ||||||||||||||||||||||||||||||||||||||||||||||||||||||||||||||||||||||||||||||||||||||||||||||||
| Asymmetric flow field-flow fractionation | Cell culture medium | NA | NA | High size resolution, gentle | Complicated fabrication, low throughput | [64] | ||||||||||||||||||||||||||||||||||||||||||||||||||||||||||||||||||||||||||||||||||||||||||||||||
| Electrical field | Plasma | NA | NA | Highly controllable | Complicated fabrication, risk of EV damage | [76] | ||||||||||||||||||||||||||||||||||||||||||||||||||||||||||||||||||||||||||||||||||||||||||||||||
| Cell culture medium | NA | NA | [78] | |||||||||||||||||||||||||||||||||||||||||||||||||||||||||||||||||||||||||||||||||||||||||||||||||||
| Acoustic field | EVs in PBS | NA | NA | High manoeuvrability | Complicated fabrication, high cost | [84] | ||||||||||||||||||||||||||||||||||||||||||||||||||||||||||||||||||||||||||||||||||||||||||||||||
| Plasma | NA | NA | [87] | |||||||||||||||||||||||||||||||||||||||||||||||||||||||||||||||||||||||||||||||||||||||||||||||||||
| Magnetic field | Cell culture medium, serum | 94.3% | NA | Simple device | Low size resolution | [89] | ||||||||||||||||||||||||||||||||||||||||||||||||||||||||||||||||||||||||||||||||||||||||||||||||
| Cell culture medium | 85.8% | NA | [90] | |||||||||||||||||||||||||||||||||||||||||||||||||||||||||||||||||||||||||||||||||||||||||||||||||||
| Immunoaffinity-based separation | Serum | NA | NA | Selective capture, high purity | Need for specific capture probes, only EVs containing specific proteins are obtained | [101] | ||||||||||||||||||||||||||||||||||||||||||||||||||||||||||||||||||||||||||||||||||||||||||||||||
| Plasma | NA | NA | [107] | |||||||||||||||||||||||||||||||||||||||||||||||||||||||||||||||||||||||||||||||||||||||||||||||||||
| NA: Not applicable. | ||||||||||||||||||||||||||||||||||||||||||||||||||||||||||||||||||||||||||||||||||||||||||||||||||||||
 下载: 导出CSV
Table 2. Comparison of different microfluidic-based EV analytical methods.
| Analytical methods | Sample | Detection target | Advantages | Limitations | Ref. |
| Fluorescence | Plasma | Phospholipid bilayers, CD63 | High sensitivity, high specificity | Background interference, spectral overlap | [113] |
| Saliva | PD-L1, EpCAM, CD45 | [114] | |||
| Plasma | CD63, PD-L1, EpCAM | [115] | |||
| Serum | SORL1 | [116] | |||
| Electrochemical methods | Serum | EpCAM | Simple, rapid, miniaturization | Environmental disturbances, less stability | [121] |
| Blood | PSMA, EGFR, CD81, GPC1 | [122] | |||
| Serum | CD63 | [123] | |||
| Plasma | PD-L1, PD-1 | [124] | |||
| Surface plasmon resonance | Cell culture medium | CD9, CD63, CD82, CD41b, EpCAM, E-cadherin | High sensitivity | Complex instruments, high cost | [130] |
| Plasma | CD63 | [131] | |||
| Surface-enhanced Raman spectroscopy | Plasma | HER2 | High sensitivity | Reproducibility, high cost | [144] |
| Plasma | LacdiNAc, T antigen, CD81 | [145] | |||
| Cell culture medium | MUC1 | [146] | |||
| Serum | CD81, CD9, EpCAM, EGFR, CD24, CA125 | [147] |
下载: 导出CSV

 扫一扫看文章


扫一扫关注我们

 下载:
下载: