Digital Fujian Internet-of-things Laboratory of Environmental Monitoring, Fujian Key Laboratory of Pollution Control and Resource Reuse, College of Environmental and Resource Sciences, Fujian Normal University, Fuzhou 350117, China
b.
School of Civil Engineering, Fujian University of Technology, Fuzhou 350118, China
c.
College of Materials and Chemical Engineering, Minjiang University, Fuzhou 350108, China
Received Date:
10 September 2025 Accepted Date:
13 February 2026 Revised Date:
06 December 2025 Available Online:
15 October 2026
Abstract:
Metal-support active interfaces provide unique sites that enhance catalytic oxidation reactions. However, designing a catalyst that simultaneously promote both benzene ring cleavage and C−H bond scission remains a challenge. Herein, porous SiO2 derived from waste rice husk was used to disperse CeO2 nanoparticles, onto which Pt nanoparticles were deposited via ethylene glycol reflux reduction combined with steam redispersion to prepare a Pt/CeO2/SiO2 catalyst with abundant Pt−O−Ce active interfaces. Characterization and experimental results show that well-dispersed CeO2 and Pt nanoparticles increase oxygen vacancy concentration and Pt–O–Ce interfaces, thereby enhancing oxygen spillover from CeO2 to Pt and promoting styrene oxidation. The Pt–O–Ce interface accelerates the rate-determining C−H bond cleavage in benzaldehyde during styrene oxidation. Pt/CeO2/SiO2-H2O catalyst with abundant oxygen vacancies and Pt–O–Ce interfaces achieves excellent catalytic performance (T90 = 222 ℃, WHSV = 120,000 mL h−1 g−1). Moreover, it demonstrates superior thermal stability over 40 h and water-resistance against 10 vol% H2O, highlighting its industrial potential. This study offers a strategy for constructing supported catalysts with tailored active interfaces and high stability.
Volatile organic compounds (VOCs) are key pollutants that degrade air quality [1–5]. Styrene (C8H8) is a typical malodorous VOCs, which is widely used in rubber production, paint manufacturing, and the plastics fabrication industries [6–8]. Studies have looked into the deterioration of C8H8 vapor in air. Catalytic oxidation is widely recognized as one of the most promising and efficient methods for styrene degradation among conventional approaches [9]. In practical industrial waste gas treatment environments, the water vapor content is uncontrollable, leading to competitive adsorption and blockage of the active sites on the catalyst. A key challenge lies in designing catalysts capable of simultaneously activating C–H bonds and cleaving the benzene ring in C8H8, while maintaining structural stability and water resistance under extreme conditions.
Developing high-performance catalysts relies on the accurate modulation of active sites and the refinement of reaction pathways. Extensive research has focused on constructing metal−support interfaces to achieve enhanced catalytic performance. Huang et al. [10] constructed a Pd–Si interface on ZSM-5 by regulating the electronic metal–support interaction (EMSI) between Pd and Si, improving formaldehyde degradation. Xiao et al. [11] discovered that the thermally driven interaction between Ni and adjacent Pt in Pt/N-CeO2 catalysts leads to the formation of Pt–NiO interfaces, thereby enhancing toluene conversion. Juan et al. [12] synthesized a unique Pd–iC–CeO2 interface through mechanical grinding, which promotes methane conversion. Such metal−support interfaces enable the transport of adsorbates or intermediates, a phenomenon known as spillover, such as hydrogen or oxygen species [13–15]. These interfaces not only facilitate the migration of reactive species, but also act as additional catalytic sites for O2 activation, generating reactive oxygen species (e.g., O2-, O2-, O) and accelerating catalytic activity [16]. The spillover of oxygen species plays a crucial role in CO oxidation and VOCs degradation [17]. Chen et al. [18] regulated rutile-phase TiO2 through tin doping, which activated the low-temperature reverse oxygen spillover process in the Pt/TiO2 catalyst and thereby enhanced its CO oxidation activity. Wen et al. [19] found that Pt sites can activate gaseous oxygen, and the oxygen spillover from Pt sites to the MoO3 surface significantly promotes the catalytic combustion of active hydrocarbons.
The Pt–O–Ce interface plays a critical role in regulating the adsorption and activation of reactants and intermediates on catalyst surfaces. Notably, the stability and dispersion of Pt species are key for efficient Pt–O–Ce interfaces, and steam treatment effectively regulates metal dispersion in supported catalysts. Nie et al. [20] showed steam maintains Pt2+ atomic dispersion in Pt/CeO2, generates active surface lattice oxygen, and boosts low-temperature CO oxidation performance. Fan et al. [21] found steam induces Cu–OH formation and support hydroxyl enrichment, converting Cu nanoparticles to atomically dispersed Cu2+. Pt demonstrates high activity for C–H bond cleavage [22,23], while CeO2 exhibits exceptional oxygen storage-release capability [24–26]. Their synergy promotes rapid oxygen species migration and transformation at the interface, thereby accelerating VOCs oxidation [27]. Oxygen vacancies further optimize the local electronic structure of the Pt–O–Ce interface by modulating electron cloud distributions, enhancing the adsorption and conversion of reaction intermediates [28,29]. Xu et al. [30] prepared a Pt ALs/CeO2 catalyst with abundant edge Pt–O–Ce active sites via a two-step calcination method, which involves epitaxial growth of small-sized atomic layer Pt on the CeO2 surface. Wang et al. [31] prepared a high-loading and highly-dispersed Pt cluster catalyst of PtAC/CeO2-Ov@GC, enriched with Pt–O–Ce structures via a molten salt electrochemical method, which enhances the oxygen reduction reaction. Recent efforts focus on anchoring single Pt atoms or clusters on CeO2 nanoislands to prevent aggregation and maximize interfacial activity. Li et al. [32] anchored Pt atoms on CeOx nanoislands of supported on porous silica, ensuring atomic dispersion under high-temperature with oxidative and reductive conditions. Chen et al. [33] confined Pt nanoclusters on CeOx nanoislands and studied how the interaction between Pt clusters and single-atom Pt species influenced catalytic performance. However, the study of utilizing Pt–O–Ce active interfaces to promote the oxygen spillover from nanosized CeO2 remains insufficient. On Pt-CeO2 supported catalysts, oxygen transfer across the interface is a nanoscale phenomenon. Spillover occurs only on nanostructured or particulate CeO2 in direct contact with Pt, and not on bulk or ordered CeO2 [34–36].
Herein, porous SiO2 derived from waste biomass rice husks was used to support uniformly dispersed CeO2 nanoparticles. Subsequently, Pt nanoparticles were deposited onto the CeO2/SiO2 support via ethylene glycol reflux reduction combined with steam redispersion strategy, aiming to investigate the influence of synergistic effects among highly dispersed CeO2, Pt nanoparticles, and SiO2 on the formed Pt−O−Ce active interfaces. TEM, EPR, Raman, UV–vis, in-situ XPS, O2-TPO, XANES, and in-situ DRIFTs reveal that the presence of CeO2 and highly dispersed Pt nanoparticles increases oxygen vacancy concentration. Meanwhile, oxygen spillover from CeO2 to Pt promotes the oxidation of C8H8. This work provides a pathway for designing catalysts with tailored active interfaces and provides insights into the preparation of highly stable catalysts.
The effect of the SiO2 support and steam treatment on catalyst morphology was observed by SEM analysis. As shown in Fig. S1a (Supporting information), CeO2/SiO2 exhibits a clean, smooth and compact surface, suggesting that CeO2 might penetrate into the porous structure of SiO2. The morphology of the Pt/CeO2/SiO2 remains smooth and dense after Pt loading, indicating minimal structural disruption. In the absence of SiO2 support, the particle size of Pt/CeO2 (Fig. S1b in Supporting information) is larger than that of Pt/CeO2/SiO2 (Fig. S1c in Supporting information), likely due to the confinement effect of the SiO2 porous framework, which promotes the formation of finely dispersed particles. After steam treatment, the morphology of Pt/CeO2/SiO2-H2O (Fig. S1d in Supporting information) becomes loosely packed. This structural change may associate with the redispersion of Pt nanoparticles.
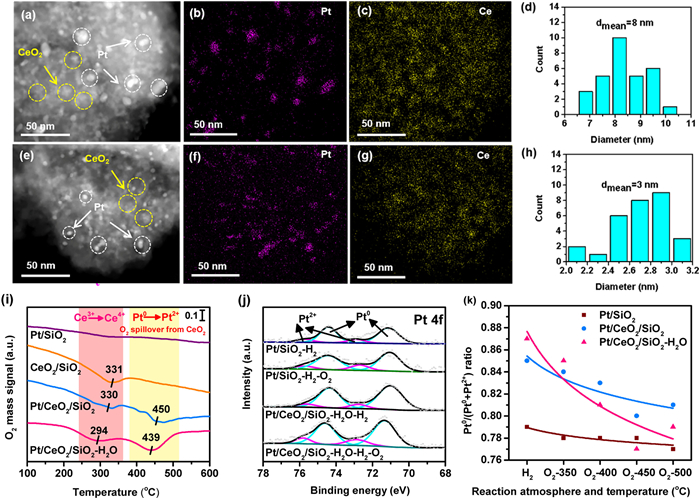
To explore the specific forms of CeO2 and Pt species, TEM images of the catalysts were collected. As shown Fig. 1, the bright regions indicated by white arrows correspond to Pt nanoparticles. In Pt/CeO2 (Fig. S2 in Supporting information), Pt nanoparticles exhibit aggregation with uneven distribution. In CeO2/SiO2 (Figs. S3a and b in Supporting information), CeO2 nanoparticles are uniformly distributed on SiO2 with an average particle size of 2 nm. After Pt loading, Pt/CeO2/SiO2 (Figs. 1a–d) displays aggregated Pt nanoparticles with an average size of 8 nm. After steam treatment, Pt nanoparticles are uniformly dispersed and the aggregates largely disappear for Pt/CeO2/SiO2-H2O (Figs. 1e–h). The average particle size decreases from 8 nm to 3 nm, which is attributed to the hydroxyl groups generated during steam treatment promoting the formation of mobile Pt–OH species, thereby facilitating the breakup and migration of Pt nanoparticles [37–39]. EDX elemental mapping analysis further confirms the presence and uniform distribution of Pt and CeO2 species [40], supporting the redispersion of Pt into small particles (Figs. S3c-d in Supporting information). CO pulse chemisorption measurements show Pt dispersions of 1.2%, 13.9%, and 17.8% for Pt/CeO2, Pt/CeO2/SiO2, and Pt/CeO2/SiO2-H2O, respectively. This further verifies the improvement in dispersion. In addition, the actual Pt content in catalysts was tested by ICP-AES. As shown in Table S5 (Supporting information), the Pt contents in Pt/CeO2, Pt/CeO2/SiO2, and Pt/CeO2/SiO2-H2O are 0.9%, 0.8%, and 0.8%, respectively.
Figure 1
Figure 1.
(HR) TEM images, EDS elemental mapping, and Pt particle size distribution of (a–d) Pt/CeO2/SiO2 and (e–h) Pt/CeO2/SiO2-H2O. (i) O2-TPO profiles of Pt/SiO2, CeO2/SiO2, Pt/CeO2/SiO2, and Pt/CeO2/SiO2-H2O catalysts, (j) Pt 4f XPS spectra of Pt/SiO2 and Pt/CeO2/SiO2-H2O catalysts after H2 reduction and O2 oxidation, (k) plot of Pt0/(Pt0 + Pt2+) ratios for Pt/SiO2, Pt/CeO2/SiO2, and Pt/CeO2/SiO2-H2O catalysts in H2 and O2 (based on quasi in situ Pt 4f XPS spectra).
XRD analysis demonstrated that the Pt peak at 39.7° characteristic of Pt particles disappears in steam-treated Pt/CeO2/SiO2-H2O compared with Pt/CeO2/SiO2 (Fig. S4 in Supporting information), indicating enhanced Pt dispersion, consistent with the TEM results. UV–vis spectroscopy confirmed structural modifications in Pt/CeO2/SiO2-H2O catalyst after steam treatment. The enhanced absorption at 400–600 nm (Fig. S5a in Supporting information) evidences CeO2 defect formation induced by highly dispersed Pt nanoparticles with reduced particle sizes [41]. Moreover, the band gap narrowing from 3.08 eV to 3.00 eV (Fig. S5b in Supporting information) indicates increased Ce3+ species and oxygen vacancies, resulting from the partial Ce 4f orbitals filling, thereby enhancing visible-light absorption [42]. As shown in the EPR spectra (Fig. S6 in Supporting information), the peak at around g = 2.003 can be readily assigned to the oxygen vacancy [43,44]. Compared with the Pt/CeO2, CeO2, and Pt/SiO2 catalysts, the Pt/CeO2/SiO2 catalyst exhibits significantly higher peak intensities of oxygen vacancies and Ce3+. As expected, the Pt/CeO2/SiO2-H2O catalyst shows even stronger peaks of oxygen vacancies and Ce3+ after steam treatment. These results indicate that the highly dispersed CeO2 and Pt increase the oxygen vacancy concentration.
O2-TPO analysis was employed to characterize the oxidation behavior and oxygen spillover over the catalysts. The experiment involved pre-reducing the catalyst in 10% H2/Ar, followed by exposure to 3% O2/He under programmed temperature ramping. By testing CeO2/SiO2 and Pt/SiO2, the positions of the oxygen consumption peaks corresponding to the oxidation of Ce3+ to Ce4+ and that of Pt0 to Pt2+ are distinguished. As shown in Fig. 1i, the peak at 331 ℃ in the CeO2/SiO2 catalyst represents the bulk re-oxidation of CeO2 by gaseous O2, which is an intrinsic property of the ceria support. By contrast, no obvious oxygen consumption peak was observed in Pt/SiO2, as the oxidation of Pt0 in this catalyst can only occur via the direct activation of gaseous O2 on the Pt nanoparticles themselves. By comparison, besides the oxygen consumption peak appearing around 330 ℃, Pt/CeO2/SiO2 and Pt/CeO2/SiO2-H2O also showed an oxygen consumption peak around 450 ℃. This indicates that the oxidation of Pt does not occur directly via gaseous O2, but mainly relies on the active oxygen species spilled over from the CeO2 support [45,46]. Notably, the Pt/SiO2/SiO2-H2O catalyst exhibits a large oxygen consumption peak at 439 ℃, indicating a strong oxygen spillover effect. To further verify the occurrence of oxygen spillover, XPS was performed to analyze the valence state changes of Pt in Pt/SiO2 and Pt/SiO2/SiO2-H2O catalysts after reduction under 10% H2/Ar at 500 ℃ for 1 h or oxidation under 3% O2/He at 450 ℃ for 30 min (Fig. 1j). High-resolution Pt 4f XPS spectra show that Pt exists in both 0 and +2 oxidation states. For Pt/SiO2, the Pt0/(Pt0 + Pt2+) ratios in Pt/SiO2-H2 (after H2 reduction) and Pt/SiO2-H2-O2 (after O2 oxidation) are 0.83 and 0.80, respectively, with a minor difference of 0.03. By contrast, Pt/CeO2/SiO2-H2O exhibits Pt0/(Pt0 + Pt2+) ratios of 0.89 (after H2 reduction) and 0.82 (after O2 oxidation), respectively, corresponding to a large difference of 0.07. This indicates that Pt in Pt/CeO2/SiO2-H2O underwent a higher degree of oxidation, suggesting the involvement of spillover oxygen from CeO2 to Pt in addition to gaseous O2. Moreover, quasi in-situ XPS experiments were conducted to analyze the valence state changes of Pt in Pt/SiO2, Pt/SiO2/SiO2, and Pt/SiO2/SiO2-H2O after 10% H2/Ar reduction and 3% O2/He oxidation treatments at different temperatures (Fig. S7, Table S2 in Supporting information). Based on the Allometric1 plots presented in Fig. 1k, for Pt/SiO2, the Pt0/(Pt0 + Pt2+) ratio showed only a minor change of 0.02 between H2 reduction and O2 oxidation, remaining almost unchanged across different oxidation temperatures. By contrast, Pt/CeO2/SiO2-H2O, exhibited a ratio of 0.87 after reduction, decreasing to 0.85 after 350 ℃ oxidation and 0.77 after 450 ℃ oxidation, with a maximum difference achieving 0.1. For Pt/CeO2/SiO2, the Pt0/(Pt0 + Pt2+) ratio declines from 0.85 after reduction to 0.84 after oxidation at 350 ℃, and 0.80 after oxidation at 450 ℃, corresponding to a maximum change of 0.05, slightly lower than that of Pt/CeO2/SiO2-H2O. This result further indicates that Pt in Pt/CeO2/SiO2-H2O undergoes a higher degree of oxidation, consistent with the previous analysis.
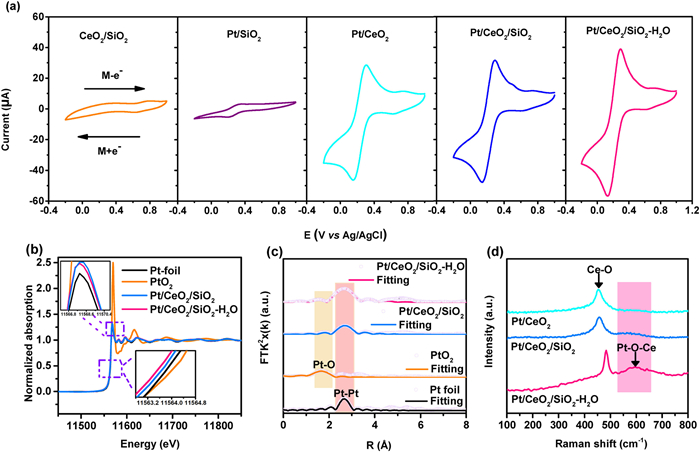
CV measurement was employed to evaluate the electron transfer capability of catalysts over various voltage ranges (Fig. 2a), with electrochemical characterization conducted in a 0.25 mmol/L K3Fe(CN)6 solution [47]. Using CeO2/SiO2 and Pt/SiO2 as control samples, the redox peak potential ranges of Pt and Ce species were determined. The CeO2/SiO2 catalyst exhibits redox pairs at 0.75 V and 0.63 V, ascribed to the redox reactions of Ce species. The Pt/SiO2 catalyst shows redox pairs at 0.32 V and 0.22 V, associated with the redox transitions of Pt species. Within the voltage range of 0–0.8 V, electrochemical measurements revealed distinct redox behaviors for Pt/CeO2, Pt/CeO2/SiO2, and Pt/CeO2/SiO2-H2O catalysts. The Pt/CeO2/SiO2-H2O catalyst exhibited the highest activity with oxidation/reduction peak currents of 39/57 µA for Pt species and 15/1.5 µA for Ce species, followed by Pt/CeO2/SiO2 (32/48 µA for Pt, 13/1 µA for Ce) and Pt/CeO2 (29/45 µA for Pt, 12/2.5 µA for Ce). This indicates that greater numbers of Pt and Ce species participate in the redox reactions and more intense electron transfer occurring, thereby enhancing redox capabilities [48].
Figure 2
Figure 2.
(a) CV curves of Pt/SiO2, CeO2/SiO2, Pt/CeO2/SiO2, and Pt/CeO2/SiO2-H2O catalysts. (b, c) Normalized XANES and EXAFS magnitude of the Fourier transformed k3-weighted χ(k) data for Pt/CeO2/SiO2 and Pt/CeO2/SiO2-H2O at the Pt-L3 edge. Pt foil and PtO2 were used as reference. (d) Raman spectra of Pt/CeO2, Pt/CeO2/SiO2, and Pt/CeO2/SiO2-H2O catalysts.
As observed in XANES spectra, the white line peak intensities of Pt/CeO2/SiO2-H2O and Pt/CeO2/SiO2 are similar and fall between those of Pt foil and PtO2. Moreover, its near-edge absorption energy is lower than that of PtO2 (Fig. 2b). This indicates that the valence state of Pt is δ+ (0 < δ < 4), a phenomenon attributable to the partially unoccupied 5d orbitals of Pt [24,39], and is consistent with the XPS analysis. The coordination environment of platinum was characterized using Fourier transform extended X-ray absorption fine structure spectroscopy. As shown in Fig. 2c and Figs. S8a and b (Supporting information), the reference PtO2 shows a prominent peak at ~1.6 Å, attributed to the Pt–O coordination. Both Pt/CeO2/SiO2 and Pt/CeO2/SiO2-H2O catalysts exhibit a peak at ~2.5 Å, corresponding to Pt–Pt coordination, similar to that of Pt foil. Compared to the Pt/CeO2/SiO2 catalyst, the Pt/CeO2/SiO2-H2O catalyst exhibits a higher Pt–Pt bonding peak, suggesting a higher concentration of metallic Pt0 in this catalyst (Table S3 in Supporting information). This observation is further supported by the wavelet transform analysis in Figs. S8c-f (Supporting information) [49,50].
Raman spectroscopy was conducted to clarify the atomic structure of catalysts. As evidenced by the Raman data in Fig. 2d, the distinctive F2g phonon mode (463 cm−1) associated with symmetric Ce–O bond stretching in cubic ceria units is present in all prepared catalysts. A weak band close to 570 cm−1 corresponding to the bridge Pt–O–Ce is indicated in the red rectangle [30]. This Pt–O–Ce band was observed exclusively in the Pt/CeO2/SiO2-H2O catalyst, which may contribute to its good catalytic performance.
H2-TPR analysis was conducted to examine the reduction behavior of the synthesized catalysts (Fig. S9 in Supporting information). CeO2/SiO2 shows reduction peaks at 280 ℃ and 700 ℃, which are attributed to the reduction of surface CeO2 and bulk CeO2, respectively [51–53]. Pt/SiO2 exhibits reduction peaks at 100 ℃ and 300 ℃, corresponding to the reduction of Pt2+ to Pt0 and the reduction related the Pt–O–Si interaction, respectively [30,54]. By contrast, Pt/CeO2 and Pt/CeO2/SiO2 do not exhibit obvious reduction peaks corresponding to the conversion of Pt2+ to Pt0. This may be attributed to the relatively large size of Pt nanoparticles, which makes their reduction more difficult. Compared with Pt/CeO2, Pt/CeO2/SiO2 exhibits a higher surface CeO2 reduction temperature. This may be because the small-sized CeO2 particles are confined in the SiO2 pores, which hinder their reduce. Notably, a reduction peak of Pt–O–Ce (115 ℃) appears in Pt/CeO2/SiO2-H2O [30], attributed to the uniform dispersion of small Pt particles after steam treatment, which facilitates the form a Pt–O–Ce interface with CeO2.
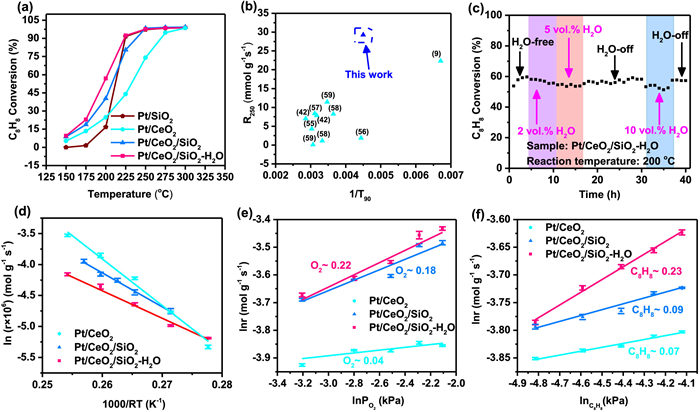
To evaluate the catalytic activity, C8H8 was used as a model compound at 200 ppm concentration with a WHSV of 120,000 mL g−1 h−1. The temperature-dependent C8H8 conversion profiles are depicted in Fig. 3a. The temperatures corresponding to 50% and 90% conversion (T50 and T90), which serve as characteristic indicators of catalytic activity, are summarized in Table 1. Among the catalysts, Pt/CeO2 exhibits the lowest activity, with T50 and T90 values of 229 ℃ and 269 ℃, respectively. By contrast, Pt/CeO2/SiO2 shows significantly enhanced performance, with T50 and T90 reduced to 205 ℃ and 234 ℃, respectively. This improvement may be attributed to the confinement effect of SiO2, which reduces the sizes of Pt and CeO2, thereby enhancing catalytic activity. Following steam treatment, the catalytic activity of Pt/CeO2/SiO2-H2O is further enhanced, with T50 and T90 dropped to 190 ℃ and 222 ℃, respectively. Additionally, the performance of Pt/SiO2 was tested and found to exhibit low activity at low temperatures, indicating that highly dispersed CeO2 is crucial for activating the styrene catalytic reaction. The CO2 yield closely follows the C8H8 conversion (Fig. S10 in Supporting information), suggesting efficient deep oxidation capability. Comparison with reported high-performance catalysts (Fig. 3b and Table S4 in Supporting information) reveals that Pt/CeO2/SiO2-H2O shows a high reaction rate of 29.28 µmol g−1 s−1 at 250 ℃ [9,42,55–59]. Given that industrial exhaust often contains steam, the influence of steam on catalytic activity was investigated. As shown in Fig. 3c, introducing 2 vol% and 5 vol% steam into the reaction stream system had negligible impact on the C8H8 conversion over Pt/CeO2/SiO2-H2O. Even with 10 vol% steam, C8H8 conversion only decreased by 5%, likely due to weakened competitive adsorption of H2O at high temperatures [60]. Notably, the catalytic activity fully recovered shortly after steam removal, indicating excellent stability and steam resistance, and the potential for industrial applications.
Figure 3
Figure 3.
(a) Evolution of the C8H8 conversion as the function of the reaction temperature. (b) Comparison with a variety of high-performance catalysts in the literature. (c) Stability of Pt/CeO2/SiO2-H2O for C8H8 destruction under different humid conditions at 200 ℃. (d) The Ea value over all catalysts, (e) reaction rate as a function of O2 partial pressure, and (f) reaction rate as the function of C8H8 partial pressure.
a The temperature required to reach a 50% conversion of C8H8. b The temperature required to reach a 90% conversion of C8H8. c C8H8 reaction rate at 200 ℃. d C8H8 specific reaction rate at 200 ℃. e Calculated at 200 ℃. The amount of Pt is based on ICP-AES and CO pulse chemisorption.
To probe the intrinsic catalytic activity, kinetic measurements were conducted while maintaining C8H8 conversion below 15%. A lower apparent activation energy (Ea) enables more reactant molecules to overcome the energy barrier and react, thereby accelerating the reaction. Based on the Arrhenius plots presented in Fig. 3d, the Ea values of Pt/CeO2, Pt/CeO2/SiO2, and Pt/CeO2/SiO2-H2O are 76 ± 4, 57 ± 3, 45 ± 2 kJ/mol, respectively (Table 1). This indicates that C8H8 oxidation proceeds more readily over Pt/CeO2/SiO2-H2O. This trend is consistent with the catalytic activity observed in the total oxidation of C8H8. Moreover, the turnover frequency (TOF) values based on Pt dispersion were calculated at 200 ℃ (Table 1). To further visualize this relationship, the TOF values were plotted against the Pt dispersion of the catalysts (Fig. S11 in Supporting information), revealing a clear linear increase in TOF with increasing Pt dispersion, and the Pt/CeO2/SiO2-H2O catalyst reached a maximum value of 1.1 s−1, indicating that enhanced Pt dispersion increased the number of Pt–O–Ce sites and facilitated the catalytic oxidation of C8H8. In summary, the superior performance of Pt/CeO2/SiO2-H2O is primarily attributed to the synergistic effects of highly dispersed Pt nanoparticles, abundant oxygen vacancies, active Pt–O–Ce interfaces, and enhanced electron transfer capability, which collectively contribute to its exceptional catalytic performance.
Previous studies indicate that the catalytic oxidation reaction of C8H8 generally follows either the Mars-van Krevelen (MvK) mechanism or the Langmuir–Hinshelwood (L–H) mechanism. In the MvK mechanism, C8H8 molecules undergo a redox cycle on the catalyst surface by abstracting lattice oxygen, leading to oxidation of C8H8 and formation of oxygen vacancies. These oxygen vacancies are subsequently replenished by gas O2 or the migration of lattice oxygen from the bulk, thereby restoring the catalyst to its initial state [24,61,62]. Under this mechanism, the reaction rate is insensitive to O2 partial pressure. In order to analyze the reaction mechanism of C8H8, the reaction rates were measured at 170 ℃ under varying partial pressures of O2 and C8H8 (Figs. 3e and f). For all catalysts, the reaction order of O2 is below 1, supporting the MvK mechanism and indicating that lattice oxygen plays a major role in the reaction [63]. The reaction orders of C8H8 over Pt/CeO2 and Pt/CeO2/SiO2-H2O catalysts are 0.07 and 0.23 respectively, slightly higher than those of O2 (0.04 and 0.22), indicating that these catalysts have a stronger adsorption capacity for C8H8 [64]. Therefore, the lattice oxygen in the catalysts can directly react with the adsorbed C8H8via the MvK mechanism [65]. By contrast, the Pt/CeO2/SiO2 catalyst exhibits a higher reaction order for O2 (0.18) than for C8H8 (0.09), suggesting that enhanced O2 activation may facilitate the oxidation of C8H8. Furthermore, Pt/CeO2/SiO2-H2O shows the highest reaction order for O2 likely due to its elevated oxygen vacancy concentration.
Figs. S12a and b (Supporting information) display the pore size distribution and N2 adsorption-desorption isotherms of the catalysts, respectively. In accordance with the IUPAC classification, these isotherms bear a resemblance to the standard type I adsorption-desorption isotherms, featuring an H1-type hysteresis loop. This characteristic indicates that mesopores are present in the catalysts. Table S5 presents the specific surface area, total pore volume, and average pore diameter of catalysts. Compared with Pt/CeO2, the addition of SiO2 carrier significantly increases the specific surface area while reducing the pore diameter.
XPS was implemented to investigate the electronic structure and surface elemental composition of catalysts. High-resolution Pt 4f spectra show that Pt exists predominantly in a mixture of the Pt0 and Pt2+ species in all catalysts (Fig. S13 in Supporting information). Quantitative analysis (Table S6 in Supporting information) reveals that the Pt0/(Pt0+Pt2+) ratio increases following the sequence of Pt/CeO2 (0.78) < Pt/CeO2/SiO2 (0.82) < Pt/CeO2/SiO2-H2O (0.85). This increase in Pt0 content is likely one of the primary factors contributing to the excellent catalytic performance exhibited by Pt/CeO2/SiO2-H2O. As demonstrated in Fig. S14a (Supporting information), the Ce 3d spectra can be deconvoluted into eight peaks, corresponding to four spin-orbit doublets associated with Ce3+ and Ce4+ [66]. Peaks V’, U’, U’’, and U’’’ are attributed to Ce3+, while V, V’’, V’’’, and U correspond to Ce4+ [2]. Since Ce3+ is regarded as an indicator of oxygen vacancy formation, a high Ce3+ concentration implies more abundant oxygen vacancies [67–69]. The Ce3+/(Ce3++Ce4+) ratio for Pt/CeO2/SiO2-H2O is 0.56, significantly higher than that of other catalysts (0.41–0.46), suggesting a high concentration of surface oxygen vacancies. Deconvolution of the O 1s spectra (Fig. S14b in Supporting information) yielded three components, which correspond to lattice oxygen (Olatt), adsorbed oxygen (Oads), and surface hydroxyl (OOH) at 531.1, 533.2, and 535.1 eV, respectively [70]. The ratio of Oads/(Olatt+Oads+OOH) was utilized to assess the concentration of adsorbed oxygen species (presented in Table S6). Pt/CeO2/SiO2-H2O catalyst exhibits the highest value of Oads/(Olatt+Oads+OOH) indicating the highest concentration of adsorbed oxygen. O2-TPD analysis was executed to gain a deeper understanding of the characteristics of surface oxygen species. As shown in Fig. S15 (Supporting information), the desorption peak below 300 ℃ is ascribed to oxygen species adsorbed on the surface in the vicinity of oxygen vacancies [42,71]. The peak area follows the sequence of Pt/CeO2/SiO2-H2O > Pt/CeO2/SiO2 > Pt/CeO2. The results indicate that Pt/CeO2/SiO2-H2O contains a greater number of oxygen vacancies, thereby enabling it to adsorb a larger amount of surface-adsorbed oxygen species. This observation aligns with the results from UV–vis and Raman analyses.
The C8H8-TPD curves of catalysts are presented in Fig. S16 (Supporting information). For Pt/CeO2, CO2 peaks appear concurrently with the desorption of C8H8. This indicates that lattice oxygen species at surface defects oxidize a portion of C8H8 into CO2. For Pt/CeO2/SiO2-H2O, the significantly lower C8H8 desorption temperature (117 ℃) suggests the presence of weak adsorption sites, where C8H8 molecules can desorb in a molecular form at low temperatures. More importantly, the much smaller C8H8 desorption peak area (3.2) coupled with the substantially larger CO2 peak area (34.3) (Table S7 in Supporting information) clearly demonstrates its superior oxidation capability. The C8H8-TPSR profiles of catalysts are depicted in Fig. S17 and Table S7 (Supporting information). Within the temperature range of 70–200 ℃, all catalysts exhibit similar C8H8 desorption behavior. This can be categorized as either strongly physically adsorbed or weakly chemically adsorbed C8H8. By contrast, the desorption peak area (4.1) of Pt/CeO2/SiO2-H2O is relatively smaller. Along with the desorption of C8H8, a more intense CO2 peak (Fig. S17b) emerges at approximately 300–400 ℃. Subsequently, the broad CO2 peaks between 450 and 600 ℃ arise from the oxidation of chemisorbed C8H8. The data suggests that the two prominent CO2 generation peaks are associated with the interaction between adsorbed oxygen and surface lattice oxygen species. The CO2 formation peak temperature of Pt/CeO2/SiO2-H2O is lower compared to that of the other catalysts. This finding reveals that Pt/CeO2/SiO2-H2O exhibits superior oxygen mobility, which promotes oxidation activity.
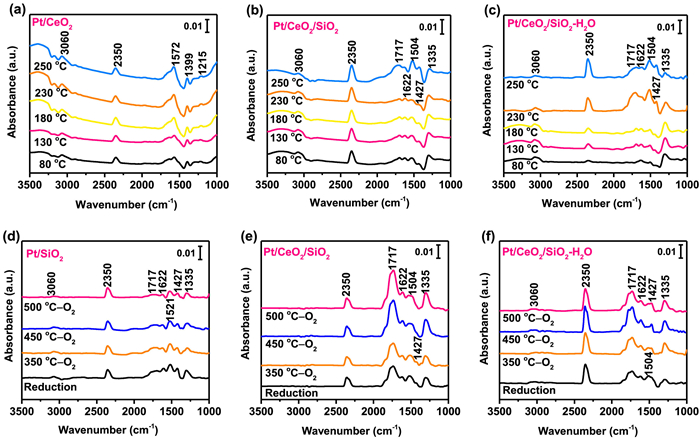
The complex C8H8 oxidation process was investigated through in situ DRIFTS. As displayed in Fig. 4, the band at 3060 cm−1 corresponds to the C–H stretching vibration of adsorbed C8H8, and the bands at 1572 and 1622 cm−1 are attributed to the typical aromatic ring vibrations, implying the adsorption of C8H8 on all catalysts. In addition, the intermediates of C8H8 degradation were also detected. The band at around 1335 cm−1 is probably ascribed to the C–O stretching vibration of benzyl alcohol, formed through the oxidative cleavage of the C8H8 double bon. The bands observed at 1717 cm−1 is due to the formation of the C=O group in benzaldehyde while the band at 1504, 1521, and 1399 cm−1 are assigned to benzoic acid. Moreover, the bands located at 1427 and 1215 cm−1 can be identified as maleic anhydride, indicating the ring-breakage of phenyl. It can be seen from Fig. 4a that with the increase in the temperature of the oxidation reaction, there is no significant change in the intermediate products of Pt/CeO2, indicating that the oxidation ability of Pt/CeO2 is relatively weak. For Pt/CeO2/SiO2 (Fig. 4b), there was no significant change in the intermediate products before 180 ℃. After the temperature was raised to 230 ℃, the C–H vibration peak of C8H8 at 3060 cm−1 became weaker, while the peak intensity of CO2 (2350 cm−1) increased. When the temperature reached 250 ℃, the C–H vibration peak of C8H8 decreased significantly. Except for the peak of benzyl alcohol becoming smaller, the vibration peaks of the other intermediate products such as benzaldehyde, benzoic acid, and maleic anhydride all became stronger. With the increase in the reaction temperature of Pt/CeO2/SiO2-H2O (Fig. 4c), the peak intensities of the C–H vibration peak of C8H8 and that of benzyl alcohol gradually decreased, while the peaks of benzaldehyde and CO2 gradually increased. The peak of benzyl alcohol reaches a maximum at 180 ℃ and decreases as the temperature rises to 230 ℃. At 250 ℃, the benzaldehyde peak decreases significantly and is lower than that of Pt/CeO2/SiO2, indicating that Pt/CeO2/SiO2-H2O has a stronger oxidation capacity. The cleavage of benzaldehyde is the key rate-determining step in C8H8 oxidation, and the existence of Pt–O–Ce active sites facilitates benzene ring cleavage in benzaldehyde.
Figure 4
Figure 4.In situ DRIFTS of styrene degradation collected over (a) Pt/CeO2, (b) Pt/CeO2/SiO2, and (c) Pt/CeO2/SiO2-H2O. In situ DRIFTS of styrene degradation over catalysts after H2 reduction and O2 oxidation: (d) Pt/SiO2, (e) Pt/CeO2/SiO2, and (f) Pt/CeO2/SiO2-H2O.
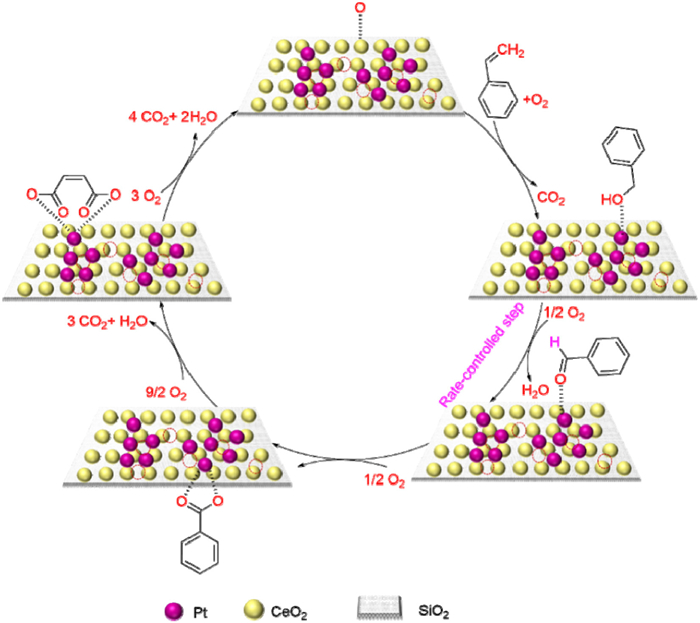
Combined with in situ DRIFTS, Raman, H2-TPR, quasi in situ XPS, and O2-TPO analyses, the reaction mechanism for the oxidation of C8H8 over Pt/CeO2/SiO2 and Pt/CeO2/SiO2-H2O can be outlined as follows: Styrene (C8H8) → benzyl alcohol (C7H8O) → benzaldehyde (C7H6O) → benzoate (C6H5COOH) → maleates (C4H4O4) → carbon dioxide and water (CO2, H2O) (Fig. 5) [9,42,47]. For Pt/CeO2, only benzoic acid and maleic acid were detected as intermediate products, reflecting its poor oxygen mobility and weak oxidation capacity.
Figure 5
Figure 5.
Proposed reaction pathway for the catalytic degradation of styrene over Pt/CeO2/SiO2-H2O catalyst.
To analyze the influence of oxygen spillover on the deep oxidation of styrene, the styrene oxidation processes of the Pt/SiO2, Pt/CeO2/SiO2, and Pt/CeO2/SiO2-H2O catalysts were investigated after reduction in 10% H2/Ar (30 mL/min) at 230 ℃ and subsequent oxidation in 3% O2/He (30 mL/min) at different temperatures. For Pt/SiO2 (Fig. 4d), the characteristic peaks of the styrene oxidation products remained basically consistent after H2 reduction and O2 oxidation at different temperatures. By contrast, for Pt/CeO2/SiO2 (Fig. 4e), the C=O vibration peak of benzaldehyde at 1717 cm−1 was significantly enhanced after oxidation at 450 ℃, indicating that the oxygen spillover of CeO2 promoted the oxidation of styrene. Notably, for Pt/CeO2/SiO2-H2O (Fig. 4f), both the C=O vibration peak of benzaldehyde at 1717 cm−1 and the CO2 peaks significantly enhanced, exceeding the intensities observed for Pt/CeO2/SiO2. This suggests that Pt/CeO2/SiO2-H2O has a stronger oxygen spillover and enhanced capacity for C8H8 deep oxidation.
Herein, the confinement effect of waste rice husk-derived porous SiO2 was used to fabricate highly uniform CeO2. Then, highly dispersed Pt nanoparticles were deposited on CeO2/SiO2via a strategy combining ethylene glycol reflux reduction and steam redispersion. Steam treatment promoted the redispersion of Pt aggregates into fine Pt nanoparticles at low temperature, while the resulting highly dispersed CeO2 and Pt nanoparticles increase the oxygen vacancy concentration. Pt–O–Ce active interfaces promote the oxygen spillover from CeO2 nanoparticles to Pt and facilitates the catalytic oxidation of C8H8 over Pt/CeO2/SiO2-H2O catalyst. The Pt–O–Ce interface induced C-H bond cleavage in benzaldehyde is the rate determining step of C8H8 oxidation. Pt/CeO2/SiO2-H2O exhibited the highest catalytic oxidation activity for C8H8 (T90 = 222 ℃, WHSV=120,000 mL h−1 g−1). Additionally, it showed favorable thermal stability and resistance to steam (10 vol%). This study proposes a strategy for fabricating supported catalysts that possess specific active interfaces and high stability.
The authors declare that they have no known competing financial interests or personal relationships that could have appeared to influence the work reported in this paper.
Acknowledgments
This work was financially supported by the National Natural Science Foundation of China (No. 22478072), National Key Research and Development Program of China (No. 2023YFC3906300), and Young Top Talents of Fujian Young Eagle Program.
Supplementary materials
Supplementary material associated with this article can be found, in the online version, at doi:10.1016/j.cclet.2026.112529.
[1]
Y. Zheng, Q. Liu, C. Shan, et al., Environ. Sci. Technol. 55 (2021) 5403–5411. doi: 10.1021/acs.est.0c08335
Figure 1
(HR) TEM images, EDS elemental mapping, and Pt particle size distribution of (a–d) Pt/CeO2/SiO2 and (e–h) Pt/CeO2/SiO2-H2O. (i) O2-TPO profiles of Pt/SiO2, CeO2/SiO2, Pt/CeO2/SiO2, and Pt/CeO2/SiO2-H2O catalysts, (j) Pt 4f XPS spectra of Pt/SiO2 and Pt/CeO2/SiO2-H2O catalysts after H2 reduction and O2 oxidation, (k) plot of Pt0/(Pt0 + Pt2+) ratios for Pt/SiO2, Pt/CeO2/SiO2, and Pt/CeO2/SiO2-H2O catalysts in H2 and O2 (based on quasi in situ Pt 4f XPS spectra).
Figure 2
(a) CV curves of Pt/SiO2, CeO2/SiO2, Pt/CeO2/SiO2, and Pt/CeO2/SiO2-H2O catalysts. (b, c) Normalized XANES and EXAFS magnitude of the Fourier transformed k3-weighted χ(k) data for Pt/CeO2/SiO2 and Pt/CeO2/SiO2-H2O at the Pt-L3 edge. Pt foil and PtO2 were used as reference. (d) Raman spectra of Pt/CeO2, Pt/CeO2/SiO2, and Pt/CeO2/SiO2-H2O catalysts.
Figure 3
(a) Evolution of the C8H8 conversion as the function of the reaction temperature. (b) Comparison with a variety of high-performance catalysts in the literature. (c) Stability of Pt/CeO2/SiO2-H2O for C8H8 destruction under different humid conditions at 200 ℃. (d) The Ea value over all catalysts, (e) reaction rate as a function of O2 partial pressure, and (f) reaction rate as the function of C8H8 partial pressure.
Figure 4In situ DRIFTS of styrene degradation collected over (a) Pt/CeO2, (b) Pt/CeO2/SiO2, and (c) Pt/CeO2/SiO2-H2O. In situ DRIFTS of styrene degradation over catalysts after H2 reduction and O2 oxidation: (d) Pt/SiO2, (e) Pt/CeO2/SiO2, and (f) Pt/CeO2/SiO2-H2O.
Table 1.
Comparison of catalytic performance, Ea, and TOF.
Catalyst
T50a (℃)
T90b (℃)
R200c (µmol g−1 s−1)
S200d (µmol m−2 s−1)
Ea (kJ/mol)
TOFe (s−1)
Pt/CeO2
229
269
7
0.15
76 ± 4
0.7
Pt/CeO2/SiO2
205
234
12
0.04
57 ± 3
1.0
Pt/CeO2/SiO2-H2O
190
222
19
0.07
45 ± 2
1.1
a The temperature required to reach a 50% conversion of C8H8. b The temperature required to reach a 90% conversion of C8H8. c C8H8 reaction rate at 200 ℃. d C8H8 specific reaction rate at 200 ℃. e Calculated at 200 ℃. The amount of Pt is based on ICP-AES and CO pulse chemisorption.


 DownLoad:


 下载:
下载:


 下载:
下载:

