
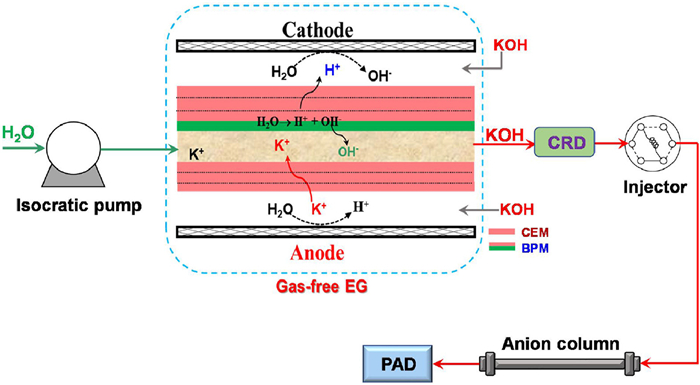
Figure 1.
Schematic diagram of IC-based platform for sugar analysis.


As essential nutrients and functional components in food, the quantitative analysis of sugars holds significant importance for ensuring food safety, optimizing product formulations, and guiding healthy diets [1,2]. Accurate determination of sugar content helps monitor food quality (e.g., preventing adulteration or excessive addition), comply with regulatory standards, and provide clear nutritional information for specific populations (such as diabetics) [3]. Additionally, sugar analysis facilitates the development of low-sugar products in the food industry, addressing consumer demand for healthier diets. Thus, it is necessary to develop rapid and accurate methods for sugar quantification in food.
Several approaches have been proposed for sugar analysis, such as gas chromatography [4], liquid chromatography [5,6], ion chromatography (IC) [7,8], mass spectrometry [9] and sensors [10]. Among them, IC equipped with pulsed amperometric detection (PAD) is probably the best way since it permits high-resolution separation and direct quantification of nonderivatized sugars at low-picomole levels with minimal sample preparation. Since introduced in the early 1980s [11], it has become a popular method for determining sugars in samples ranging from foods and beverages to the sugar portion of glycoproteins [8,12].
The dominant separation mechanism of sugars by IC is known to be anion exchange [13]. These apparently neutral sugars are, in fact, weak acids, and thus at high pH they ionize to become anions and can be separated on strong anion-exchange column. The use of strong alkaline hydroxide eluent is essential in sugar analysis by IC with PAD, which plays three roles, they (a) ionize the analyte of interest to be anionic; (b) elute the retained analyte from the column; (c) facilitate electrochemical detection. However, hydroxide solution is an excellent trap for atmospheric carbon dioxide, which results in the eluent being contaminated with carbonate. Since carbonate (CO32-) is a divalent anion that is a stronger eluent than hydroxide (OH-), contaminated hydroxide eluents will cause shifts in retention time and affect the accuracy and reproducibility of analyses [14,15]. Thus, proper preparation and use of eluents are the most crucial parts for sugar analysis by IC-PAD method. Presently the overwhelming majority of IC-PAD applications is based on manual preparation of eluent, which typically consists of at least two of these three components (pure water, sodium hydroxide, and sodium acetate) driven by a quaternary gradient pump. The sodium hydroxide stock solutions contain some anionic impurities like chloride, chlorate, and carbonate, and it requires extraordinary measures to prevent continuous intrusion of atmospheric carbon dioxide. This requires meticulous care on multiple steps to ensure eluent composition constant and to minimize the carbonate intrusion throughout eluent preparation and use. By comparison, electrodialytic eluent generator (EG) is an elegant approach to produce highly pure hydroxide eluent on-demand, which is realized through precise control of the electric current applied to the electrolysis of water to generate hydroxide or hydronium ions [16]. It eliminates the need to manually prepare eluents from concentrated bases. The only routine reagent needed is deionized water. The gradient elution can be easily achieved by program current in combination with a single isocratic pump other than mechanical manner. Furthermore, since the pump seals and pistons only come in contact with deionized water instead of acids or bases which can precipitate or erode, overall pump maintenance is significantly reduced. There are some reports to use EG for sugar analysis, demonstrating good reproducibility and precision [14,15,17]. While these EGs suffer from two common drawbacks, limited concentration range (typically 100 µeq/min, corresponding to 100 mmol/L at the flow rate of 1 mL/min), which is insufficient to ionize and elute the sugar with higher pKa; possible interference of electrolytic gas due to imperfect degas efficiency, which is more pronounced in the case that high concentration is produced.
More recently, we have proposed a two-membrane configured EG, showing unique feature of gas-free in the eluent [18]. It has exhibited good performance for separation of inorganic anions. While its concentration range (≤100 µeq/min) is limited for sugars analysis. Later, the device was modified to be a continuously regenerated impurity removal device (CRD) [19] to further purify the eluent by removal of tiny impurities from the upstream water. Herein we present a gas-free EG with large concentration range for sugar analysis by modification of the device.
The schematic diagram of the whole IC system is shown in Fig. 1. The separation was performed by a Wayeal IC system (Type 6300, Hefei, China). Pure water was driven by a piston pump to pass through a KOH EG cartridge, which will be discussed below. An analytical column (Thermo Fisher CarboPacTM PA1, 4.0 mm × 250 mm) housed in a column oven was used for separation of model sugars. The detection was accomplished by a PAD equipped with a thin-layer flow cell consisting of a 1.0 mm diameter gold working electrode, an Ag/AgCl reference electrode, and titanium cell body as the counter electrode. The default quadruple-potential waveform was chosen for model detection (Fig. S1 and Table S1 in Supporting information).
The fabrication procedure of the EG is similar to previous description with some modifications [18]. Briefly, it is sandwiched by central eluent channel (packed with strongly basic anion exchange resins in hydroxide form) and two regenerant chambers on both sides, as illustrated in Fig. 1. The central channel is respectively separated by a stacked cation exchange membrane (sCEM, FKB obtained from Fumatech Corp., Germany) and a piece of bipolar membrane (obtained from Tingrun Corp., Bingjing, China) plus sCEM (BPM-sCEM). Fine strong cation exchanger resins (~20 µm diameter, provided by Huachang Corp., Shanghai, China) are filled between various membranes, aiming to improve ion transportation and reduce the resistance of the device. The BPM is placed at the right direction as the AEM side is facing the eluent channel and the cation exchange membrane (CEM) side is contact with sCEM. Two porous platinum electrodes placed in two regenerant chambers are in contact with sCEM via a sulfonated screen, respectively. Three housings made of PEEK are assembled together by metal screws. 2 mol/L KOH is used for feeding both regenerant chambers.
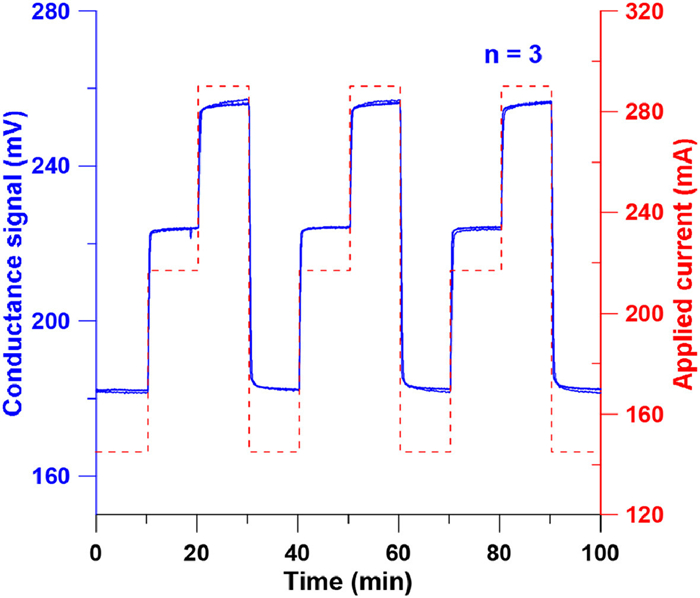
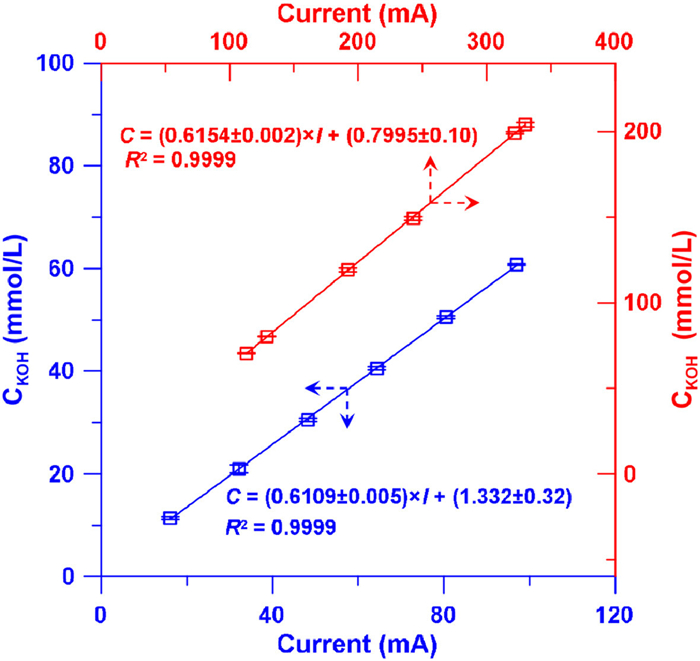
Being an electrodialytic device, the resistance of an EG determines the eluent concentration range for a common constant current power supply. The resistance of the EG was calculated to be ~38 Ω according to its current-voltage fitting curve (the eluent flow rate was 1 mL/min and KOH regenerant concentration was 2 mol/L), which was ~38% lower than that of previous report [18]. This should be caused by the addition of ion exchangers packed in the eluent channel and between CEMs. An EG functions to generate eluent with the concentration correlated with the applied current. Here the dependence of the concentration of KOH eluent generated by the EG on the current was explored. As shown in Fig. 2, three consecutive rise/fall profiles of the produced eluent by EG applied by a step current were obtained by measuring the eluent conductance via a conductance detector (CD). Three different current values (145, 217 and 290 mA) were selected, each of which is maintained for 10 min and then switched to another. Clearly, the produced KOH showed high correlation with the current. Such has been further confirmed by the fitted plot of the produced KOH concentration by EG and the applied current, as illustrated in Fig. 3. Good linear relationship (correlation coefficient, R2 = 0.9999) of the current and generated KOH concentration in the range of 10–210 mmol/L was observed at the typical flow rate of 1 mL/min. The slope (k) of the fitted plots was 0.611 ± 0.003 mmol L-1 mA-1 (10–60 mmol/L) or 0.614 ± 0.002 mmol L-1 mA-1 (70–210 mmol/L), which were close to the theoretical value of 0.621 mmol L-1 mA-1, showing near-ideal Faradaic efficiency. Thus, KOH eluent with a given concentration can be easily online produced simply by applying the corresponding current. And KOH eluent generated with concentration of 200 mmol/L was measured to be 199 ± 1.65 mmol/L via standard acid-base titration method, indicating good accuracy. Such concentration range can meet the majority of applications of sugar analysis.
The EG also demonstrated good running stability, as indicated by the concentration fluctuation of 0.641 mmol/L during continuous running process of 260 min (Fig. S2 in Supporting information). Further confirmation was made by measuring the potassium content of KOH eluent electrodialytically generated by collecting KOH effluent at the interval of 10 min for injecting into the IC system. As provided in Fig. S3 (Supporting information), the measured potassium amount demonstrated good reproducibility, as indicated by RSD 1.32% and 1.76% (n = 30) of the peak height and peak area of the potassium, respectively.
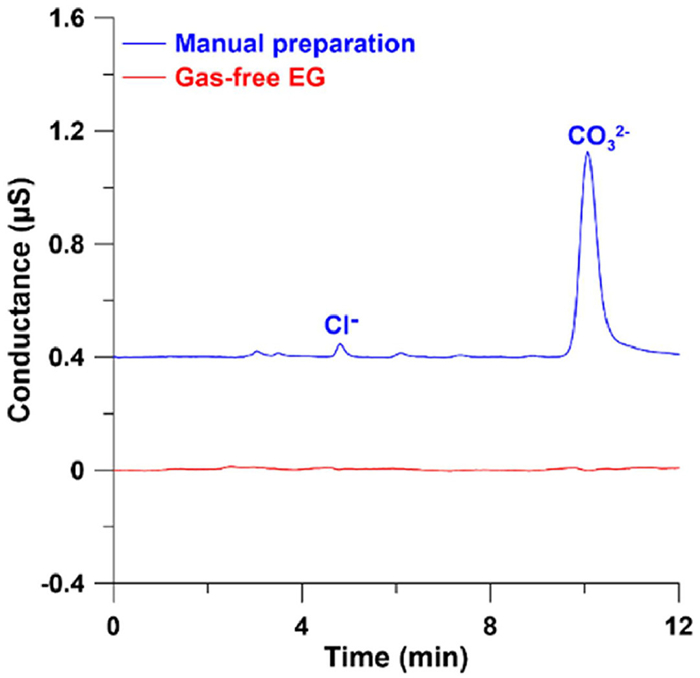
As mentioned above, the purity of KOH eluent is essential to ensure good reproducibility and precision of sugar analysis. Relative to manual preparation, a distinct feature of KOH eluent produced by EG is highly pure. Such has been demonstrated by determining tiny impurities in 10 mmol/L KOH eluent by fresh manually prepared or EG. As shown in Fig. 4, some impurities were observed in freshly manually prepared KOH eluent, mainly carbonate and small fraction of chloride (~1 µmol/L) and other unknown anions. By contrast, negligible anion impurity was found in the KOH by EG, exhibiting extremely high purity.
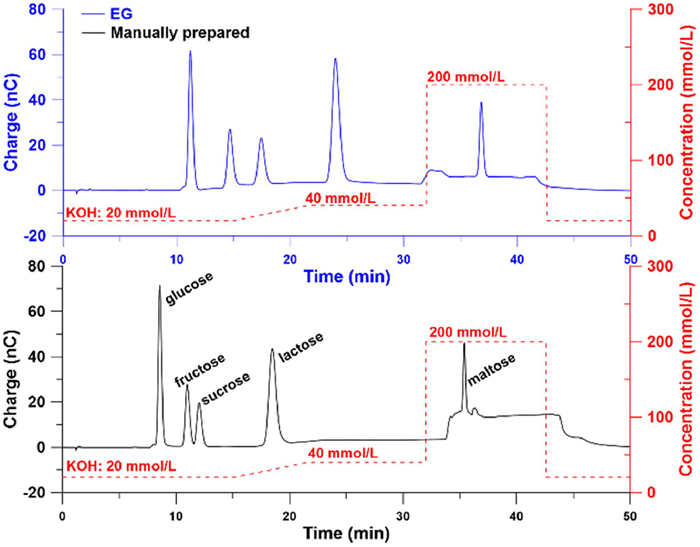
Five sugars were chosen to be model and their elution program was established by referring to recommended by GB5009.8–2023, as listed in Tables S2 and S3 (EG) in Supporting information. Under the gradient elution mode, five model sugars achieved baseline separation in <40 min, as shown in Fig. 5. Good peak shape was observed for all analytes. By comparison, common manner by manually prepared KOH eluent driven by quaternary gradient pump was used to perform the separation of model sugars. Although effective separation was obtained in two cases, EG behaved much better in terms of high resolution of fructose/sucrose and lower drift during gradient elution process. Limited resolution will make coelution or overlap possible when the concentration of fructose or sucrose is high in the case of real samples. Obvious drift was observed in the concentration gradient of 40 mmol/L to 200 mmol/L, for example, the drift was 10.4 nC by common manner and 6.3 nC by EG, and the corresponding noise level was 8.8 nC and 4.0 nC, as clearly illustrated in Fig. S4 (Supporting information). In addition, faster elution of the first four sugars was observed in the manually prepared gradient mode compared to EG, while the total separation times of five models in two cases were almost same. This should be caused by carbonate contamination in the manually prepared eluent, which has stronger elution strength than that of OH-, as mentioned above. At large KOH concentration, the fraction of carbonate was low and its influence on the separation was lower, then leading to similar retention time of the total sugars. This further confirmed high purity of KOH eluent by EG.
The advantage of the present gas-free EG over common EG was demonstrated in isocratic and gradient mode. As shown in Figs. S5 and S6 (Supporting information), the present EG was superior to the common one, as indicated by lower drift in gradient elution (20 mmol/L to 100 mmol/L. Note: the maximal operation concentration of commercial EG is 100 mmol/L) and lower baseline noise in isocratic mode (100 mmol/L), e.g. the drift and the noise in commercial EG was 15.4 nC (or 53.7 nS/cm under the mode of conductance detection), relative to 6.4 nC (or 6.5 nS/cm) obtained in the present EG. Much lower noise level should result from gas-free feature of the present EG, while large fluctuation observed in commercial EG was caused by insufficient gas-removal under such high concentration.
The EG-IC-based method showed good operation reproducibility, as indicated RSD by ≤ 0.13% (or ≤ 1.68%) of the retention time (or the peak height) of models (Figs. S7 and S8 in Supporting information). Good linear correlation was obtained for all model sugars by the established method, and the quantitative parameters were listed in Table S4 (Supporting information). It well meets the determination requirements of model sugars. The utility of the method has been demonstrated to determine possible sugars in three types of biscuits. The obtained chromatograms were shown in Fig. S9 (Supporting information), and the quantitative results were summarized in Table S5 (Supporting information). The recoveries of three spiked levels were in the range of 95.8%−105.1%, indicating good precision of the method.
In conclusion, a gas-free EG-IC-based platform was proposed for sugar analysis. The EG can online generate high purity and large concentration KOH eluent used for separation of sugars. This platform presents a simple and fast way to sugar profiling with improved precision and accuracy, well overcomes the various drawbacks associated with common manner. We believe such platform will find more applications for sugar analysis in the future.
Weiqing Chen: Writing – original draft, Methodology, Data curation. Richen Hong: Resources, Investigation. Feifang Zhang: Project administration. Bingcheng Yang: Writing – review & editing, Supervision, Conceptualization.
The authors declare that they have no known competing financial interests or personal relationships that could have appeared to influence the work reported in this paper.
This work was sponsored by National Natural Science Foundation of China (No. 22374046).
Supplementary material associated with this article can be found, in the online version, at doi:
G. Couture, S.E. Cheang, C. Suarez, et al., Nat. Protoc. 19 (2024) 3321–3359. doi: 10.1038/s41596-024-01017-8
L.F. Li, X. Shi, S.M. Qi, et al., Carbohydr. Polym. 344 (2024) 122533. doi: 10.1016/j.carbpol.2024.122533
V. Campos, L. Tappy, L. Bally, J.L. Sievenpiper, K.A. Le, Nutr. J. 152 (2022) 1200–1206. doi: 10.1093/jn/nxac039
A.D. Garcia, V. Leyva, J. Bockova, R.L. Pepino, C. Meinert, Talanta 271 (2024) 125728. doi: 10.1016/j.talanta.2024.125728
Y. Yuan, J.A. Huang, Y.H. Li, et al., J. Tea Sci. 30 (2010) 435–439.
Q. Fu, T. Liang, X. Zhang, et al., Carbohydr. Res. 345 (2010) 2690–2697. doi: 10.1016/j.carres.2010.09.033
F. Dong, M.L. Chen, Y. Zhu, Phys. Test. Chem. Anal. Part B 46 (2010) 76–78.
Z. Zhang, N.M. Khan, K.M. Nunez, E.K. Chess, C.M. Szabo, Anal. Chem. 84 (2012) 4104–4110. doi: 10.1021/ac300176z
W.M. Hu, T.Y. Li, Y.L. Yang, S.S. Jia, M. Zhang, Chin. Chem. Lett. 33 (2022) 4808–4816. doi: 10.1016/j.cclet.2022.01.026
J.J. Li, T.J. Ni, H.Q. Liu, et al., Chin. Chem. Lett. 31 (2020) 1099–1103. doi: 10.1016/j.cclet.2019.11.005
R.D. Rocklin, C. Pohl, L. Liq. Chromatogr. 6 (1983) 1577–1590. doi: 10.1080/01483918308064876
M. Mechelke, J. Herlet, J.P. Benz, et al., Anal. Bioanal. Chem. 409 (2017) 7169–7181. doi: 10.1007/s00216-017-0678-y
T.J. Paskach, H.P. Lieker, P.J. Reilly, K. Thielecke, Carbohydr. Res. 215 (1991) 1–14.
D.A. Martens, K.L. Loeffelmann, J. Chromatogr. A 1039 (2004) 33–37. doi: 10.1016/j.chroma.2003.12.064
J. Rohrer, Dionex Technical Note TN 70669: Eluent Preparation For High-Performance Anion-Exchange Chromatogarphy With Pulsed Amperometric Detection, Thermo Fisher Scientific, Sunnyvale, CA, 2017, pp. 1–5.
Y. Liu, K. Srinivasan, C. Pohl, N. Avdalovic, J. Biochem. Biophy. Methods 60 (2004) 205–232. doi: 10.1016/j.jbbm.2004.01.004
Y.J. Chen, V. Barreto, A. Woodruff, et al., Anal. Chem. 90 (2018) 10910–10916. doi: 10.1021/acs.analchem.8b02436
Y.F. Lu, L.T. Zhou, B.C. Yang, S.J. Huang, F.F. Zhang, Anal. Chem. 90 (2018) 12840–12845. doi: 10.1021/acs.analchem.8b03365
Y. Sun, C. Liao, F. Zhang, Z. Xu, B. Yang, Anal. Chem. 94 (2022) 6924–6929. doi: 10.1021/acs.analchem.2c00604

Figure 2 Conductance change of EG effluent with the current. Note: the measurement was performed by using a wide range CD to online monitor the produced KOH eluent, the KOH concentration was computed by a pre-calibrated equation of KOH concentration and its conductance.

Figure 3 Correlation of the current and the produced KOH concentration by EG. Flow rate, 1 mL/min. Note: Blue line and red line are corresponding to different X/Y axis, as indicated the arrow in the figure.

Figure 4 Purity test 10 mmol/L KOH eluents prepared by manually and EG. Conditions: anion column, AEC–OH; eluent, 13 mmol/L KOH; flow rate, 1 mL/min; column temperature, 30 ℃; sample, 10 mmol/L KOH solution manually prepared or EG generated; injection volume, 25 µL; suppression current, 33 mA.

 扫一扫看文章


扫一扫关注我们
 DownLoad:

 下载:
下载:

 下载:
下载: