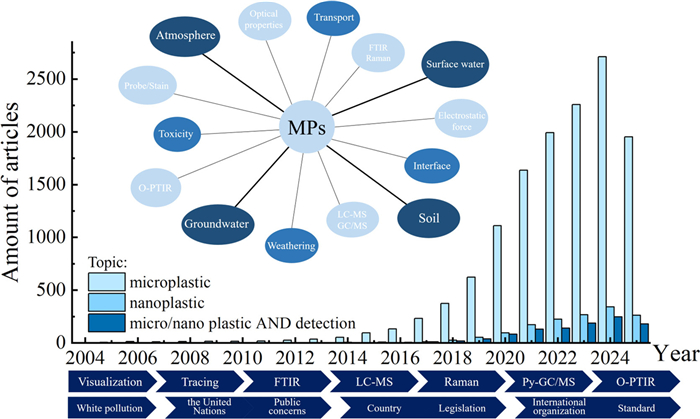
Figure 1.
Micro/nano plastics research hotspots and the development of detection analysis. Data from Web of Science core collection (Updated in September 2025).

A review of analytical techniques and mechanisms for rapid detection of micro/nano plastics: Implications and new insights into current micro/nano plastics pollution
Chao Liu , Yuan Jiao , Chunfan Yang , Xiaona Liu , Bo Li , Xuewen Miao , Wenjun Li , Lihong Hao , Tianwei Qian , Wen Liu


In recent years, the ecological hazards caused by "white pollution" have been gradually recognized. Microplastics are described as plastic particles with a particle size of <5 mm [1], and as the particle size decreases, they are further defined as submicron/nano plastics. As particle size decreases, nanoplastics exhibit certain colloidal properties, resulting in significantly different environmental behavior compared to microplastics. Relevant studies indicate that nanoplastics demonstrate significantly greater size-dependent toxicity than microplastics [2]. Micro/nano plastics have a wide range of sources, such as direct industrial products or the aging release. Currently, micro/nano plastics are widely present in surface water, oceans, groundwater, soil, and even in animals and plants.
The research on microplastics has developed rapidly, with a large number of papers published since 2004, mainly focusing on environmental samples, behavioral effects, and detection techniques (Fig. 1). However, the research on nanoplastics is relatively little, mainly due to limitations in separation and detection. The number of studies related to the detection method has remained at a relatively low level.
The environmental problems caused by microplastics are gradually receiving attention from countries and organizations around the world. A relevant policy was promulgated in China to include microplastics in the Action Plan for the Management of New Pollutants (2022). The American Environmental Protection Agency has also issued the National Strategy to Prevent Plastic Pollution (2024). The Plastic Waste Management (Amendment) Rules have been promulgated in India (2024). The United Nations has issued Guidance on the Management of Plastic Waste and Recycled Plastics (2023). The International Organization for Standardization has also published the Principles for the Analysis of Microplastics Present in the Environment (ISO 24187: 2023). The control of plastic and microplastic pollution problems gradually tends to be systematized, standardized, and regulated.
Micro/nano plastics in environmental media can easily enter plant and animal tissues through air, water, food, etc., and accumulate in the food chain [3]. It is widely recognized that micro/nano plastics have a significant toxic effect on animals or plants. The effects are mainly on growth, reproductive processes, and normal life metabolic processes [4]. Related studies have shown that anionic nanoplastics are able to enter neurons via endocytosis and cause prominent protein degradation that can have an impact on brain function [5].
Micro/nano plastics are highly susceptible to transport in water and soil media. And the rate of settling/deposition is slower as the particle size decreases. In addition, micro/nano plastics in the environment will undergo weathering/aging effects due to various environmental factors. Weathering microplastics exhibit increased specific surface area, increased oxygen-containing functional groups, increased adsorption sites, etc. This may lead to increased interactions with a variety of substances in the environment, resulting in more complex ecological risks. The aging of microplastics in the environment causes increased hydrophilicity and negative charge. Relevant studies have shown that the properties of the charge on the surface of micro/nano plastics affect the internalization process of cells [6], bringing diverse toxic effects. In addition, micro/nano plastics in the environment can easily adsorb lipids, water-soluble soil metabolites, and microorganisms to form ecological corona [7], which consequently has an impact on material cycling and ecological community distribution in the soil.
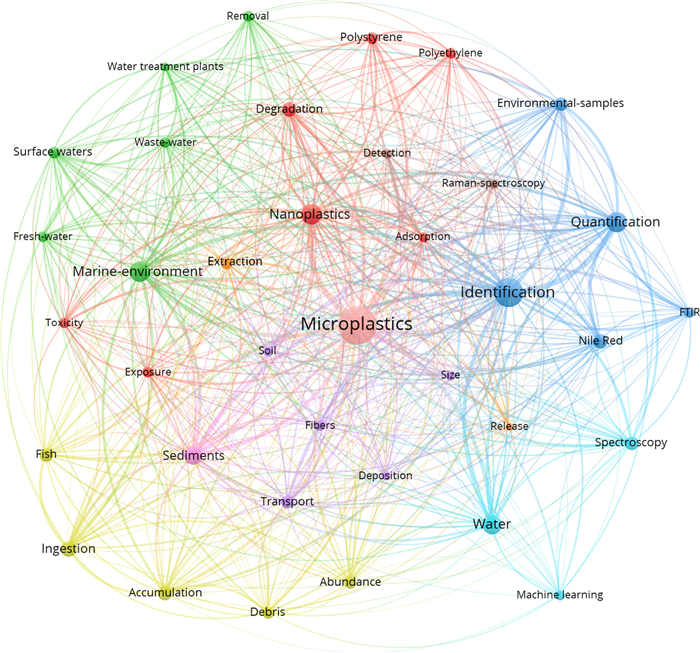
The keywords clustering [8] of the papers was analyzed based on the Web of Science core collection, and the results are shown in Fig. 2 and Fig. S1 (Supporting information). Research on microplastics mainly focuses on migration, enrichment, adsorption, and health risks in different environmental media. The main detection methods include infrared, Raman, mass spectrometry, fluorescence. The relevant research on nanoplastics focuses on the toxic effects caused by nanoscale properties, biological enrichment, protein corona, etc. The detection methods mainly include Raman spectroscopy, Raman imaging. Currently, the available solutions for detecting microplastics in environmental media, especially submicron or nano plastics, are still very restricted.
The detection technology of environmental micro/nano plastics for rapid analysis is challenging. The realization of an accurate, efficient, and economical tool for analyzing environmental micro/nano plastics is important for understanding the current state of micro/nano plastic pollution. At present, based on fluorescent material labeling, the tracing and detection of micro/nano plastics has been achieved, which is extremely effective in bridging the gap in the current research on micro/nano plastics. Fluorescence analysis has many advantages over conventional analytical methods, such as economy, simplicity, and relative accuracy. In addition, analyzing micro/nano plastics directly by physicochemical properties such as optical or interfacial properties has also proved to be an effective method. However, this property may be altered by direct or indirect factors. The development of rapid environmental detection technologies is critical for the assessment and detection of micro/nano plastics.
This review analyzes the mechanism and limitations of standardized detection and rapid detection methods, and mainly discusses the following issues: (ⅰ) The application and limitations of traditional and standardized detection; (ⅱ) the development of microplastic fluorescent labeling and visualization techniques; (ⅲ) the mechanisms, accuracies, and applicability conditions of current rapid detection methods; (ⅳ) new challenges posed by coupling of the environmental media and the interfacial properties of microplastics; (ⅴ) the application and contribution of artificial intelligence, modeling, quantum chemistry, and other solutions in micro/nano plastics. This review will enhance our understanding of the relationship between standardized detection and rapid detection techniques, and will support the development of micro/nano plastic physicochemical properties, interfacial properties, carrying contamination, and other related research.
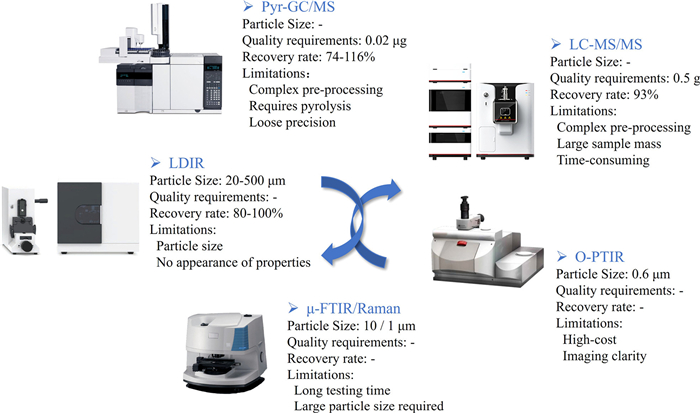
With the development of micro/nano plastics research, a large number of methods of analysis and detection have emerged. Currently, the more mature detection techniques are mainly categorized into spectroscopic analysis and gas/liquid-mass spectrometry analysis (Fig. 3) [9–13]. The spectral analysis method has better detection results for microplastics with larger particle sizes, but the accuracy of the detection decreases and the difficulty increases as the particle size decreases [14]. While mass spectrometry is mainly limited by sample quality and plastic type. The commonly used techniques and procedures in environmental sample detection research are shown in Table 1 [10, 15–37]. The primary method involves detecting environmental samples via mass spectrometry or spectroscopic techniques after digestion and density separation. The types, particle sizes, and quantities detected vary significantly, making comparisons difficult, especially with insufficient information on plastic particles under the detection limitation. As research advances, submicron/nanoscale plastics have become key topics due to their more pronounced environmental impacts. Consequently, qualitative and quantitative detection of micro/nano plastics still presents certain limitations.

 DownLoad:
CSV
DownLoad:
CSV
| Detection tools | Environmental media | Pretreatment | Types of microplastics | Particle size | Quantity/mass concentration | Detection limitation | Type of research | Ref. |
| O-PTIR | Baby teats | Steam treatment, flushing | Polydimethylsiloxane, polyamide resin additives | 0.6–332 µm | 0.99 × 10⁵ to 5.0 × 10⁵ particles per teat | 0.6 µm | Investigation | [10] |
| TGA-FTIR-GC/MS | Crayfish | Homogenate, 10% HNO3, ethanol washing, KOH digestion | PE, PP, PVC, PS | – | 0.16–1.71 mg/kg | – | Field investigation | [15] |
| Py-GC/MS | Beaches | Density separation, Fenton, low-temperature solvent extraction of 2-chlorophenol | PET, PS | 1.2–100 µm mainly | 0.019 ± 0.03–6.0 ± 3.6 mg/kg | LOQ <0.1 µg | Field investigation | [16] |
| Stereoscopic microscope + SEM | River sediment | ZnCl2 density separation, H2O2 | Films, fragments, fibers, particles | – | 833–1633 items/kg | – | Field investigation | [17] |
| Stereoscopic microscope + FTIR | Fish intestine | Formalin, alcohol | PA, PU, PET, PS, PP | 0.1–135 mm | 0.06–1.65 items/individual | 0.001 mm | – | [18] |
| Laser confocal Raman spectrometer | Riparian sediments | Dry, clean | PE, PP, PET, PVC | – | – | – | Weathering | [19] |
| SEM + deep learning | – | Crushing, splitting | PE, PET, PS, PU, PC, PP, PAN, PA, PVC | 50 µm–1 mm | – | – | Methodological study | [20] |
| Nile Red + µ-FTIR | Sediments | Fenton, ZnCl2 density separation | PE, PP, PS, PA, PVC, PET | 0.5–0.0625 mm | – | 62.5 µm | Methodological study | [21] |
| Nile Red + µ-FTIR | Clams | 10% KOH digestion, ZnCl2 density separation, lipase treatment | PE, PET, PP, PS | 20–2000 µm; > 2000 µm | 2.70–41.63 items/g | 20 µm | Field investigation | [22] |
| µ-Raman | Bottled water | Flushing, gold-plated polycarbonate filtration | PEST, PE, PS, PP | 5–100 µm, > 100 µm | 27–115 items/L | 5 µm | Investigation | [23] |
| µ-FTIR + µ-Raman | Oysters | H2O2, density separation | PS, PE, PP | 50–150 µm | 0.69–3 items/per oyster | 5 µm | Field investigation | [24] |
| µ-FTIR + µ-Raman | Surface water | Filtration, visual picking | PE, PP, PS, PMMA, CA, PVA, polyacrylonitrile, rubber | 10–500 µm; > 500 µm | 38–2621 items/m3 | 1 µm | Field investigation | [25] |
| LDIR | Septic tank | Fenton, HNO3 digestion, anhydrous ethanol, NaI density separation, H2O2 | PE, PP, PET, PVC, PA, PU, etc., total 34 types | 20–100 µm | 1489–4816 items/g | 20 µm | Field investigation | [26] |
| LDIR | Human placenta | Filtration, potassium formate, anhydrous ethanol | PVC, PP, PBS, etc., total 11 types | 20.34–307.29 µm | 2.70±2.65 items/g | 20 µm | Investigation | [27] |
| µ-FTIR | Seawater Freshwater wastewater | H2O2, KOH, Fenton | PE, PP, PS, PET | <50 µm <150 µm | – | – | Field investigation | [28] |
| µ-FTIR + Py-GC–MS | Fresh water in the city | H2O2 | PE, PP, PS, PVC, PET, PMMA, etc., total 12 types | 10–300 µm | 16–107 MP/m3; Py-GC/MS 8.5–754 µg/m3 µ-FTIR 2.0–789 µg/m3 | 10 µm | Field investigation | [29] |
| Py-GC/MS | Human artery | HNO3 | PET, PA, PVC, PE | – | 52.62–225.23 µg/g | mass-to-charge ratio: 29–600 | Investigation | [30] |
| LC-MS | Atmosphere | H2O2, depolymerization of methanol and potassium hydroxide, acetonitrile | PEG, HTPE, PET, PPG, PA | – | 589.85–3531.59 ng/m3 | 14.20 ng/m3 | Field investigation | [31] |
| LC-MS + GC–MS/ LDIR + µ-FTIR | Landfill | ZnCl2 density separation, H2O2, pentanol + KOH depolymerization, methanol extraction | PET, PC, PE, PP, PU, PS, PVC, RU, etc. | > 1mm, 0.25–1 mm, <0.25 mm | 25–113 items/g | – | Field investigation | [32] |
| SERS + nanoparticle tracking analysis | Bottled water | Filtration, HCl, KOH, CH2Cl2 flushing | PET | ~150 nm | (1.66 × 10⁸)±(2.33 × 10⁷) items/mL | 50 nm, 1.5 × 10¹¹ items/mL | Methodology | [33] |
| Hyperspectral imaging technology | Soil | NaCl density separation, visual flotation | PE (white/black) and six other different colors of household plastic | 0.5–1 mm, 1–5 mm | – | 58%–100% | Field investigation | [34] |
| Nile Red + artificial intelligence | Bottled water | Nile Red-acetone-ethanol solution, surfactant dispersion | PE, PS, LDPE, PA6, PET, PVDC, PMMA | 5–300 µm | – | 28 items/500 mL | Investigation | [35] |
| µ-FTIR | Wetlands | H2O2, NaCl, ZnCl2 | PP, PE, PA, PVC | 0.01–1.74 mm | Water 325–1615 items/m3 Sediment 323–681 items/kg | 10 µm | Field investigation | [36] |
| µ-FTIR | Groundwater | Filtration, drying | RY, PET, PVC, PES | 0–5 mm | 0–61 items/m3 | – | Field investigation | [37] |
| Note: Surface-enhanced Raman spectroscopy, SERS; scanning electron microscope, SEM; Fourier transform infrared microscopy, µ-FTIR; Laser direct infrared, LDIR; Raman microscopy, µ-Raman; Optical-photothermal infrared, O-PTIR; Thermogravimetric analysis, TGA; Gas chromatography/mass spectrometry, GC/MS; Liquid chromatography-mass spectrometry, LC-MS; Polyethylene, PE; Polypropylene, PP; Polyvinyl chloride, PVC; Polystyrene, PS; Polyamide/Nylon, PA; Polyethylene glycol terephthalate, PET; Polyethersulfone, PES; Rubber, RU; Polyvinylidene chloride, PVDC; Poly(methyl methacrylate, PMMA; Polylactic acid, PLA; Cellulose acetate fibre, CA; Limit of detection, LQD. | ||||||||
Direct analysis by optical microscopy is commonly used for early microplastic studies. Identify types of plastics by observing microplastic shapes, colors, transparency, hardness, and density. Usually, transparent types of plastics are PMMA, PS, PC, etc., while non-transparent plastics are PE, PP, and PVC. Thermosoftening plastics often have a softer texture due to their non-heat-resistant features. This method is frequently used as a primary screen for microplastics in environmental samples, and there are many properties that cannot be accurately determined. And optical microscopy is usually limited by the light diffraction limit. It is relatively difficult to observe plastic with a small particle size.
Combined with electron microscopy, it is possible to accurately observe plastic particles with smaller sizes. In contrast, transmission electron microscopy is commonly used to observe particles around 100 nm, as well as their internal ordered structure and element distribution. Information on the composition, chemical bonding, and functional groups of substances cannot be obtained, and therefore also has great limitations and needs to be combined with other detection means.
Microanalysis and spectroscopic analysis have greatly improved the precision and accuracy of single-particle detection, and combined with graphical analysis techniques to achieve quantification, which has become the prevailing method for microplastic analysis.
Infrared spectroscopy exhibits different peaks based on the absorption of infrared light by chemical bonds. According to the position of the peak, it can be divided into the fingerprint and characteristic region. The wave number in the characteristic region is relatively large, and the peak signal is obvious, which can reflect the characteristic peaks of plastics, such as C-H. According to the characteristic peaks, common plastics such as PE, PP, PVC, PS, can be distinguished. And some thermoplastic has weaker peaks in the characteristic region, such as PET. The wavenumber in the fingerprint region is relatively small, and the signal is relatively complex, usually only able to judge common peaks. Two-dimensional correlation spectroscopy is often used to analyze signals in the fingerprint region and to determine infrared spectral changes caused by microplastic aging based on automatic peaks and cross peaks. In addition, there are strong or weak differences in infrared spectra due to the different properties of chemical bonds. Infrared spectroscopy is crucial for the identification and detection of microplastics, and has evolved many related methods: Laser infrared, micro infrared, thermogravimetric infrared, etc. Although infrared spectroscopy is a mature and widely applied technique, its detection accuracy is usually limited by the particle size of the sample (10 µm) [38].
The smaller detection limit (1 µm) of Raman spectroscopy is attributed to the advantages of the light source [39]. Raman spectroscopy is mainly based on the effect of stimulated Raman scattering. Different functional groups on the Raman scattering caused by different shifts to achieve the analysis of chemical bonds. The light source of Raman spectroscopy technology has advantages (Monochromatic laser light source); therefore, its resolution is higher than that of infrared spectroscopy. For the plastic particles with a small size, Raman spectroscopy is the best choice. However, this inelastic scattering is easily interfered by fluorescent substance, leading to distorted results. A large number of studies exist on the continuous optimization of Raman spectroscopy in association with Raman enhancement techniques. Mainly through the aurum, silver, aluminum oxide, etc. to resist background interference, and enhance the sample signal, such as surface-enhanced Raman spectroscopy [40, 41], stimulated Raman spectroscopy, Raman in situ detection system [42], coherent anti-Stokes Raman scattering microscopy [43]. In addition, the analysis of spectra needs to be determined based on experience, and it is difficult to accurately identify the interference of components such as plastic additives, copolymers, and adsorbents. Analyzing spectra using techniques such as machine learning and convolutional neural networks [44] can greatly increase the accuracy of the results.
The optical diffraction limit is still a major limitation. Therefore, the optical-photothermal infrared (O-PTIR) technology was developed [45]. The O-PTIR is based on the material photothermal response (Refractive index gradient after absorbing radiation), and at the same time combined with infrared spectroscopy and Raman spectroscopy analysis. It exhibits high resolution and precision, with an accuracy of up to 600 nm. However, increased magnification drastically reduces the depth of field and range of vision, requiring samples to be in a single-particle state for detection. This limits both sample types and detection speed.
Compared to spectroscopic methods, the operation of gas-phase and liquid-phase detection methods for micro/nano plastics is more complex and time-consuming. Nevertheless, micro/nano plastic analysis methods incorporating mass spectrometry facilitate quantitative comparisons of samples during monitoring and are widely recognized.
The gas-phase method uses a thermal cracking device in combination with mass spectrometry to analyze the products of plastic cracking and to deduce the composition of microplastics. The liquid-phase method is similar and accomplished through pyrolysis and liquid-phase extraction. The key to this method is the use of mass spectrometry to analyze the post-depolymerization products. Therefore, different types of plastics have different marking substances. Common substances in Py-GC/MS, such as PET-benzoic acid/vinyl benzoate, PS-styrene trimer, PA-66-N1-(hex–5-enyl)-N6-hexyladipamide, PVC-benzene, PE-1-tetradecene, PP-2,4-dimethyl-1-heptene [16]. However, the selection of markers is different in different research. 1-decene for PE, 4,6,8-trimethyl-1-decene for PP, styrene for PS, and naphthalene for PVC in TGA-FTIR-GC/MS [15].
The liquid-phase method is similar, identifying micro/nano plastics by analyzing plastic pyrolysis products through pyrolysis combined with liquid-phase extraction and mass spectrometry. The detection by liquid phase usually involves the operation of chromatographic columns as well as solid-phase extraction. The choice of a C18 column with methanol solution as the mobile phase is commonly used in research [31]. For example, PET and PC were depolymerized into corresponding monomers, and purified using HLB SPE and MCX SPE columns [32]. Li et al. extracted derivatives of PE, PP, PS, and PET using methanol, then employed 3D principal component analysis and hierarchical cluster analysis to select polymer markers for decoding the polymer information of plastic bottles [46]. However, the application of this method is limited by factors such as plastic types, recycling processes, environmental weathering, organic matter, metals, and microorganisms.
Gas-phase and liquid-phase methods [47, 48] have advantages in the identification process of microplastics. The mass concentration of microplastics can be obtained based on the total mass of the sample, which is more convenient in statistics and suitable for environmental investigation statistics. And the detection process is not affected by the size of the particle, as long as the mass is sufficiently large, better detection results can be obtained. Although there is no requirement for the particle size, the quality of the plastic in the sample is required. Meanwhile, in environmental monitoring, separating and purifying larger plastic particles is easier, whereas purifying smaller submicron or nano plastics is more difficult.
In addition, analysis of copolymerized, cross-linked, and plastics containing modified additives is often difficult and subject to large errors. Cross-linked and copolymerized plastics are harder to crack and have more complex products than regular plastics, such as olefin copolymers and amino cross-linkers. Commonly used additives such as antioxidants, plasticizers, light stabilizers, and flame retardants (Bisphenol A, triclosan, phthalates, etc.). Not only will they affect the experimental results, leading to high ratios of certain chemical bonds, but they will also change the pyrolysis process and conditions of the crosslinked copolymerized substances, thus increasing the difficulty of testing. Therefore, to ensure the reliability of results, mass spectrometry analysis can be combined with infrared spectroscopy results, though this increases the complexity of the analytical process to some extent.
Although traditional analytical methods are relatively mature, it is more or less face high cost, complex operation, and other problems, limiting its widespread application in the field of micro/nano plastic detection and analysis. The rapid analysis technology for micro/nano plastics can supplement existing methods, reducing costs and enhancing detection efficiency. More importantly, the development of detection techniques based on the different properties of micro/nano plastics reveals their specific properties (such as carrying contaminants, interfacial chemistry, aggregation properties, environmental effects), especially the detection results cannot only include types and particle sizes.
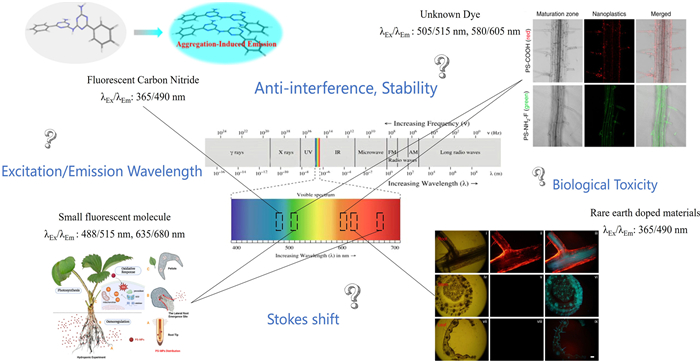
Fluorescence analysis, as a cost-effective analytical method, finds extensive application in fields such as analytical chemistry, environmental monitoring, and biological sciences [49]. The fluorescence analysis method is mainly divided into staining labeling of micro/nano plastics in environmental samples and tracing after labeling (Fig. 4 and Table 2) [50–67].
 DownLoad:
CSV
DownLoad:
CSV
| Materials | Year | Research purpose | Type of plastic | Particle size | Environmental media | Ref. |
| Eu(TTA)3 | 2022 | Tracing in plants and quantified by ICP-MS | PS | 200 nm | Plants | [51] |
| NBD-Cl/NB | 2023 | Tracing in plants | PS | 100, 200 nm | Plants | [52] |
| − | 2021 | Tracing in alluvial deposits | PS | 1, 2, 5 µm | Groundwater | [54] |
| Nile Red | 2022 | Detection of microplastics in egg samples | PE | 50−100um | Food products | [55] |
| Candle ash | 2022 | Microplastic labeling | PS | 40−60 nm | − | [56] |
| iDye poly blue | 2022 | Dissolution marking | PS | 50 nm | − | [57] |
| − | 2022 | Tracing in plants | PS-COOH, PS-NH2 | 38.3, 191.2 nm | Plants | [58] |
| BCNPs | 2023 | Temperature change dual emission | PET | − | − | [59] |
| − | 2023 | Tracing/Co-migration with antibiotics | PS | 1000 nm | Groundwater | [60] |
| CQD(L-AA) | 2023 | Recycled monomers | PS, PLA, PMMA | − | − | [61] |
| − | 2023 | Tracer-nanoparticle co-migration | − | 200 nm | Porous medium | [62] |
| Lignin CQD | 2023 | Detection of microplastics by fluorescence and Rayleigh scattering | PS | − | − | [63] |
| DPNA | 2024 | Microplastics in water and soil | Polyurethane | 106−425 µm | Water/soil | [64] |
| PCP | 2024 | Quantify and label | PS-COOH | 50 nm | Water/plants | [65] |
| Nile Red | 2024 | Sampling and detection, modeling | PP, PE, PU, rubber, Asphalt | 20 µm–5 mm | Groundwater and soil | [66] |
| Carbon dots | 2025 | Detection of submicron plastics | PS | ~200 nm | Water | [67] |
| Note: Carbon quantum dots, CQD; boron-doped carbon nanoparticles, BCNPs; L-ascorbic acid, LAA; 4–chloro-7-nitro-1,2, 3-benzoxadiazole, NBD-Cl; Nile blue, NB; (E)-N-(2-((4-(diphenylamino)benzylidene)amino)phenyl)-7-nitrobenzo[c][1,2,5]oxadiazol-4-amine, DPNA; 4-[1-cyano-2-[4-(diethylamino)-2-hydroxyphenyl]ethenyl]-1-ethylpyridinium, PCP. | ||||||
Environmental samples can utilize hydrophobic fluorescent dyes to label micro/nano plastics through staining. This method was widely adopted in the early stages of research, such as using Nile Red staining to identify plastic particles separate from environmental media, enabling analysis of their quantity and size [68, 69]. However, due to susceptibility to interference from hydrophobic organic compounds or fluorescent substances, the inaccuracy of the data results is significant, requiring extensive manual sorting. Tarafdar et al. simultaneously stained microplastics using three water-based dyes, adjusting the channel settings of the confocal microscope to minimize false-positive signals [70]. Combining computer analysis can enhance sorting speed. Rermborirak et al. achieved identification of six polymers by analyzing the fluorescence patterns of Nile Red-stained microplastics through deep learning [71]. With technological advancements, integrated portable devices can reduce costs and enhance efficiency while providing real-time on-site detection of micro/nano plastics [72]. Staining with dyes presents significant identification errors for smaller plastic particles, as particle stacking and aggregation can increase statistical errors exponentially. Additionally, hydrophobic dyes exhibit poor specificity toward plastics, often resulting in imaging with high signal-to-noise ratios that make it difficult to distinguish from biomass with similar density and structure.
Fluorescent labeling followed by tracer experiments currently represents a reliable and efficient method for studying the environmental migration and bioaccumulation behavior of submicron or nanoplastics. Fluorescent materials used in micro/nano plastic research can be divided into rare-earth fluorescent materials [51], organic small-molecule fluorescent materials [73], and fluorescent nanoparticles [50], and so on. They exhibit differences in fluorescence properties, stability, and toxic effects. Currently, research on fluorescently labeled micro/nano plastics has surged due to the advantages of fluorescence labeling, which offers low cost and high efficiency.
The combination of fluorescent labeling and confocal laser scanning microscope provides finer imaging results and effectively minimizes errors caused by optical diffraction. Zhu et al. investigated interactions with cyanobacterial extracellular polymers using fluorescently labeled amino-functionalized nanoplastics [74]. Wei et al. utilized red and yellow-green fluorescent microspheres to simulate the migration process of microplastics in underground aquifers [75]. Fluorescent labeling techniques are increasingly applied in studies examining micro/nano plastics in plants. Wang et al. studied the migration behavior of micro/nano plastics in crop root systems based on rare-earth fluorescent materials [76]. Li et al. investigated the uptake of atmospheric nanoplastics by plant leaves using rare-earth-fluorescent-labeled polystyrene [77]. The rare-earth fluorescent materials exhibit excellent stability and high fluorescence intensity. Furthermore, indirect quantification of microplastics within tissues can be achieved by measuring the rare-earth element content after digestion. Xu et al. researched the effects of micro/nano plastics on the degree of root lignification in taro using the red fluorescence of Rhodamine 6G [78]. Liu et al. studied the migration behavior of submicron plastic in bean sprouts based on leaf-source fluorescent carbon dots [79]. The leaf-sourced carbon dots have the advantages of low toxicity and a large Stokes shift. Nile blue and Eu-labeled nanoplastics exhibit competitive interactions with clay minerals upon entering wheat plants, and this effect limits the entry of nanoplastics [80]. Fluorescent labeling has greatly facilitated research on micro/nano plastics, advancing studies on their environmental behavior and biological effects.
However, the properties of fluorescent materials directly determine their application options, and solutions for universal adoption remain elusive. Furthermore, it is possible that adding fluorescent materials could affect the inherent characteristics of microplastics, such as density, surface charge, and biotoxicity. Therefore, methods capable of directly testing the properties and behavior of micro/nano plastics in real-environment conditions are crucial.
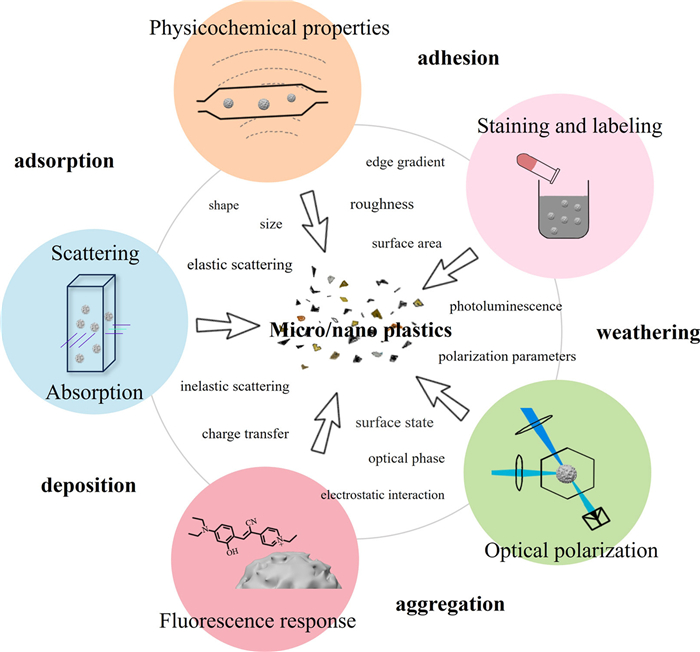
The direct detection of micro/nano plastics is based on the inherent properties of the plastics and their existence media (Fig. 5). Table 3 [65, 81–96] summarizes the current work on rapid detection technology, including methods, objectives, results, and mechanisms. According to differences in detection mechanisms, materials, and equipment, rapid detection relies on specific processing or sample conditions, exhibiting significantly varying sensitivities to different types, sizes, and concentrations of micro/nano plastics.
 DownLoad:
CSV
DownLoad:
CSV
| Detection tools | Year | Treatment | Type of plastic | Source | Size | Limitation | Anti-interference | Mechanism | Ref. | ||||||||||||||||||||||||||||||||||||||||||||||||||||||||||||||||||||||||||||||||||||||||||||||||||||||||||||||||||||||||||||||||||||||||||||||||||||||||||||||||
| Cationic fluorescent probe | 2024 | Release at 75 ℃ + tap water sample | PS-COOH, PS-NH2, PE, PET | Food packaging/tap water/lake water | 50, 160, 170, 670 nm | 0.525 mg/L | Salinity-dependent, pH-dependent; does not react with inorganic, metallic, organic substances, etc. | Electrostatic interaction/ hydrophobicity/molecular restriction of rotation/fluorescence | [65] | ||||||||||||||||||||||||||||||||||||||||||||||||||||||||||||||||||||||||||||||||||||||||||||||||||||||||||||||||||||||||||||||||||||||||||||||||||||||||||||||||
| Dual-positive charged fluorescent probe | 2025 | Release in water at 95 ℃ | PE, PP, PS, ABS, POM, PMMA, PVC, PBAT, PC, PA | Purchase/teabag release | – | 5.0 mg/mL | Selective and photostable | Electrostatic interaction/AIE | [81] | ||||||||||||||||||||||||||||||||||||||||||||||||||||||||||||||||||||||||||||||||||||||||||||||||||||||||||||||||||||||||||||||||||||||||||||||||||||||||||||||||
| Flow cytometer | 2021 | Fixed concentration flow rate | PS | Purchase | 3 µm | 1 × 10⁵ items/s | Distinguish background particles based on emission spectra | Fluorescence/scattered light | [82] | ||||||||||||||||||||||||||||||||||||||||||||||||||||||||||||||||||||||||||||||||||||||||||||||||||||||||||||||||||||||||||||||||||||||||||||||||||||||||||||||||
| In-situ Mie scattering | 2024 | Determine the optimal excitation wavelength at 335 nm | PS, PE, PC | Purchase/grinding | 25–1000 nm | 25 nm 4.2 µg/L | Bottled water simulation 91.4%–110.3% | Mie scattering | [83] | ||||||||||||||||||||||||||||||||||||||||||||||||||||||||||||||||||||||||||||||||||||||||||||||||||||||||||||||||||||||||||||||||||||||||||||||||||||||||||||||||
| Photoacoustic microscopy + deep learning | 2024 | Sample extraction, optimization of excitation wavelength 532 nm | PVC, PS, PC, PU, PP, PE, PET, PTFE | Water/soil sampling | 7–20 µm | 2.5 µm | – | Light absorption properties | [84] | ||||||||||||||||||||||||||||||||||||||||||||||||||||||||||||||||||||||||||||||||||||||||||||||||||||||||||||||||||||||||||||||||||||||||||||||||||||||||||||||||
| Polarized light + backpropagation neural network | 2024 | Aging under 365 nm UV in artificial seawater | PE, PP, PS | Purchase | 0.2–60 µm | 0.2 µm | Degree of weathering, type of plastic | Polarization properties of scattered light | [85] | ||||||||||||||||||||||||||||||||||||||||||||||||||||||||||||||||||||||||||||||||||||||||||||||||||||||||||||||||||||||||||||||||||||||||||||||||||||||||||||||||
| Novel dye combined with smartphones | 2024 | PE/PET in 5% ethanol; PU/PVC/PET in 30% ethanol. | PE, PU, PP, PVC, PS, PET | Purchase/grinding | <300 µm 2 − 3 mm | 25 µm | River water/soil simulation | TICT/AIE/polarity/ hydrogen bonding | [86] | ||||||||||||||||||||||||||||||||||||||||||||||||||||||||||||||||||||||||||||||||||||||||||||||||||||||||||||||||||||||||||||||||||||||||||||||||||||||||||||||||
| Boron-doped carbon nanoparticles | 2022 | 70 ℃, 4 h | PE, PP, PVC, PS, PET, PMMA, PC | Plastic products crushed | 5000 µm | > 5 mm | Separation from soil | Polarity/fluorescence | [87] | ||||||||||||||||||||||||||||||||||||||||||||||||||||||||||||||||||||||||||||||||||||||||||||||||||||||||||||||||||||||||||||||||||||||||||||||||||||||||||||||||
| Conjugated polymer nanoparticles | 2022 | Mixed in phosphate buffer | PE, PP, PS, PC | Plastic products crushed | − | 0.2 µm | Soil suspension | Hydrophobicity/electrostatic interaction/fluorescence | [88] | ||||||||||||||||||||||||||||||||||||||||||||||||||||||||||||||||||||||||||||||||||||||||||||||||||||||||||||||||||||||||||||||||||||||||||||||||||||||||||||||||
| Green fluorescent polymeric carbon nitride | 2023 | 70 ℃, 60 min | PS | Release of lunchboxes | 0.22−50 µm/ > 50 µm | 0.22 µm | Staining in water, ethanol elution | Polar/organophilic/aggregate fluorescence | [89] | ||||||||||||||||||||||||||||||||||||||||||||||||||||||||||||||||||||||||||||||||||||||||||||||||||||||||||||||||||||||||||||||||||||||||||||||||||||||||||||||||
| Cu-g-C3N5 | 2023 | Incubation at different temperatures | PC releases BPA | − | − | 0.09 mg/L BPA | − | Catalytic oxidation | [90] | ||||||||||||||||||||||||||||||||||||||||||||||||||||||||||||||||||||||||||||||||||||||||||||||||||||||||||||||||||||||||||||||||||||||||||||||||||||||||||||||||
| Fluorescence microfluidic system | 2024 | Ethanol/water solution dispersion, Nile Red staining | PS, PVC | Purchase/grinding | 0.32−5.88 µm | 0.1 − 100 mg/L | Susceptible to fluorescence interference | Fluorescence | [91] | ||||||||||||||||||||||||||||||||||||||||||||||||||||||||||||||||||||||||||||||||||||||||||||||||||||||||||||||||||||||||||||||||||||||||||||||||||||||||||||||||
| Gallios flow cytometer and machine learning | 2024 | Dispersed in EPS medium | PE, PP, PVC, PS, PET, PS, PHA | Purchase | 1 − 50 µm | 0.07−14.8 mg/mL | Distinguish microorganisms, mineral particles | Fluorescence/scattered light | [92] | ||||||||||||||||||||||||||||||||||||||||||||||||||||||||||||||||||||||||||||||||||||||||||||||||||||||||||||||||||||||||||||||||||||||||||||||||||||||||||||||||
| AI-assisted nano-DIHM | 2024 | Suspension onto a quartz microscopic slide | PE, PP, PVC, PS, PET, PUR, PSL | Purchase/lake sampling | 197 nm–4 mm | 50 nm | Distinguishing: magnetite/phytoplankton/ oleic acid | The holographic diffraction pattern | [93] | ||||||||||||||||||||||||||||||||||||||||||||||||||||||||||||||||||||||||||||||||||||||||||||||||||||||||||||||||||||||||||||||||||||||||||||||||||||||||||||||||
| Electrochemical analysis of metal labeling | 2024 | Reduced AgNO3 deposition | PS | Purchase | 100–500 nm | 0.1 mg/mL | Cation interference, K+/Ca2+/Na+ | Electrode redox signal | [94] | ||||||||||||||||||||||||||||||||||||||||||||||||||||||||||||||||||||||||||||||||||||||||||||||||||||||||||||||||||||||||||||||||||||||||||||||||||||||||||||||||
| Laser-induced fluorescence + principal component analysis | 2024 | 3.5% NaCl solution or natural seawater dispersion; identified by 405 nm excitation light | PE, PP, PVC, PS, PET, PLA, PA, PMMA, PTFE, ABS | Purchase | 10–30 µm | Mass concentration 0.03% | Less impact from seawater | Radiative/non-radiative transition/fluorescence | [95] | ||||||||||||||||||||||||||||||||||||||||||||||||||||||||||||||||||||||||||||||||||||||||||||||||||||||||||||||||||||||||||||||||||||||||||||||||||||||||||||||||
| Gelpermeation chromatography-ultraviolet detection | 2024 | 5% HCl assisted extraction, THF solubilization filtered; UV absorption wavelength 262 nm determined | PS | Soil sample collection | – | 0.02 µg/mL | – | UV-absorbing phenyl groups in PS | [96] | ||||||||||||||||||||||||||||||||||||||||||||||||||||||||||||||||||||||||||||||||||||||||||||||||||||||||||||||||||||||||||||||||||||||||||||||||||||||||||||||||
| Note: Polyhydroxyalkanoates, PHA; twisted intramolecular charge transfer, TICT; aggregation-induced emission, AIE; artificial intelligence-assisted nanodigital in-line holographic microscopy, AI-assisted nano-DIHM; gel permeation chromatography-ultraviolet detection, GPC-UV; tetrahydrofuran, THF. | |||||||||||||||||||||||||||||||||||||||||||||||||||||||||||||||||||||||||||||||||||||||||||||||||||||||||||||||||||||||||||||||||||||||||||||||||||||||||||||||||||||||||
Micro/nano plastics in the media are small particles, so there is a possibility of application based on the traditional particle detection technology. Wang et al. based on a sequence of methods derived from methods such as flow cytometry, combined with microanalysis to achieve the counting of plastic particles in solution [82]. When micro/nano plastics can be suspended stably in solution, studies can be based on the Beer-Lambert Law. It means that the concentration is determined based on the UV absorption of the microplastic solution. Tsuchida et al. realized the detection of microplastics in seawater by using algorithmic analysis through the different UV absorption ranges of different plastics [97]. The optical-based micro/nano plastic detection technology has the advantages of rapidity and non-destructive testing.
Different detection and analysis methods have different features and are applied in different situations. Mou et al. achieved trace analysis of nanoplastics using 335 nm laser based on Mie scattering [83]. Huang et al. achieved label-free, non-invasive analysis and detection of microplastics by integrating photoacoustic microscopy with image machine learning [84]. Ali et al. established a method for detecting and quantifying microplastics in soil using a hyperspectral imaging system and a near-infrared camera [98]. These detection methods not only facilitate environmental assessment and monitoring but also advance research on the environmental behavior of micro/nano plastics. Dong et al. investigated the migration behavior of fragmented microplastics in porous media using a visual flow cell [99]. Qiao et al. investigated the permeation and retention processes during vertical migration of microplastics of varying sizes and shapes by capturing hydrogel beads and microplastic profiles using a 532 nm laser [100]. Ling et al. studied nanoplastics migration in the subsurface flow zone using UV absorption at 290 nm [101]. Beheshtimaal et al. utilized a shadow imaging system composed of LED lights and cameras to investigate the effects of weathering and biofilm attachment on the vertical distribution of microplastics in water [102]. They demonstrated that increased hydrophilicity and density resulting from aging lead to a more dispersed vertical distribution, thereby impacting the assessment of microplastic pollution in aquatic environments. Ludescher et al. detected nanoplastics using optical sieves based on Mie void resonances, achievable solely through optical microscopy by detecting changes in material refractive index, and with the ability to integrate infrared and Raman spectroscopy techniques [103]. This technology has a wide range of applications and simple equipment, demonstrating significant development potential. However, its application in environmental and biological samples requires systematic research.
In addition, the weathering properties of microplastics cause polarization of light, meaning a change in the anisotropy of light, which is closely related to the structural and compositional properties of microplastics. Changes in the absorption and emission moments result in a change in the vibrational plane of light. In recent research, Liu et al. reported the polarized properties of 120° scattered light due to weathering of microplastics, which enables the determination of microplastic types, particle sizes, and weathering properties through machine learning [85]. In fact, the optical processes on the surface of micro/nano plastics can be simulated based on particle scattering models. By constructing the structure and properties of the scattering interface, solving the Maxwell's equations for electromagnetic plane wave scattering can establish optical models corresponding to experiments.
It was shown that by analyzing the fluorescence lifetimes of microplastics, quantitative/qualitative analysis of microplastics could also be achieved [104]. The weathering of micro/nano plastics leads to the formation of conjugated structures, thereby altering their fluorescence behavior. Consequently, detection can also be achieved based on the plastic's autofluorescence [105]. Similarly, two-photon microscopy is capable of observing the transport behavior of microplastics in plants without marking the microplastics [106].
The characteristics of direct detection methods are simplicity and efficiency, as they can directly reflect the specific physical and chemical properties of micro/nano plastics, such as particle size, shape, edge gradient, structure, interface, and surface state. These properties contain information on the toxicity, carrier contamination, affinity, and settling behavior of micro/nano plastics, which are crucial for environmental risk assessment of micro/nano plastics. Importantly, the properties of the micro/nano plastics are not affected because they do not touch the micro/nano plastics. However, the deposition of micro/nano plastic surface substances and microbial coatings in the environment can alter the absorption, emission, scattering, refraction, and transmission behavior of light. Liu et al. indicated that the aging of submicron plastics results in changes in morphology and functional groups, enhancing multiple scattering on the surface and reducing scattering signals at 90° [67]. Additionally, the carrier properties of pollutants can introduce uncertainties in the scattering optical behavior. By supplementing these studies, the application of direct detection methods can be expanded, which helps to obtain comprehensive information (Fig. 5).
Fluorescent probes are functional materials exhibiting characteristic fluorescence, commonly used in fluorescence imaging and rapid material analysis, possessing significant practical value. Beyond direct fluorescence enhancement and suppression, detection and imaging methods based on principles such as ratio fluorescence, aggregation-induced fluorescence quenching, aggregation-induced emission, and fluorescence resonance energy transfer all show considerable application potential. Different fluorescence phenomena are generated due to charge transfer, molecular torsion, π-π stacking, and spatial charge transfer between the contaminant and the probe under the influence of fundamental forces (Fig. 5). Besides direct fluorescence enhancement and inhibition, measurement and imaging methods derived from the principles of ratiometric fluorescence, aggregated fluorescence quenching, aggregation-induced emission, and fluorescence resonance energy transfer [86] are all very effective.
However, in the research related to micro/nano plastics, there are few studies based on the interaction force between the probe and micro/nano plastics. The underlying reason is that micro/nano plastics have low surface functionality and limited active groups, making it difficult for fluorescent probes to interact with them in a way that significantly affects their electronic transfer and transition processes.
Nonetheless, many researchers have made attempts in this field. Zhang et al. combined fluorescent nanoparticles with microplastics by hot-melting, and found that the polarity of microplastics affects the fluorescence emission of fluorescent nanoparticles, and the larger the polarity, the more obvious the fluorescence redshift [87]. Plastics will have different crystalline properties, polarity, and other properties according to the type of monomer, which is closely related to the molecular composition of the polymer, the polymerization method, and so on. For example, PVC containing Cl elements tends to have a higher polarity, while homopolymerized PP tends to have a higher degree of crystallinity. Choi et al. utilized intramolecular charge transfer in colorimetric near-infrared fluorescent dyes to distinguish polyurethane microplastics based on differences in fluorescence signals [64].
Furthermore, the electrostatic forces generated by the surface charge of micro/nano plastics are more obvious [53]. The weathering of microplastics in the environment increases the oxygen-containing functional groups, mainly -OH and -COOH. These two groups in water ionize and exhibit negative electrical properties. Wu et al. utilized cationic fluorescent molecules bound to negatively charged microplastics and investigated the correlation between microplastic concentration and the fluorescence change after molecular distortion [65]. Xiao et al. utilized the aggregation phenomenon induced by the adsorption affinity of proteins with MPs and realized the sensing of microplastics based on photoelectric response [107].
Plastics are polymeric organics, made up of carbon chains, which are naturally lipophilic. Related studies have also found that micro/nano plastics tend to be present in organs that are high in organismal lipids, such as the liver [108]. Awada et al. synthesized nanoparticles with lipophilic properties using hyaluronic acid, the main component that makes up the intercellular matrix, which showed an affinity for microplastics and could be used as a method for environmental detection [88].
In addition, quantitative detection of micro/nano plastics can also be achieved by utilizing Ag deposition on microplastics in combination with electrochemical measurements of electrical signals [109]. Noumani et al. prepare chitosan-magnesium oxide nanosheet electrodes for sensing and detection of hexamethylenetetramine plastics [110]. It can be hypothesized that it is feasible to proceed with related studies based on microplastic surface properties such as hydrophilicity, complexation, and hydrogen bonding.
Through interactive behavior, the surface charge, polarity, affinity, and other properties of plastic samples can be indirectly reflected, which are important references for environmental risks of micro/nano plastics. Although a lot of research work has been done in this field, which enables the rapid detection of micro/nano plastics under specific conditions, it still faces significant limitations. In the real situation, the composition of the environmental medium is very complex, which makes the surface properties of the micro/nano plastics complicated. The evolution of micro/nano plastics in the environment causes microbial encapsulation, soil agglomeration, and organic matter/heavy metal adsorption. For example, Liu et al. found that the quenching effect of carbon dots can reflect the adsorption/deposition of surface metals on submicron plastics with aging [67]. The surface properties of the micro/nano plastics themselves are neutralized by the interaction of environmental components, resulting in property changes and consequent difficulties in reaching the required test conditions. Therefore, there is an urgent need to provide standardized environmental sample pre-treatment solutions to improve the applicability of these methods.
Rapid detection and analysis of micro/nano plastics in the environment is a challenge for present research. Rapid analysis of micro/nano plastic properties based on surface and interfacial characteristics is essential for comprehensively assessing the current state of micro/nano plastic pollution.
The types, particle sizes, densities, and compositions of micro/nano plastics in environmental media are relatively complex. Beyond data discrepancies caused by sampling methods, it is also challenging to avoid the influence of other environmental components on the detection process. Therefore, pretreatment processes such as separation and purification of micro/nano plastics are also vital for rapid detection and analysis.
Meanwhile, the environmental behavior of micro/nano plastics is influenced by factors such as saline conditions, electrostatic effects, and organic matter, leading to alterations in their adsorption, deposition, and diffusion processes (Fig. 6). The evolution of interfaces of micro/nano plastics also leads to changes in their environmental behavior. This can adversely affect existing methodologies. Currently, the interfacial properties of micro/nano plastics and their interactions with other environmental components remain unclear, necessitating more comprehensive research.
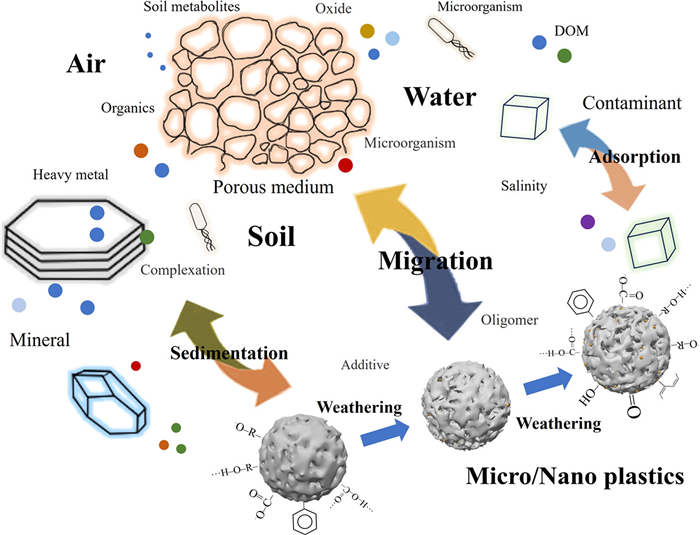
Beyond the types of micro/nano plastics, the complexity and variety of environmental media can make the separation and detection of micro/nano plastics more difficult.
Micro/nano plastics in the atmosphere, water, and soil generally have different properties. Atmospheric microplastics are less dense [111], mostly fibers. Micro/nano plastics in water can be subdivided into suspended and sinking types. Normally, the density less than water or close to water is suspended, while the density larger than the water will sinking. Differences in the salt content of water result in different densities of water; typically, seawater has a higher salt density than freshwater. In addition, microorganisms, organic matter, heavy metals, etc., are present in water and can easily interact with micro/nano plastics.
The composition of the soil medium is usually more complex, containing large amounts of inorganic and organic matter. The operational process for the separation of micro/nano plastics in soil is more complex, and plastics mixed with soil particles are often difficult to obtain by simple processing. It has also been shown that micro/nano plastics are susceptible to co-weathering with rocks during geologic activity to form complexes [112].
As micro/nano plastics accumulate in the soil, they tend to enter the subsurface environment with water infiltration [113, 114]. Depending on the moisture content, they can be divided into saturated and unsaturated zones. Geologic environments tend to have greater variability, and rock evolution can have different mineral compositions. Geological environments tend to be more varied, with rocks evolving with different mineralogical compositions [115], DOM [116], salt conditions [117], heavy metals, etc. In addition, the mineral-associated organic matter usually has certain basic properties such as hydrophobicity, electrically charged, and polarity [118], which make it possible to interact with microplastics. The collection of samples in the subsurface environment, as well as the pre-processing of samples, faces great obstacles.
Furthermore, weathered microplastics are capable of adsorbing dissolved organic matter and forming ecological coronas [119], resulting in more complex ecological effects. Polyvinyl chloride microplastics can form multi-layered connections with iron minerals, with electrostatic forces playing a major role [120]. Related studies have shown that various minerals, such as kaolinite, can retain and deposit microplastics, with low reactivity minerals having the lowest retention (hematite) [121]. Li et al. pointed out that the presence of aged MPs increases the positive charge on the soil surface, reduces the electric field strength, and leads to a decrease in the stability of soil aggregates [122]. The aging effect of natural organic compounds (polysaccharides) can also cause the aggregation of microplastics, mainly dominated by electrostatic interactions, van der Waals forces, and hydrogen bonds [123]. Extracting microplastics from organic matter is difficult, and Huang et al. tested 27 consumption scenarios, providing new insights into the extraction of microplastics from animals, plants, soil, and sludge [124]. The process of interacting with environmental media can have an impact on the detection process. These properties also affect the transformation, migration, enrichment, and other processes of other substances in the environment, and these comprehensive effects also require attention.
Besides extraction and separation, micro/nano plastics exposed to aging and biological effects in the environment can exhibit different interfacial properties. These properties are mainly caused by chemical, physical, biological, and adsorption processes.
Different types of plastics have different chemical structures, densities, etc., and therefore have different interaction behaviors with other substances in the environment. Typically, it is difficult to suspend plastics with low density and hydrophobicity in aqueous environments, preventing the application of direct detection methods based on dispersion systems. The actual properties of micro/nano plastics present in the actual environment and the situation of the environmental media are not clear.
The surface functional groups of micro/nano plastics can significantly affect the charged properties of micro/nano plastics, such as carboxyl and amine groups are positive, and cross-linked carboxyl and hydroxyl groups are usually negative. In addition, micro/nano plastics containing ethenyl and aromatic groups have certain conjugated structures, which are prone to space charge or intramolecular charge transfer [125]. Differences in the shape and surface of micro/nano plastics [126] can lead to differences in hydrodynamic properties, which can lead to different environmental behaviors.
The aging and degradation [127] of micro/nano plastics lead to changes in interfacial properties. An increase in oxygen-containing functional groups on the surface (hydroxyl, carboxyl, aldehyde groups, etc.) often contributes to a negative charge, the ability to attract positively charged ions, and so on. A number of studies have reported the adsorption of heavy metals by aged micro/nano plastics [128]. In addition, oxygen-containing functional groups can increase the polarity, and negative electronegativity may form hydrogen bonds with water, thus increasing the hydrophilicity of micro/nano plastics. The "electric field" effect of microplastics also induces changes in microplastic soil aggregation behavior [122]. Wu et al. reported the formation of flocs with microplastics that alter pollutant interactions [129].
UV-induced aging of microplastics produces dissolved organic compounds, including oxidation products and plastic additives, whose concentration increases with the accumulation of irradiation [130]. The structure and properties of these products are influenced by the morphology and chemical structure of microplastics [131]. Furthermore, the interfacial properties of aged microplastics not only promote the degradation of organic pollutants [132], but the migration behavior of microplastics is also influenced by the subsequent solvation effect [133]. In addition to UV radiation [134], stress can also lead to the release of amorphous polymers, and these byproducts may lead to false positive signals.
In addition, microorganisms can adhere to the surface of micro/nano plastics, which can also lead to changes in the interfacial properties of micro/nano plastics. The biofilm formed reduces ultraviolet light penetration but promotes plastic fragmentation, significantly increasing surface roughness and specific surface area [135]. The extracellular polymers secreted by microorganisms in the environment can form eco-corona with nanoplastics, among which polysaccharides play a major role [74]. Extracellular polymers exhibit specific fluorescent properties and may cause interference during fluorescence detection. Organic substances such as proteins can form protein corona with nanoplastics, altering their hydrophobicity and electrostatic properties. Among them, positively charged proteins will increase the deposition of nanoplastics [136]. In fact, the ecological toxicity of microplastics needs to consider the presence of these biomolecules [137].
Except for adsorption or adhesion, micro/nano plastics can form tighter bonds with other substances in the environment. Wang et al. reported samples of plastic fragments bound to quartz minerals in the environment, which generate secondary plastic particles under wet-dry cycling [112]. Yang et al. discovered plastic samples intercalated with calcium oxide and silica in bottom ash from waste incineration plants [138]. These plastic-rock composites exhibit distinct densities, surface properties, light absorption, and environmental effects, posing new challenges for microplastic differentiation and characterization.
In natural environments, micro/nano plastics are difficult to completely decompose, and break down into submicron/nano plastics with larger specific surface areas through migration and transformation. These minute particles readily enter biological tissues and accumulate in animals or plants.
Generally, plant cell walls can resist larger-sized micro/nano plastics. However, as particle size decreases, the associated pollution risks significantly increase. Submicron/nano plastics can readily enter plants through pores [76] or cracks [73] in the outer layers, causing morphological changes in epidermal cells. Micro/nano plastics in plants undergo vertical translocation via transpiration [77]. Furthermore, the functional groups [53] and charge properties [58] of micro/nano plastics influence their translocation and accumulation processes within plants, resulting in diverse toxic effects. Micro/nano plastics also impact plant metabolic processes and induce stress responses, leading to increased root exudates and biomass [139, 140]. The pollution of edible plants by micro/nano plastics directly threatens human health.
Some research indicates that micro/nano plastics have been detected in human blood [141], placenta [142], and heart tissue [143]. Micro/nano plastics not only cause mechanical damage to these tissues but can even penetrate the blood-brain barrier to induce neurotoxicity. Aging microplastics (polyethylene) can alter the secondary structure of proteins, which means that microplastics can directly affect protein function [144]. Li et al. pointed out in toxicity evaluation studies that microplastics with abundant binding sites have stronger binding affinity, while microplastics with low polarity have stronger binding affinity with non-polar amino acids [145]. In addition, nanoplastics can also activate gene expression of targeted transporters [146]. For such non-inert and persistent substances, there is currently a lack of information on specific biomarkers and dose-response thresholds [147]. Therefore, there is an urgent need for effective solutions to the hazards posed by micro/nano plastic pollution.
Detection of micro/nano plastics that enter plants or animals is difficult to proceed because of the carbon-containing substances that make up all living tissue structures. Microplastics can be separated by a variety of enzymes and hydrogen peroxide digestion [148], but the operation is complicated and has many influencing factors. Determination of micro/nano plastics in plants and animals is expensive, and there is a lack of standardization in the treatment process. Therefore, it is also a challenge to determine the status of microplastic contamination in plants and animals. Reliable sampling, digestion, concentration, and detection standards are essential to ensure comparability of analysis results across biological samples from different regions [149].
The promotion of artificial intelligence and model construction for the detection and behavior prediction of micro/nano plastics. The primary focus of microplastic detection involves analyzing complex and massive datasets through dimensionality reduction and feature extraction, which can be applied to spectrum analysis, image recognition, etc. Its behavior prediction depends on two factors: one is its properties, including density, shape, particle size, and surface properties. The second is the dynamic conditions of environmental media, including drifting, suspension settling, convection diffusion, and decomposition. Most current research is based on modified particle models, but in reality, the properties of microplastics are relatively complex, such as adsorption and adhesion. Moreover, microplastics undergo decomposition and aging in the environment, making it difficult to demonstrate these properties through existing models.
In the related research of micro/nano plastics, more efficient and convenient solutions have also been provided by the development of artificial intelligence.
Among them, image recognition and data analysis are important parts. The improvement of computer image recognition ability, combined with fluorescence methods, can quickly analyze and organize the shape, size, and other information of micro/nano plastics, reducing manual recognition errors and improving efficiency. Deep learning mainly plays a role in data analysis, where large and complex data (such as infrared spectroscopy data, polarized light signals) can be quickly and accurately analyzed, and clear conclusions can be drawn [85, 150]. In addition, machine learning models can optimize the constant factors in existing models by analyzing and organizing datasets, which is helpful for the development of microplastic migration models and improves the scope of their use [151]. Han et al. developed a dissipation kinetics model by studying the dissipation process of chemicals in outdoor plastic products and determining the material air distribution coefficient and conversion rate constant [152]. Liu et al. studied laser-induced fluorescence spectroscopy and achieved efficient identification of plastic samples through one-dimensional convolutional neural networks and continuous convolution models [153]. Machine learning models combined with meta-analysis can also be used to predict the adsorption behavior of microplastics towards pollutants, reveal their adsorption mechanisms, and visualize their adsorption properties [154]. Hyperspectral technology trained on data, combined with remote sensing techniques, can obtain the distribution of micro/nano plastic pollution sites [155], thereby supporting the detection of micro/nano plastics.
However, there are still significant challenges in the detection of micro/nano plastics using artificial intelligence technology. The main reason is that artificial intelligence technology relies on basic detection and characterization techniques, and the datasets between studies are relatively independent and lack universal models. However, the actual medium conditions and interface properties of micro/nano plastics vary greatly, and artificial intelligence models have not fully considered the impact of these differences.
The migration behavior of micro/nano plastics has always been an important research direction, which is related to the assessment of environmental hazards and risks caused by micro/nano plastics (Table 4) [69, 75, 84, 85, 93, 95, 151, 156–161]. The numerical solution of the motion equation can obtain the motion laws of micro/nano plastics, mainly including horizontal and vertical motion. In contrast, hydrodynamic models based on fluid dynamics have a wider applicability, mainly including two-dimensional models such as SLIM and three-dimensional models such as MARS3D.
DownLoad:
CSV
| Analysis object | Algorithm/Model | Properties of MPs | Application scenarios | Ref. | ||||||||||||||||||||||||||||||||||||||||||||||||||||||||||||
| Fluorescent label recognition | CART supervised machine learning | 50–1200 µm | Environmental samples | [69] | ||||||||||||||||||||||||||||||||||||||||||||||||||||||||||||
| Porous flow, resistance, and diffusion behavior | Dispersion–drag force coupled mode + porous flow model+ experiment | PS 80 ± 5 nm | Soil-groundwater | [75] | ||||||||||||||||||||||||||||||||||||||||||||||||||||||||||||
| Photoacoustic microscopic imaging | Deep neural network | Plastic samples in water and soil | Sample analysis | [84] | ||||||||||||||||||||||||||||||||||||||||||||||||||||||||||||
| Polarized light | Back propagation neural network | Weathered microplastics 0.2–60 µm | Water environment monitoring | [85] | ||||||||||||||||||||||||||||||||||||||||||||||||||||||||||||
| Image and morphological parameters | Deep neural network | Various plastic/non-plastic particles | Water environment monitoring | [93] | ||||||||||||||||||||||||||||||||||||||||||||||||||||||||||||
| Fluorescence | Principal components analysis | 10–30 µm various plastic | Water environment monitoring | [95] | ||||||||||||||||||||||||||||||||||||||||||||||||||||||||||||
| Settlement behavior influenced by shape | Settling model + genetic programming + symbolic regression | – | Settlement behavior in aquatic environment | [151] | ||||||||||||||||||||||||||||||||||||||||||||||||||||||||||||
| Settling behavior influenced by shape | Static water settling model + experiment | <5 mm fragments | Settlement behavior in aquatic environment | [156] | ||||||||||||||||||||||||||||||||||||||||||||||||||||||||||||
| Mass balance and fluid dynamics equations | Settling model modified by Stokes equation + turbulence model | Non spherical shape 1–5000 µm | Settlement and resuspension in rivers | [157] | ||||||||||||||||||||||||||||||||||||||||||||||||||||||||||||
| Microplastic adhesion behavior | XDLVO model | Three different shapes | – | [158] | ||||||||||||||||||||||||||||||||||||||||||||||||||||||||||||
| Migration behavior | The advection-dispersion equation coupled with the first- or second-order kinetic deposition site + FDLVO | Fibers and fragments | Porous media under the influence of electrolytes and surfactants | [159] | ||||||||||||||||||||||||||||||||||||||||||||||||||||||||||||
| Migration behavior in porous media | XDLVO; the advection- dispersion-equation; Young-Laplace equation | PBAT-MPs 13 µm | The influence of surface functional groups and roughness | [160] | ||||||||||||||||||||||||||||||||||||||||||||||||||||||||||||
| Raman spectrum analysis | Convolutional neural network | Various plastics 2–145 µm | Distinguish between plastic and natural organic matter | [161] | ||||||||||||||||||||||||||||||||||||||||||||||||||||||||||||
| Note: The extended Derjaguin-Landau-Verwey-Overbeek, XDLVO; The flow Derjaguin-Landau-Verwey-Overbeek, FDLVO; polybutylene adipate terephthalate, PBAT. | ||||||||||||||||||||||||||||||||||||||||||||||||||||||||||||||||
In addition, there are particle tracking models that consider horizontal and vertical displacement processes as well as factors such as agglomeration, density, and shape based on fluid dynamics models. A migration model for microplastics in soil groundwater was developed using the convection diffusion equation by coupling dispersion and resistance through a particle tracking model [75]. Ji et al. studied the settlement model of microplastics with different shapes based on shape factors, and proposed that the asymmetry of microplastic fragments can lead to unbalanced forces during settlement, and affect the horizontal and vertical movements [156]. Akdogan et al. used a shape model of microplastics to simulate the settling and resuspension processes of microplastics in rivers [157], taking into account not only the settling of microplastics but also the influence of river hydrodynamic characteristics.
However, in these studies, the properties of micro/nano plastics remain constant, including particle size, degree of aging, interface properties, and so forth. Kida et al. developed a predictive model to simulate the changes in dissolved organic carbon and degradation products during the degradation process of microplastics (tire rubber, polyvinyl chloride, polypropylene) based on degradation time, water temperature, particle size, and other factors [162]. Gomez-Flores et al. used polystyrene microplastics of different shapes and employed an equivalent spherical model to explain the differences in adhesion efficiency caused by the shape of the microplastics [158]. They combined the extended DLVO model to describe the behavioral differences caused by shape. The development of models based on the basic properties of micro/nano plastics and porous media, such as density, shape, chemical properties, and DLVO parameters [163], is of great significance for studying the environmental behavior of micro/nano plastics. The combination of migration and transformation behavior can provide a more comprehensive model, undoubtedly of great significance.
There have been many new discoveries in the optical properties of micro/nano plastics in recent years, but the related research is still incomplete. Many key factors, such as interface properties, morphology, chemical structure, shape, have not been considered for their anisotropy. However, there has been a certain accumulation of research on particulate matter, which considers differences caused by particle heterogeneity, agglomeration, and material anisotropy [164]. Regarding the optical model of microplastics, reference can be made to the scattering characteristics of three-axis ellipsoids in geometric optics, especially their polarization characteristics [165]. The microplastic model based on optical modeling may provide assistance for the advancement of microplastic detection methods.
Therefore, the construction of models derived from the optical properties of micro/nano plastics can bring important significance to the environmental detection of micro/nano plastics. In addition, the relevant changes based on the adsorption model and the degradation model should also be considered.
Density functional theory is mainly based on the valence layer and molecular orbital theory. Common calculation software includes Gaussian, VASP, Multiwfn, etc. [166, 167]. Although density functional calculations yield approximate results rather than absolute values, the accuracy of the results is convincing and provides reliable evidence in multiple scientific fields. In the study of microplastics, density functional theory also provides theoretical support for the development of related research.
At present, density functional theory is used to study the molecular level electrostatic potential distribution, interaction energy, electronic transition, active sites, etc., in the research of micro/nano plastics (Fig. 7). The calculation results can provide an important basis for related research, judging the interaction behavior with other substances, reaction/degradation processes, etc. The adsorption sites of the structure can be determined by the electrostatic potential, and the adsorption energy can also be obtained by judging the energy of independent and combined systems, which is of great help for the interaction behavior between microplastics and other pollutants. According to the Fukui function, the reaction active sites of different types of plastics can be determined, providing a basis for the aging and degradation process of microplastics. According to HOMO-LUMO gap and vibration analysis, it is even possible to determine the changes in electronic transition properties of polymer segments with structural changes [67]. However, density functional theory is only applicable to the calculation of low molecular weight systems, and the actual molecular weight of microplastic particles is relatively large. In addition, the calculation accuracy, polarization function, structural construction, solvent effect, dispersion correction, and other properties during the calculation process will have a significant impact on the calculation results.
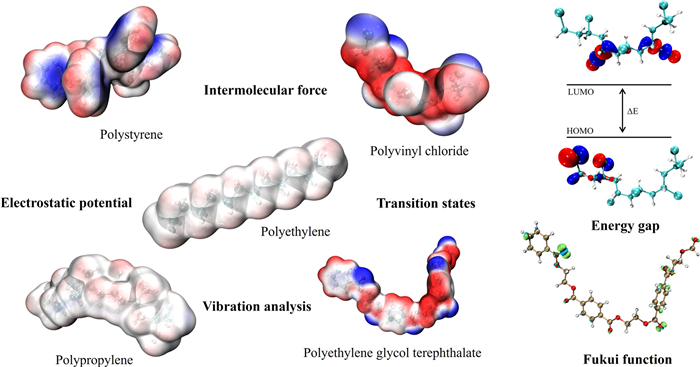
Molecular dynamics simulation, on the other hand, determines the process of particle motion based on Newton's equations of motion and can be conducted in larger systems. Molecular dynamics simulations are highly suitable for studying the interactions between microplastics and pollutants, the aggregation and diffusion processes dominated by van der Waals forces and electrostatic interactions, as well as the configuration changes caused by these interactions [168]. In addition, the influence of ionic strength on the interaction process is also crucial, as metal cations can increase the molecular polar surface area of microplastics [169].
Combining density functional theory and molecular dynamics simulations helps to comprehensively understand the mechanisms and processes of interactions between microplastics and other substances, as well as the interfacial and optical properties of microplastics. However, this simulation is still incomplete because it always stays at a small-scale process, making it difficult to reflect the complex behavior under actual conditions and integrate the influence of macroscopic structural effects. Therefore, there is an urgent need to construct a model that considers both macroscopic morphology and microscopic structure, which can help promote the behavior prediction and detection of micro/nano plastics.
For global microplastic pollution control, it is important to clearly analyze the level of microplastic pollution in each environment at this stage. The properties of micro/nano plastics in the real environment needs to be known, such as concentration, species, interfacial properties, and carrier contamination. To understand the status of microplastic contamination in drinking water and food, and to identify the pathways and risks of microplastic exposure to humans.
The pollution features of micro/nano plastics and their environmental hazards should be specified. The environmental distribution of micro/nano plastics is closely related to the properties of the micro/nano plastics [170]. Therefore, understanding the contamination characteristics of micro/nano plastics requires information about their properties, such as density, optical properties, chemical composition, adsorption, infiltration, chargeability, surface elements. The environmental transport and fate of micro/nano plastics can be analyzed based on their characteristic properties [171]. For example, the aggregation behavior, sedimentation behavior, and biological effects on micro/nano plastics. By combining the environmental conditions of micro/nano plastics and the properties of the environmental media, it is possible to analyze the pollution characteristics of micro/nano plastics. This enables an assessment of the environmental risk posed by environmental micro/nano plastics.
The environmental detection process for microplastic contamination needs to be standardized. There is a lack of standardization in the pre-treatment of environmental samples, and a lack of standardization in the tools, conditions, and processes of detection. Although there are some documents available for reference now, the applicable conditions are insufficient. This makes it difficult to get a reliable assessment of the current status of microplastic pollution based on current research results.
With the development of related research, the understanding of micro/nano plastic pollution continues to deepen. The information obtained by traditional detection techniques is insufficient, which limits further risk assessment, control, and removal of micro/nano plastics. Rapid micro/nano plastic detection techniques based on fluorescence, optical analysis, electrochemical analysis, etc., are still facing major limitations, but related research is essential to understand the environmental and interfacial behavior of micro/nano plastics.
The environmental behavior of micro/nano plastics is complex, including the aging behavior in the environment, the behavior of interaction with pollutants, and the behavior of interaction with organisms/minerals. The results obtained based on different principles are not comparable, and there is a lack of correlation between related parameters. And there are many influencing factors under actual conditions, which lack sufficient theoretical support. Consequently, future studies should concentrate on:
(1) A comprehensive investigation should be conducted by combining rapid detection technology with traditional detection methods.
(2) Improving the universality of rapid detection methods by analyzing the impact of multiple factors.
(3) The integration of multiple detection mechanisms avoids the limitations of a single method.
(4) Fully analyze the exposure risks of micro/nano plastics in plants, animals, and the human body.
(5) Combining relevant algorithms and models with various differences in real situations to establish general models.
Chao Liu: Writing – original draft, Data curation, Conceptualization. Yuan Jiao: Writing – original draft, Data curation, Conceptualization. Chunfan Yang: Data curation. Xiaona Liu: Writing – original draft, Supervision, Data curation. Bo Li: Data curation. Xuewen Miao: Data curation. Wenjun Li: Data curation. Lihong Hao: Data curation. Tianwei Qian: Writing – review & editing, Supervision, Resources, Conceptualization. Wen Liu: Writing – review & editing, Supervision, Resources, Data curation, Conceptualization.
The authors declare that they have no known competing financial interests or personal relationships that could have appeared to influence the work reported in this paper.
This work was financially supported by the Fundamental Research Program of Shanxi Province (No. 202303021221041), the Science and Technology Innovation Project of Colleges and Universities in Shanxi Province (No. 2021L029), the National Construction of High-Level University Public Graduate Project (No. CSC202406930025), the National Key Research and Development Program of China (Nos. 2021YFA1202500 and 2023YFC3710005), the National Natural Science Foundation of China (No. 52270053), the National Key Research and Development Program of China (No. 2021YFA1202500), the Science and Technology Project of Beijing Municipal Ecology and Environment (No. BJST20250207), the Major Science and Technology Projects in Yunnan Province (No. 202502AQ080002), the National Key R & D Program of Shanxi province (No. 202402090301026), the Horizontal Scientific Research Funds of Taiyuan University of Technology (No. RH2500002125), the Special Program for Doctoral Students under the Young Talent Support Project of the Chinese Association for Science and Technology, and the PKU-NUS Center for Applied Sciences-Joint Research Funding, and the Emerging Engineering Interdisciplinary-Young Scholars Project (Peking University).
Supplementary material associated with this article can be found, in the online version, at doi:
R.C. Thompson, Y. Olsen, R.P. Mitchell, et al., Science 304 (2004) 838-838. doi: 10.1126/science.1094559
Y. Ding, S. Tang, T. Zhang, et al., Environ. Sci. Technol. 59 (2025) 18391–18410. doi: 10.1021/acs.est.5c02114
D. Kim, H. Kim, J. Lee, et al., J. Hazard. Mater. 465 (2024) 133516. doi: 10.1016/j.jhazmat.2024.133516
C. Pan, Y. Wu, S. Hu, et al., Environ. Pollut. 322 (2023) 121217. doi: 10.1016/j.envpol.2023.121217
Zhiyong Liu, Arpine Sokratian, A.M. Duda, Sci. Adv. 9 (2023) eadi8716.
S. Wieland, A.F.R.M. Ramsperger, W. Gross, et al., Nat. Commun. 15 (2024) 922. doi: 10.1038/s41467-024-45281-4
S. Yao, X. Li, T. Wang, et al., Environ. Sci. Technol. 57 (2023) 8139–8148. doi: 10.1021/acs.est.3c01877
N.J. van Eck, L. Waltman, Scientometrics 84 (2009) 523–538.
L. Wang, Y. Peng, Y. Xu, et al., Environ. Sci. Technol. 56 (2022) 13029–13035. doi: 10.1021/acs.est.2c02221
Y. Su, X. Hu, H. Tang, et al., Nat. Nanotechnol. 17 (2021) 76–85.
E.D. Okoffo, C.M. Chan, C. Rauert, et al., Environ. Sci. Technol. 56 (2022) 13774–13785. doi: 10.1021/acs.est.2c04091
M. Ourgaud, N.N. Phuong, L. Papillon, et al., Environ. Sci. Technol. 56 (2022) 9999–10009. doi: 10.1021/acs.est.1c08870
S. Phan, J.L. Padilla-Gamiño, C.K. Luscombe, Polym. Test. 116 (2022) 107752. doi: 10.1016/j.polymertesting.2022.107752
R.C. Thompson, Science 386 (2024) eadl2746. doi: 10.1126/science.adl2746
Y. Liu, R. Li, J. Yu, et al., Environ. Pollut. 272 (2021) 115946. doi: 10.1016/j.envpol.2020.115946
M. Sivaraman, L. Fan, W. Yan, Sci. Total Environ. 953 (2024) 176009. doi: 10.1016/j.scitotenv.2024.176009
V.C. Shruti, M.P. Jonathan, P.F. Rodriguez-Espinosa, et al., Sci. Total Environ. 654 (2019) 154–163. doi: 10.1016/j.scitotenv.2018.11.054
J.G.B. Neto, F.L. Rodrigues, I. Ortega, et al., Environ. Pollut. 267 (2020) 115508. doi: 10.1016/j.envpol.2020.115508
M. Dong, Q. Zhang, X. Xing, et al., Sci. Total. Environ. 739 (2020) 139990. doi: 10.1016/j.scitotenv.2020.139990
B. Shi, M. Patel, D. Yu, et al., Sci. Total Environ. 825 (2022) 153903. doi: 10.1016/j.scitotenv.2022.153903
P. Vermeiren, C. Muñoz, K. Ikejima, Environ. Pollut. 262 (2020) 114298. doi: 10.1016/j.envpol.2020.114298
M.K. de Guzman, M. Andjelković, V. Jovanović, et al., Mar. Pollut. Bull. 181 (2022) 113846. doi: 10.1016/j.marpolbul.2022.113846
D. Schymanski, C. Goldbeck, H.U. Humpf, et al., Water Res. 129 (2018) 154–162. doi: 10.1016/j.watres.2017.11.011
J.C. Martinelli, S. Phan, C.K. Luscombe, et al., Sci. Total Environ. 715 (2020) 136826. doi: 10.1016/j.scitotenv.2020.136826
L. Cabernard, L. Roscher, C. Lorenz, et al., Environ. Sci. Technol. 52 (2018) 13279–13288. doi: 10.1021/acs.est.8b03438
N. Liu, S. Cheng, X. Wang, et al., Water Res. 226 (2022) 119293. doi: 10.1016/j.watres.2022.119293
L. Zhu, J. Zhu, R. Zuo, et al., Sci. Total Environ. 856 (2023) 159060. doi: 10.1016/j.scitotenv.2022.159060
J. Yang, M. Monnot, Y. Sun, et al., Water Res. 232 (2023) 119711. doi: 10.1016/j.watres.2023.119711
F. Ö. Sefiloglu, C.N. Stratmann, M. Brits, et al., Environ. Pollut. 351 (2024) 124088. doi: 10.1016/j.envpol.2024.124088
S. Liu, C. Wang, Y. Yang, et al., J. Hazard. Mater. 469 (2024) 133855. doi: 10.1016/j.jhazmat.2024.133855
B. Jia, K. Zhu, Z. Bai, et al., Sci. Total Environ. 953 (2024) 176254. doi: 10.1016/j.scitotenv.2024.176254
Y. Zhang, Y. Peng, C. Peng, et al., Environ. Sci. Technol. 55 (2021) 13802–13811. doi: 10.1021/acs.est.1c02772
J. Zhang, M. Peng, E. Lian, et al., Environ. Sci. Technol. 57 (2023) 8365–8372. doi: 10.1021/acs.est.3c00842
J. shan, J. Zhao, L. Liu, et al., Environ. Pollut. 238 (2018) 121–129. doi: 10.1016/j.envpol.2018.03.026
C. Vitali, R.J.B. Peters, H.-G. Janssen, et al., Talanta 266 (2024) 124965. doi: 10.1016/j.talanta.2023.124965
L. Zhang, D. Wang, W. Li, et al., J. Clean. Prod. 486 (2025) 144455. doi: 10.1016/j.jclepro.2024.144455
G. Chen, Y. Zou, G. Xiong, et al., J. Hazard. Mater. 480 (2024) 135996. doi: 10.1016/j.jhazmat.2024.135996
C.N. Andoh, F. Attiogbe, N.O. Bonsu Ackerson, et al., Infrared. Phys. Technol. 136 (2024) 105070. doi: 10.1016/j.infrared.2023.105070
C.F. Araujo, M.M. Nolasco, A.M.P. Ribeiro, et al., Water Res. 142 (2018) 426–440. doi: 10.1016/j.watres.2018.05.060
Y. Jiang, X. Wang, G. Zhao, et al., Water Res. 255 (2024) 121444. doi: 10.1016/j.watres.2024.121444
Z. Li, K. Han, A. Zhang, et al., Talanta 266 (2024) 125070. doi: 10.1016/j.talanta.2023.125070
S. Liu, Y. Qin, Q. Liu, et al., Measurement 231 (2024) 114629. doi: 10.1016/j.measurement.2024.114629
H. Rhee, S. Jeong, H. Lee, et al., Environ. Pollut. 342 (2024) 123080. doi: 10.1016/j.envpol.2023.123080
L. Ren, S. Liu, S. Huang, et al., Talanta 260 (2023) 124611. doi: 10.1016/j.talanta.2023.124611
M. Kansiz, C. Prater, E. Dillon, et al., Micros. Today 28 (2020) 26–36.
Y. Li, K. Poisson, M.H. McMinn, et al., Environ. Sci. Technol. 12 (2025) 1019–1025.
G. Dierkes, T. Lauschke, S. Becher, et al., Anal. Bioanal. Chem. 411 (2019) 6959–6968. doi: 10.1007/s00216-019-02066-9
Q. Huang, X. Wu, G. Cao, et al., TrAC Trends Anal. Chem. 178 (2024) 117853. doi: 10.1016/j.trac.2024.117853
S. Liu, E. Shang, J. Liu, et al., Front. Environ. Sci. Eng. 16 (2021) 8.
Z. Song, Z. Fang, J. Chen, et al., Spectrochim. Acta A: Mol. Biomol. Spectrosc. 276 (2022) 121238. doi: 10.1016/j.saa.2022.121238
Y. Luo, L. Li, Y. Feng, et al., Nat. Nanotechnol. 17 (2022) 424–431. doi: 10.1038/s41565-021-01063-3
C. Zhang, N. Yue, X. Li, et al., J. Hazard. Mater. 449 (2023) 131019. doi: 10.1016/j.jhazmat.2023.131019
X.D. Sun, X.Z. Yuan, Y. Jia, et al., Nat. Nanotechnol. 15 (2020) 755–760. doi: 10.1038/s41565-020-0707-4
N. Goeppert, N. Goldscheider, J. Hazard. Mater. 408 (2021) 124844. doi: 10.1016/j.jhazmat.2020.124844
Q. Liu, Z. Chen, Y. Chen, et al., Food Chem. 397 (2022) 133771. doi: 10.1016/j.foodchem.2022.133771
C.M. Shebeeb, A. Joseph, C. Farzeena, et al., Appl. Nanosci. 12 (2022) 2725–2731. doi: 10.1007/s13204-022-02566-8
B. Nguyen, N. Tufenkji, Environ. Sci. Technol. 56 (2022) 6426–6435. doi: 10.1021/acs.est.1c08480
J. Zhu, J. Wang, R. Chen, et al., Environ. Sci. Technol. 56 (2022) 6436–6444. doi: 10.1021/acs.est.1c08503
J. Zhang, Z. Zhang, H. Li, et al., Dyes Pigments 220 (2023) 111750. doi: 10.1016/j.dyepig.2023.111750
S. Li, M. Yang, H. Wang, et al., Environ. Res. 218 (2022) 114403.
L.H. Kugelmass, C. Tagnon, E.E. Stache, J. Am. Chem. Soc. 145 (2023) 16090–16097. doi: 10.1021/jacs.3c04448
Z. Dong, Z. Chen, J. Rui, et al., Water Res. 244 (2023) 120491. doi: 10.1016/j.watres.2023.120491
H. Zhao, Z. Jiang, C. Wang, et al., Crystals 13 (2023) 983. doi: 10.3390/cryst13060983
B. Choi, D. Gil, J.J. Lee, et al., J. Hazard. Mater. 471 (2024) 134332. doi: 10.1016/j.jhazmat.2024.134332
T. Wu, G. Hu, J. Ning, et al., J. Hazard. Mater. 461 (2024) 132695. doi: 10.1016/j.jhazmat.2023.132695
A.R. Laramie, W.D. Shuster, Y.Z. Wager, et al., J. Hazard. Mater. 480 (2024) 136058. doi: 10.1016/j.jhazmat.2024.136058
C. Liu, Y. Jiao, C. Yang, et al., Water Res. 277 (2025) 123377. doi: 10.1016/j.watres.2025.123377
L.S. Galvao, R.R. Ferreira, E.M.S. Fernandes, et al., J. Hazard. Mater. 443 (2023) 130217. doi: 10.1016/j.jhazmat.2022.130217
N. Meyers, A.I. Catarino, A.M. Declercq, et al., Sci. Total Environ. 823 (2022) 153441. doi: 10.1016/j.scitotenv.2022.153441
A. Tarafdar, S.H. Choi, J.H. Kwon, J. Hazard. Mater. 432 (2022) 128755. doi: 10.1016/j.jhazmat.2022.128755
K. Rermborirak, P. Nanuan, P. Komonpan, et al., J. Hazard. Mater. Adv. 19 (2025) 100787.
J. Leonard, H.C. Koydemir, V.S. Koutnik, et al., J. Hazard. Mater. Lett. 3 (2022) 100052. doi: 10.1016/j.hazl.2022.100052
L. Li, Y. Luo, R. Li, et al., Nat. Sustain. 3 (2020) 929–937. doi: 10.1038/s41893-020-0567-9
R. Zhu, X. Tan, I. Ali, et al., Water Res. 278 (2025) 123394. doi: 10.1016/j.watres.2025.123394
Y. Wei, Y. Chen, X. Cao, et al., Environ. Sci. Technol. Lett. 58 (2024) 15224–15235.
L. Wang, B. Liu, W. Zhang, et al., J. Hazard. Mater. 457 (2023) 131732. doi: 10.1016/j.jhazmat.2023.131732
Y. Li, J. Zhang, L. Xu, et al., Nature 641 (2025) 666–673. doi: 10.1038/s41586-025-08831-4
G. Xu, X. Li, T. Zhu, et al., Environ. Sci. Technol. 59 (2025) 8345–8356. doi: 10.1021/acs.est.4c11230
C. Liu, Y. Jiao, J. Guo, et al., J. Hazard. Mater. 470 (2024) 134272. doi: 10.1016/j.jhazmat.2024.134272
J. Yang, C. Tu, R. Li, et al., J. Hazard. Mater. 497 (2025) 139608. doi: 10.1016/j.jhazmat.2025.139608
M. Wang, F. Kong, D. Liu, et al., Sens. Actuators B: Chem. 424 (2025) 136928. doi: 10.1016/j.snb.2024.136928
X. Wang, H. Song, Y. Liu, et al., ACS EST. Engg. 1 (2021) 1668–1677. doi: 10.1021/acsestengg.1c00253
L. Mou, Q. Zhang, R. Li, et al., J. Hazard. Mater. 470 (2024) 134186. doi: 10.1016/j.jhazmat.2024.134186
M. Huang, K. Han, W. Liu, et al., J. Hazard. Mater. 470 (2024) 134188. doi: 10.1016/j.jhazmat.2024.134188
M. Liu, H.M. Liu, K. Yang, et al., Environ. Sci. Technol. 58 (2024) 19004–19015. doi: 10.1021/acs.est.4c08711
J.J. Lee, J. Kang, C. Kim, J. Hazard. Mater. 465 (2024) 133168. doi: 10.1016/j.jhazmat.2023.133168
J. Zhang, H. Li, Y. Li, et al., Chem. Eng. J. 435 (2022) 135075. doi: 10.1016/j.cej.2022.135075
A. Awada, M. Potter, D. Wijerathne, et al., ACS Appl. Mater. Interfaces 14 (2022) 46562–46568. doi: 10.1021/acsami.2c12338
X. Zheng, Q. Feng, J. Chen, et al., Sci. Total Environ. 864 (2023) 161155. doi: 10.1016/j.scitotenv.2022.161155
X. Liu, F. Wang, C. Xia, et al., Microchem. J. 190 (2023) 108682. doi: 10.1016/j.microc.2023.108682
K. Ko, H. Chung, Sci. Total Environ. 950 (2024) 175016. doi: 10.1016/j.scitotenv.2024.175016
X. Wang, Y. Li, A. Kroll, et al., Environ. Sci. Technol. 58 (2024) 10240–10251. doi: 10.1021/acs.est.4c00304
Z. Wang, D. Pal, A. Pilechi, et al., Environ. Sci. Technol. 58 (2024) 8919–8931. doi: 10.1021/acs.est.3c10408
Z. Zhao, X. Zhao, J. Shan, et al., Sci. Total Environ. 907 (2024) 168013. doi: 10.1016/j.scitotenv.2023.168013
X. Meng, S. Chen, D. Li, et al., J. Hazard. Mater. 465 (2024) 133352. doi: 10.1016/j.jhazmat.2023.133352
H. Li, D. Jiang, Y. Wang, et al., J. Hazard. Mater. 476 (2024) 135127. doi: 10.1016/j.jhazmat.2024.135127
K. Tsuchida, Y. Imoto, T. Saito, et al., Ecotoxicol. Environ. Saf. 280 (2024) 116366. doi: 10.1016/j.ecoenv.2024.116366
M.A. Ali, X. Lyu, M.S. Ersan, et al., J. Hazard. Mater. 476 (2024) 135041. doi: 10.1016/j.jhazmat.2024.135041
S. Dong, M. Zhou, X. Su, et al., Water Res. 214 (2022) 118195. doi: 10.1016/j.watres.2022.118195
X. Qiao, S. Qian, S. Dong, et al., Environ. Sci. Technol. 58 (2024) 21037–21045. doi: 10.1021/acs.est.4c07741
X. Ling, Z. Yan, G. Lu, Water Res. 219 (2022) 118609. doi: 10.1016/j.watres.2022.118609
A. Beheshtimaal, R. Xu, B. Wang, et al., Water Res. 287 (2025) 124456. doi: 10.1016/j.watres.2025.124456
D. Ludescher, L. Wesemann, J. Schwab, et al., Nat. Photonics. 19 (2025) 1138–1145. doi: 10.1038/s41566-025-01733-x
M. Wohlschläger, M. Versen, M.G.J. Löder, et al., Anal. Bioanal. Chem. 416 (2024) 3543–3554. doi: 10.1007/s00216-024-05305-w
C. Wang, X. Gu, R. Dong, et al., Environ. Sci. Technol. 57 (2023) 6626–6635. doi: 10.1021/acs.est.2c07537
H. Sun, C. Lei, J. Xu, et al., J. Hazard. Mater. 416 (2021) 125854. doi: 10.1016/j.jhazmat.2021.125854
Z. Xiao, X. Zhang, S. Hong, et al., Biosens. Bioelectron. 249 (2024) 116037. doi: 10.1016/j.bios.2024.116037
W. Cheng, X. Li, Y. Zhou, et al., Sci. Total Environ. 806 (2022) 150328. doi: 10.1016/j.scitotenv.2021.150328
J. Liu, J. Niu, W. Wu, et al., Mar. Pollut. Bull. 214 (2025) 117695. doi: 10.1016/j.marpolbul.2025.117695
A. Noumani, D. Verma, A. Kaushik, et al., Environ. Res. 252 (2024) 118894. doi: 10.1016/j.envres.2024.118894
Y. Liu, Z. Nie, Y. Meng, et al., Environ. Res. 265 (2025) 120460. doi: 10.1016/j.envres.2024.120460
L. Wang, M.S. Bank, J. Rinklebe, et al., Environ. Sci. Technol. Lett. 57 (2023) 7009–7017. doi: 10.1021/acs.est.3c00662
Z. Wei, T. Wei, Y. chen, et al., J. Environ. Manage 358 (2024) 120882. doi: 10.1016/j.jenvman.2024.120882
E. Severini, L. Ducci, A. Sutti, et al., Water 14 (2022) 1913. doi: 10.3390/w14121913
H. Zhang, B. Li, X. Liu, et al., Water Res. 262 (2024) 122089. doi: 10.1016/j.watres.2024.122089
L. Wang, J. Xin, H. Nai, et al., Sci. Total Environ. 712 (2020) 135502. doi: 10.1016/j.scitotenv.2019.135502
C. Xiao, S. Qu, Z.J. Ren, et al., Environ. Sci. Technol. 58 (2024) 21002–21014. doi: 10.1021/acs.est.4c10318
T.R. Underwood, Proc. Natl. Acad. Sci. U. S. A. 121 (2024) e2413216121. doi: 10.1073/pnas.2413216121
R.B. Schefer, A. Armanious, D.M. Mitrano, Environ. Sci. Technol. 57 (2023) 14707–14716. doi: 10.1021/acs.est.3c04180
Y. Zhao, X. Liu, H. Wang, et al., Chem. Eng. J. 488 (2024) 150721. doi: 10.1016/j.cej.2024.150721
C. Merino-Guzmán, I. Jofré-Fernández, Environ. Pollut. 378 (2025) 126487. doi: 10.1016/j.envpol.2025.126487
X. Li, R. Wang, W. Dai, et al., J. Hazard. Mater. 469 (2024) 134048. doi: 10.1016/j.jhazmat.2024.134048
Q. Peng, Z. Feng, M. Li, et al., Water Res. 284 (2025) 123949. doi: 10.1016/j.watres.2025.123949
K. Huang, L. Xie, X. Gu, et al., Water Res. 282 (2025) 123935. doi: 10.1016/j.watres.2025.123935
J. Hu, Q. Li, X. Wang, et al., Angew. Chem. Int. Ed. 58 (2019) 8405–8409. doi: 10.1002/anie.201902264
M. Zhang, J. Hou, J. Wu, et al., Sci. Total Environ. 881 (2023) 163237. doi: 10.1016/j.scitotenv.2023.163237
L. Xie, K. Zhu, N. Chen, et al., Environ. Sci. Technol. 58 (2024) 22502–22518. doi: 10.1021/acs.est.4c09107
Y. Liu, Y. Hu, C. Yang, et al., Water Res. 163 (2019) 114870. doi: 10.1016/j.watres.2019.114870
N. Wu, S.W.D. Grieve, A.J. Manning, et al., Nat. Water 2 (2024) 1082–1090. doi: 10.1038/s44221-024-00332-4
Y. Cao, Y. Liu, K. Guo, et al., Water Res. 282 (2025) 123641. doi: 10.1016/j.watres.2025.123641
Q. Wang, W. Gu, H. Chen, et al., J. Hazard. Mater. 480 (2024) 136154. doi: 10.1016/j.jhazmat.2024.136154
L. Bai, S. Liang, H. Li, et al., Environ. Sci. Technol. 59 (2025) 1388–1398. doi: 10.1021/acs.est.4c11206
Q. Ma, Y. Sun, S. Zhou, et al., J. Environ. Manage. 377 (2025) 124696. doi: 10.1016/j.jenvman.2025.124696
D. Li, P. Li, Y. Shi, et al., Nat. Commun. 16 (2025) 3814. doi: 10.1038/s41467-025-58898-w
I. Goßmann, H. Mitsutake, J. Degenhardt, et al., Environ. Sci. Technol. 59 (2025) acs. est. 5c08345.
X. Ling, G. Lu, L. Zhang, et al., Water Res. 256 (2024) 121574. doi: 10.1016/j.watres.2024.121574
M. Junaid, J. Wang, Water Res. 201 (2021) 117319. doi: 10.1016/j.watres.2021.117319
C. Yang, Q. Huang, Y. You, et al., Water Res. 287 (2025) 124486. doi: 10.1016/j.watres.2025.124486
Y. Wang, L. Xiang, F. Wang, et al., Environ. Pollut. 320 (2023) 121081. doi: 10.1016/j.envpol.2023.121081
M. Zhao, C.P. Li, C. Zhang, et al., Sci. Total Environ. 901 (2023) 166434. doi: 10.1016/j.scitotenv.2023.166434
H.A. Leslie, M.J.M. van Velzen, S.H. Brandsma, et al., Environ. Int. 163 (2022) 107199. doi: 10.1016/j.envint.2022.107199
A. Ragusa, A. Svelato, C. Santacroce, et al., Environ. Int. 146 (2021) 106274. doi: 10.1016/j.envint.2020.106274
Y. Yang, E. Xie, Z. Du, et al., Environ. Sci. Technol. 57 (2023) 10911–10918. doi: 10.1021/acs.est.2c07179
M.M. Elmer-Dixon, L.P. Fawcett, E.N. Sorensen, et al., Environ. Sci. Technol. 58 (2024) 10207–10215. doi: 10.1021/acs.est.3c10028
X. Li, Y. Zhao, Q. Pu, et al., J. Hazard. Mater. 459 (2023) 132046. doi: 10.1016/j.jhazmat.2023.132046
Y.K. Hou, S. Gao, Q. Lai, et al., J. Hazard. Mater. 495 (2025) 138912. doi: 10.1016/j.jhazmat.2025.138912
V.C. Shruti, G. Kutralam-Muniasamy, Environ. Sci. Technol. 59 (2025) acs. est. 5c05922.
M.G.J. Löder, H.K. Imhof, M. Ladehoff, et al., Environ. Sci. Technol. 51 (2017) 14283–14292. doi: 10.1021/acs.est.7b03055
J. Zhao, R. Lan, H. Tan, et al., Nat. Rev. Bioeng. (2025) 1–15.
H. Rawat, A. Gaur, N. Singh, et al., Food Chem. X 29 (2025) 102687. doi: 10.1016/j.fochx.2025.102687
J. Zhang, C.E. Choi, Water Res. 272 (2025) 122961. doi: 10.1016/j.watres.2024.122961
H. Wenjing, S. Lihao, X. Qing, et al., Environ. Sci. Technol. 59 (2025) 2181–2191. doi: 10.1021/acs.est.4c08651
L. Zhijian, S. Lanjun, M. Xiongfei, et al., Spectrochim. Acta A: Mol. Biomol. Spectrosc. 341 (2025) 126450. doi: 10.1016/j.saa.2025.126450
S. Bi, R. Wu, X. Liu, et al., J. Hazard. Mater. 489 (2025) 137479. doi: 10.1016/j.jhazmat.2025.137479
Z.K. Holt, S.D. Khan, D.F. Rodrigues, Environ. Pollut. 377 (2025) 126426. doi: 10.1016/j.envpol.2025.126426
C. Ji, J. Zhang, G. Liu, et al., Sci. Total Environ. 955 (2024) 176857. doi: 10.1016/j.scitotenv.2024.176857
Z. Akdogan, B. Guven, Water Res. 264 (2024) 122181. doi: 10.1016/j.watres.2024.122181
A. Gomez-Flores, S. Jin, H. Nam, et al., J. Hazard. Mater. 470 (2024) 134146. doi: 10.1016/j.jhazmat.2024.134146
S. Dong, X. Su, L. Sheng, et al., Environ. Sci. Technol. 58 (2024) 21058–21067. doi: 10.1021/acs.est.4c10405
B. Wang, L. Wu, K. Pang, et al., Water Res. 267 (2024) 122514. doi: 10.1016/j.watres.2024.122514
S. Lee, H. Jeong, S.M. Hong, et al., Water Res. 246 (2023) 120710. doi: 10.1016/j.watres.2023.120710
M. Kida, M. Musiał, K. Pochwat, et al., J. Hazard. Mater. 471 (2024) 134396. doi: 10.1016/j.jhazmat.2024.134396
X. Yang, D.W.S. Tang, J. Hazard. Mater. 484 (2025) 136728. doi: 10.1016/j.jhazmat.2024.136728
T. Nousiainen, J. Quant. Spectrosc. Radiat. Transf. 110 (2009) 1261–1279. doi: 10.1016/j.jqsrt.2009.03.002
B. Lei, Y. Ping, George W. Kattawar, et al., Appl. Opt. 48 (2008) 114–126.
T. Lu, F. Chen, J. Comput. Chem. 33 (2012) 580–592. doi: 10.1002/jcc.22885
W. Humphrey, A. Dalke, K. Schulten, J. Mol. Graph. 14 (1996) 33–38. doi: 10.1016/0263-7855(96)00018-5
F. Simonetti, M. Mancini, V. Gioia, et al., Water Res. 278 (2025) 123324. doi: 10.1016/j.watres.2025.123324
Q. Jiang, Z. Li, Z. Cui, et al., Polymers 13 (2021) 2730. doi: 10.3390/polym13162730
W. Zhao, S. Shao, H. Ma, et al., Chin. Chem. Lett. 36 (2025) 110846. doi: 10.1016/j.cclet.2025.110846
Y. Sun, W. Ding, Y. Wang, et al., Chin. Chem. Lett. 36 (2025) 109941. doi: 10.1016/j.cclet.2024.109941

Figure 1 Micro/nano plastics research hotspots and the development of detection analysis. Data from Web of Science core collection (Updated in September 2025).

Figure 2 Keywords clustering analysis of micro/nano plastics detection based on VOSviewer 1.6.20 (data from Web of Science core collection with edition of SCI-EXPANDED, Updated in September 2025).


Figure 6 Coupled mechanisms of environmental media and micro/nano plastic interfacial properties.
Table 1. Detection of conventional environmental micro/nano plastics.
| Detection tools | Environmental media | Pretreatment | Types of microplastics | Particle size | Quantity/mass concentration | Detection limitation | Type of research | Ref. |
| O-PTIR | Baby teats | Steam treatment, flushing | Polydimethylsiloxane, polyamide resin additives | 0.6–332 µm | 0.99 × 10⁵ to 5.0 × 10⁵ particles per teat | 0.6 µm | Investigation | [10] |
| TGA-FTIR-GC/MS | Crayfish | Homogenate, 10% HNO3, ethanol washing, KOH digestion | PE, PP, PVC, PS | – | 0.16–1.71 mg/kg | – | Field investigation | [15] |
| Py-GC/MS | Beaches | Density separation, Fenton, low-temperature solvent extraction of 2-chlorophenol | PET, PS | 1.2–100 µm mainly | 0.019 ± 0.03–6.0 ± 3.6 mg/kg | LOQ <0.1 µg | Field investigation | [16] |
| Stereoscopic microscope + SEM | River sediment | ZnCl2 density separation, H2O2 | Films, fragments, fibers, particles | – | 833–1633 items/kg | – | Field investigation | [17] |
| Stereoscopic microscope + FTIR | Fish intestine | Formalin, alcohol | PA, PU, PET, PS, PP | 0.1–135 mm | 0.06–1.65 items/individual | 0.001 mm | – | [18] |
| Laser confocal Raman spectrometer | Riparian sediments | Dry, clean | PE, PP, PET, PVC | – | – | – | Weathering | [19] |
| SEM + deep learning | – | Crushing, splitting | PE, PET, PS, PU, PC, PP, PAN, PA, PVC | 50 µm–1 mm | – | – | Methodological study | [20] |
| Nile Red + µ-FTIR | Sediments | Fenton, ZnCl2 density separation | PE, PP, PS, PA, PVC, PET | 0.5–0.0625 mm | – | 62.5 µm | Methodological study | [21] |
| Nile Red + µ-FTIR | Clams | 10% KOH digestion, ZnCl2 density separation, lipase treatment | PE, PET, PP, PS | 20–2000 µm; > 2000 µm | 2.70–41.63 items/g | 20 µm | Field investigation | [22] |
| µ-Raman | Bottled water | Flushing, gold-plated polycarbonate filtration | PEST, PE, PS, PP | 5–100 µm, > 100 µm | 27–115 items/L | 5 µm | Investigation | [23] |
| µ-FTIR + µ-Raman | Oysters | H2O2, density separation | PS, PE, PP | 50–150 µm | 0.69–3 items/per oyster | 5 µm | Field investigation | [24] |
| µ-FTIR + µ-Raman | Surface water | Filtration, visual picking | PE, PP, PS, PMMA, CA, PVA, polyacrylonitrile, rubber | 10–500 µm; > 500 µm | 38–2621 items/m3 | 1 µm | Field investigation | [25] |
| LDIR | Septic tank | Fenton, HNO3 digestion, anhydrous ethanol, NaI density separation, H2O2 | PE, PP, PET, PVC, PA, PU, etc., total 34 types | 20–100 µm | 1489–4816 items/g | 20 µm | Field investigation | [26] |
| LDIR | Human placenta | Filtration, potassium formate, anhydrous ethanol | PVC, PP, PBS, etc., total 11 types | 20.34–307.29 µm | 2.70±2.65 items/g | 20 µm | Investigation | [27] |
| µ-FTIR | Seawater Freshwater wastewater | H2O2, KOH, Fenton | PE, PP, PS, PET | <50 µm <150 µm | – | – | Field investigation | [28] |
| µ-FTIR + Py-GC–MS | Fresh water in the city | H2O2 | PE, PP, PS, PVC, PET, PMMA, etc., total 12 types | 10–300 µm | 16–107 MP/m3; Py-GC/MS 8.5–754 µg/m3 µ-FTIR 2.0–789 µg/m3 | 10 µm | Field investigation | [29] |
| Py-GC/MS | Human artery | HNO3 | PET, PA, PVC, PE | – | 52.62–225.23 µg/g | mass-to-charge ratio: 29–600 | Investigation | [30] |
| LC-MS | Atmosphere | H2O2, depolymerization of methanol and potassium hydroxide, acetonitrile | PEG, HTPE, PET, PPG, PA | – | 589.85–3531.59 ng/m3 | 14.20 ng/m3 | Field investigation | [31] |
| LC-MS + GC–MS/ LDIR + µ-FTIR | Landfill | ZnCl2 density separation, H2O2, pentanol + KOH depolymerization, methanol extraction | PET, PC, PE, PP, PU, PS, PVC, RU, etc. | > 1mm, 0.25–1 mm, <0.25 mm | 25–113 items/g | – | Field investigation | [32] |
| SERS + nanoparticle tracking analysis | Bottled water | Filtration, HCl, KOH, CH2Cl2 flushing | PET | ~150 nm | (1.66 × 10⁸)±(2.33 × 10⁷) items/mL | 50 nm, 1.5 × 10¹¹ items/mL | Methodology | [33] |
| Hyperspectral imaging technology | Soil | NaCl density separation, visual flotation | PE (white/black) and six other different colors of household plastic | 0.5–1 mm, 1–5 mm | – | 58%–100% | Field investigation | [34] |
| Nile Red + artificial intelligence | Bottled water | Nile Red-acetone-ethanol solution, surfactant dispersion | PE, PS, LDPE, PA6, PET, PVDC, PMMA | 5–300 µm | – | 28 items/500 mL | Investigation | [35] |
| µ-FTIR | Wetlands | H2O2, NaCl, ZnCl2 | PP, PE, PA, PVC | 0.01–1.74 mm | Water 325–1615 items/m3 Sediment 323–681 items/kg | 10 µm | Field investigation | [36] |
| µ-FTIR | Groundwater | Filtration, drying | RY, PET, PVC, PES | 0–5 mm | 0–61 items/m3 | – | Field investigation | [37] |
| Note: Surface-enhanced Raman spectroscopy, SERS; scanning electron microscope, SEM; Fourier transform infrared microscopy, µ-FTIR; Laser direct infrared, LDIR; Raman microscopy, µ-Raman; Optical-photothermal infrared, O-PTIR; Thermogravimetric analysis, TGA; Gas chromatography/mass spectrometry, GC/MS; Liquid chromatography-mass spectrometry, LC-MS; Polyethylene, PE; Polypropylene, PP; Polyvinyl chloride, PVC; Polystyrene, PS; Polyamide/Nylon, PA; Polyethylene glycol terephthalate, PET; Polyethersulfone, PES; Rubber, RU; Polyvinylidene chloride, PVDC; Poly(methyl methacrylate, PMMA; Polylactic acid, PLA; Cellulose acetate fibre, CA; Limit of detection, LQD. | ||||||||
 下载: 导出CSV
Table 2. Application of fluorescent materials for micro/nano plastic detection and analysis.
| Materials | Year | Research purpose | Type of plastic | Particle size | Environmental media | Ref. |
| Eu(TTA)3 | 2022 | Tracing in plants and quantified by ICP-MS | PS | 200 nm | Plants | [51] |
| NBD-Cl/NB | 2023 | Tracing in plants | PS | 100, 200 nm | Plants | [52] |
| − | 2021 | Tracing in alluvial deposits | PS | 1, 2, 5 µm | Groundwater | [54] |
| Nile Red | 2022 | Detection of microplastics in egg samples | PE | 50−100um | Food products | [55] |
| Candle ash | 2022 | Microplastic labeling | PS | 40−60 nm | − | [56] |
| iDye poly blue | 2022 | Dissolution marking | PS | 50 nm | − | [57] |
| − | 2022 | Tracing in plants | PS-COOH, PS-NH2 | 38.3, 191.2 nm | Plants | [58] |
| BCNPs | 2023 | Temperature change dual emission | PET | − | − | [59] |
| − | 2023 | Tracing/Co-migration with antibiotics | PS | 1000 nm | Groundwater | [60] |
| CQD(L-AA) | 2023 | Recycled monomers | PS, PLA, PMMA | − | − | [61] |
| − | 2023 | Tracer-nanoparticle co-migration | − | 200 nm | Porous medium | [62] |
| Lignin CQD | 2023 | Detection of microplastics by fluorescence and Rayleigh scattering | PS | − | − | [63] |
| DPNA | 2024 | Microplastics in water and soil | Polyurethane | 106−425 µm | Water/soil | [64] |
| PCP | 2024 | Quantify and label | PS-COOH | 50 nm | Water/plants | [65] |
| Nile Red | 2024 | Sampling and detection, modeling | PP, PE, PU, rubber, Asphalt | 20 µm–5 mm | Groundwater and soil | [66] |
| Carbon dots | 2025 | Detection of submicron plastics | PS | ~200 nm | Water | [67] |
| Note: Carbon quantum dots, CQD; boron-doped carbon nanoparticles, BCNPs; L-ascorbic acid, LAA; 4–chloro-7-nitro-1,2, 3-benzoxadiazole, NBD-Cl; Nile blue, NB; (E)-N-(2-((4-(diphenylamino)benzylidene)amino)phenyl)-7-nitrobenzo[c][1,2,5]oxadiazol-4-amine, DPNA; 4-[1-cyano-2-[4-(diethylamino)-2-hydroxyphenyl]ethenyl]-1-ethylpyridinium, PCP. | ||||||
下载: 导出CSV
Table 3. Technical characteristics of rapid micro/nano plastic detection and analysis.
| Detection tools | Year | Treatment | Type of plastic | Source | Size | Limitation | Anti-interference | Mechanism | Ref. | ||||||||||||||||||||||||||||||||||||||||||||||||||||||||||||||||||||||||||||||||||||||||||||||||||||||||||||||||||||||||||||||||||||||||||||||||||||||||||||||||
| Cationic fluorescent probe | 2024 | Release at 75 ℃ + tap water sample | PS-COOH, PS-NH2, PE, PET | Food packaging/tap water/lake water | 50, 160, 170, 670 nm | 0.525 mg/L | Salinity-dependent, pH-dependent; does not react with inorganic, metallic, organic substances, etc. | Electrostatic interaction/ hydrophobicity/molecular restriction of rotation/fluorescence | [65] | ||||||||||||||||||||||||||||||||||||||||||||||||||||||||||||||||||||||||||||||||||||||||||||||||||||||||||||||||||||||||||||||||||||||||||||||||||||||||||||||||
| Dual-positive charged fluorescent probe | 2025 | Release in water at 95 ℃ | PE, PP, PS, ABS, POM, PMMA, PVC, PBAT, PC, PA | Purchase/teabag release | – | 5.0 mg/mL | Selective and photostable | Electrostatic interaction/AIE | [81] | ||||||||||||||||||||||||||||||||||||||||||||||||||||||||||||||||||||||||||||||||||||||||||||||||||||||||||||||||||||||||||||||||||||||||||||||||||||||||||||||||
| Flow cytometer | 2021 | Fixed concentration flow rate | PS | Purchase | 3 µm | 1 × 10⁵ items/s | Distinguish background particles based on emission spectra | Fluorescence/scattered light | [82] | ||||||||||||||||||||||||||||||||||||||||||||||||||||||||||||||||||||||||||||||||||||||||||||||||||||||||||||||||||||||||||||||||||||||||||||||||||||||||||||||||
| In-situ Mie scattering | 2024 | Determine the optimal excitation wavelength at 335 nm | PS, PE, PC | Purchase/grinding | 25–1000 nm | 25 nm 4.2 µg/L | Bottled water simulation 91.4%–110.3% | Mie scattering | [83] | ||||||||||||||||||||||||||||||||||||||||||||||||||||||||||||||||||||||||||||||||||||||||||||||||||||||||||||||||||||||||||||||||||||||||||||||||||||||||||||||||
| Photoacoustic microscopy + deep learning | 2024 | Sample extraction, optimization of excitation wavelength 532 nm | PVC, PS, PC, PU, PP, PE, PET, PTFE | Water/soil sampling | 7–20 µm | 2.5 µm | – | Light absorption properties | [84] | ||||||||||||||||||||||||||||||||||||||||||||||||||||||||||||||||||||||||||||||||||||||||||||||||||||||||||||||||||||||||||||||||||||||||||||||||||||||||||||||||
| Polarized light + backpropagation neural network | 2024 | Aging under 365 nm UV in artificial seawater | PE, PP, PS | Purchase | 0.2–60 µm | 0.2 µm | Degree of weathering, type of plastic | Polarization properties of scattered light | [85] | ||||||||||||||||||||||||||||||||||||||||||||||||||||||||||||||||||||||||||||||||||||||||||||||||||||||||||||||||||||||||||||||||||||||||||||||||||||||||||||||||
| Novel dye combined with smartphones | 2024 | PE/PET in 5% ethanol; PU/PVC/PET in 30% ethanol. | PE, PU, PP, PVC, PS, PET | Purchase/grinding | <300 µm 2 − 3 mm | 25 µm | River water/soil simulation | TICT/AIE/polarity/ hydrogen bonding | [86] | ||||||||||||||||||||||||||||||||||||||||||||||||||||||||||||||||||||||||||||||||||||||||||||||||||||||||||||||||||||||||||||||||||||||||||||||||||||||||||||||||
| Boron-doped carbon nanoparticles | 2022 | 70 ℃, 4 h | PE, PP, PVC, PS, PET, PMMA, PC | Plastic products crushed | 5000 µm | > 5 mm | Separation from soil | Polarity/fluorescence | [87] | ||||||||||||||||||||||||||||||||||||||||||||||||||||||||||||||||||||||||||||||||||||||||||||||||||||||||||||||||||||||||||||||||||||||||||||||||||||||||||||||||
| Conjugated polymer nanoparticles | 2022 | Mixed in phosphate buffer | PE, PP, PS, PC | Plastic products crushed | − | 0.2 µm | Soil suspension | Hydrophobicity/electrostatic interaction/fluorescence | [88] | ||||||||||||||||||||||||||||||||||||||||||||||||||||||||||||||||||||||||||||||||||||||||||||||||||||||||||||||||||||||||||||||||||||||||||||||||||||||||||||||||
| Green fluorescent polymeric carbon nitride | 2023 | 70 ℃, 60 min | PS | Release of lunchboxes | 0.22−50 µm/ > 50 µm | 0.22 µm | Staining in water, ethanol elution | Polar/organophilic/aggregate fluorescence | [89] | ||||||||||||||||||||||||||||||||||||||||||||||||||||||||||||||||||||||||||||||||||||||||||||||||||||||||||||||||||||||||||||||||||||||||||||||||||||||||||||||||
| Cu-g-C3N5 | 2023 | Incubation at different temperatures | PC releases BPA | − | − | 0.09 mg/L BPA | − | Catalytic oxidation | [90] | ||||||||||||||||||||||||||||||||||||||||||||||||||||||||||||||||||||||||||||||||||||||||||||||||||||||||||||||||||||||||||||||||||||||||||||||||||||||||||||||||
| Fluorescence microfluidic system | 2024 | Ethanol/water solution dispersion, Nile Red staining | PS, PVC | Purchase/grinding | 0.32−5.88 µm | 0.1 − 100 mg/L | Susceptible to fluorescence interference | Fluorescence | [91] | ||||||||||||||||||||||||||||||||||||||||||||||||||||||||||||||||||||||||||||||||||||||||||||||||||||||||||||||||||||||||||||||||||||||||||||||||||||||||||||||||
| Gallios flow cytometer and machine learning | 2024 | Dispersed in EPS medium | PE, PP, PVC, PS, PET, PS, PHA | Purchase | 1 − 50 µm | 0.07−14.8 mg/mL | Distinguish microorganisms, mineral particles | Fluorescence/scattered light | [92] | ||||||||||||||||||||||||||||||||||||||||||||||||||||||||||||||||||||||||||||||||||||||||||||||||||||||||||||||||||||||||||||||||||||||||||||||||||||||||||||||||
| AI-assisted nano-DIHM | 2024 | Suspension onto a quartz microscopic slide | PE, PP, PVC, PS, PET, PUR, PSL | Purchase/lake sampling | 197 nm–4 mm | 50 nm | Distinguishing: magnetite/phytoplankton/ oleic acid | The holographic diffraction pattern | [93] | ||||||||||||||||||||||||||||||||||||||||||||||||||||||||||||||||||||||||||||||||||||||||||||||||||||||||||||||||||||||||||||||||||||||||||||||||||||||||||||||||
| Electrochemical analysis of metal labeling | 2024 | Reduced AgNO3 deposition | PS | Purchase | 100–500 nm | 0.1 mg/mL | Cation interference, K+/Ca2+/Na+ | Electrode redox signal | [94] | ||||||||||||||||||||||||||||||||||||||||||||||||||||||||||||||||||||||||||||||||||||||||||||||||||||||||||||||||||||||||||||||||||||||||||||||||||||||||||||||||
| Laser-induced fluorescence + principal component analysis | 2024 | 3.5% NaCl solution or natural seawater dispersion; identified by 405 nm excitation light | PE, PP, PVC, PS, PET, PLA, PA, PMMA, PTFE, ABS | Purchase | 10–30 µm | Mass concentration 0.03% | Less impact from seawater | Radiative/non-radiative transition/fluorescence | [95] | ||||||||||||||||||||||||||||||||||||||||||||||||||||||||||||||||||||||||||||||||||||||||||||||||||||||||||||||||||||||||||||||||||||||||||||||||||||||||||||||||
| Gelpermeation chromatography-ultraviolet detection | 2024 | 5% HCl assisted extraction, THF solubilization filtered; UV absorption wavelength 262 nm determined | PS | Soil sample collection | – | 0.02 µg/mL | – | UV-absorbing phenyl groups in PS | [96] | ||||||||||||||||||||||||||||||||||||||||||||||||||||||||||||||||||||||||||||||||||||||||||||||||||||||||||||||||||||||||||||||||||||||||||||||||||||||||||||||||
| Note: Polyhydroxyalkanoates, PHA; twisted intramolecular charge transfer, TICT; aggregation-induced emission, AIE; artificial intelligence-assisted nanodigital in-line holographic microscopy, AI-assisted nano-DIHM; gel permeation chromatography-ultraviolet detection, GPC-UV; tetrahydrofuran, THF. | |||||||||||||||||||||||||||||||||||||||||||||||||||||||||||||||||||||||||||||||||||||||||||||||||||||||||||||||||||||||||||||||||||||||||||||||||||||||||||||||||||||||||
下载: 导出CSV
Table 4. Application of modeling and algorithm analysis methods.
| Analysis object | Algorithm/Model | Properties of MPs | Application scenarios | Ref. | ||||||||||||||||||||||||||||||||||||||||||||||||||||||||||||
| Fluorescent label recognition | CART supervised machine learning | 50–1200 µm | Environmental samples | [69] | ||||||||||||||||||||||||||||||||||||||||||||||||||||||||||||
| Porous flow, resistance, and diffusion behavior | Dispersion–drag force coupled mode + porous flow model+ experiment | PS 80 ± 5 nm | Soil-groundwater | [75] | ||||||||||||||||||||||||||||||||||||||||||||||||||||||||||||
| Photoacoustic microscopic imaging | Deep neural network | Plastic samples in water and soil | Sample analysis | [84] | ||||||||||||||||||||||||||||||||||||||||||||||||||||||||||||
| Polarized light | Back propagation neural network | Weathered microplastics 0.2–60 µm | Water environment monitoring | [85] | ||||||||||||||||||||||||||||||||||||||||||||||||||||||||||||
| Image and morphological parameters | Deep neural network | Various plastic/non-plastic particles | Water environment monitoring | [93] | ||||||||||||||||||||||||||||||||||||||||||||||||||||||||||||
| Fluorescence | Principal components analysis | 10–30 µm various plastic | Water environment monitoring | [95] | ||||||||||||||||||||||||||||||||||||||||||||||||||||||||||||
| Settlement behavior influenced by shape | Settling model + genetic programming + symbolic regression | – | Settlement behavior in aquatic environment | [151] | ||||||||||||||||||||||||||||||||||||||||||||||||||||||||||||
| Settling behavior influenced by shape | Static water settling model + experiment | <5 mm fragments | Settlement behavior in aquatic environment | [156] | ||||||||||||||||||||||||||||||||||||||||||||||||||||||||||||
| Mass balance and fluid dynamics equations | Settling model modified by Stokes equation + turbulence model | Non spherical shape 1–5000 µm | Settlement and resuspension in rivers | [157] | ||||||||||||||||||||||||||||||||||||||||||||||||||||||||||||
| Microplastic adhesion behavior | XDLVO model | Three different shapes | – | [158] | ||||||||||||||||||||||||||||||||||||||||||||||||||||||||||||
| Migration behavior | The advection-dispersion equation coupled with the first- or second-order kinetic deposition site + FDLVO | Fibers and fragments | Porous media under the influence of electrolytes and surfactants | [159] | ||||||||||||||||||||||||||||||||||||||||||||||||||||||||||||
| Migration behavior in porous media | XDLVO; the advection- dispersion-equation; Young-Laplace equation | PBAT-MPs 13 µm | The influence of surface functional groups and roughness | [160] | ||||||||||||||||||||||||||||||||||||||||||||||||||||||||||||
| Raman spectrum analysis | Convolutional neural network | Various plastics 2–145 µm | Distinguish between plastic and natural organic matter | [161] | ||||||||||||||||||||||||||||||||||||||||||||||||||||||||||||
| Note: The extended Derjaguin-Landau-Verwey-Overbeek, XDLVO; The flow Derjaguin-Landau-Verwey-Overbeek, FDLVO; polybutylene adipate terephthalate, PBAT. | ||||||||||||||||||||||||||||||||||||||||||||||||||||||||||||||||
下载: 导出CSV

 扫一扫看文章


扫一扫关注我们


 下载:
下载: